
6.7 KiB
Name
基于Z距离的VWAP策略ZVWAP-Strategy-Based-on-Z-Distance-from-VWAP
Author
ChaoZhang
Strategy Description
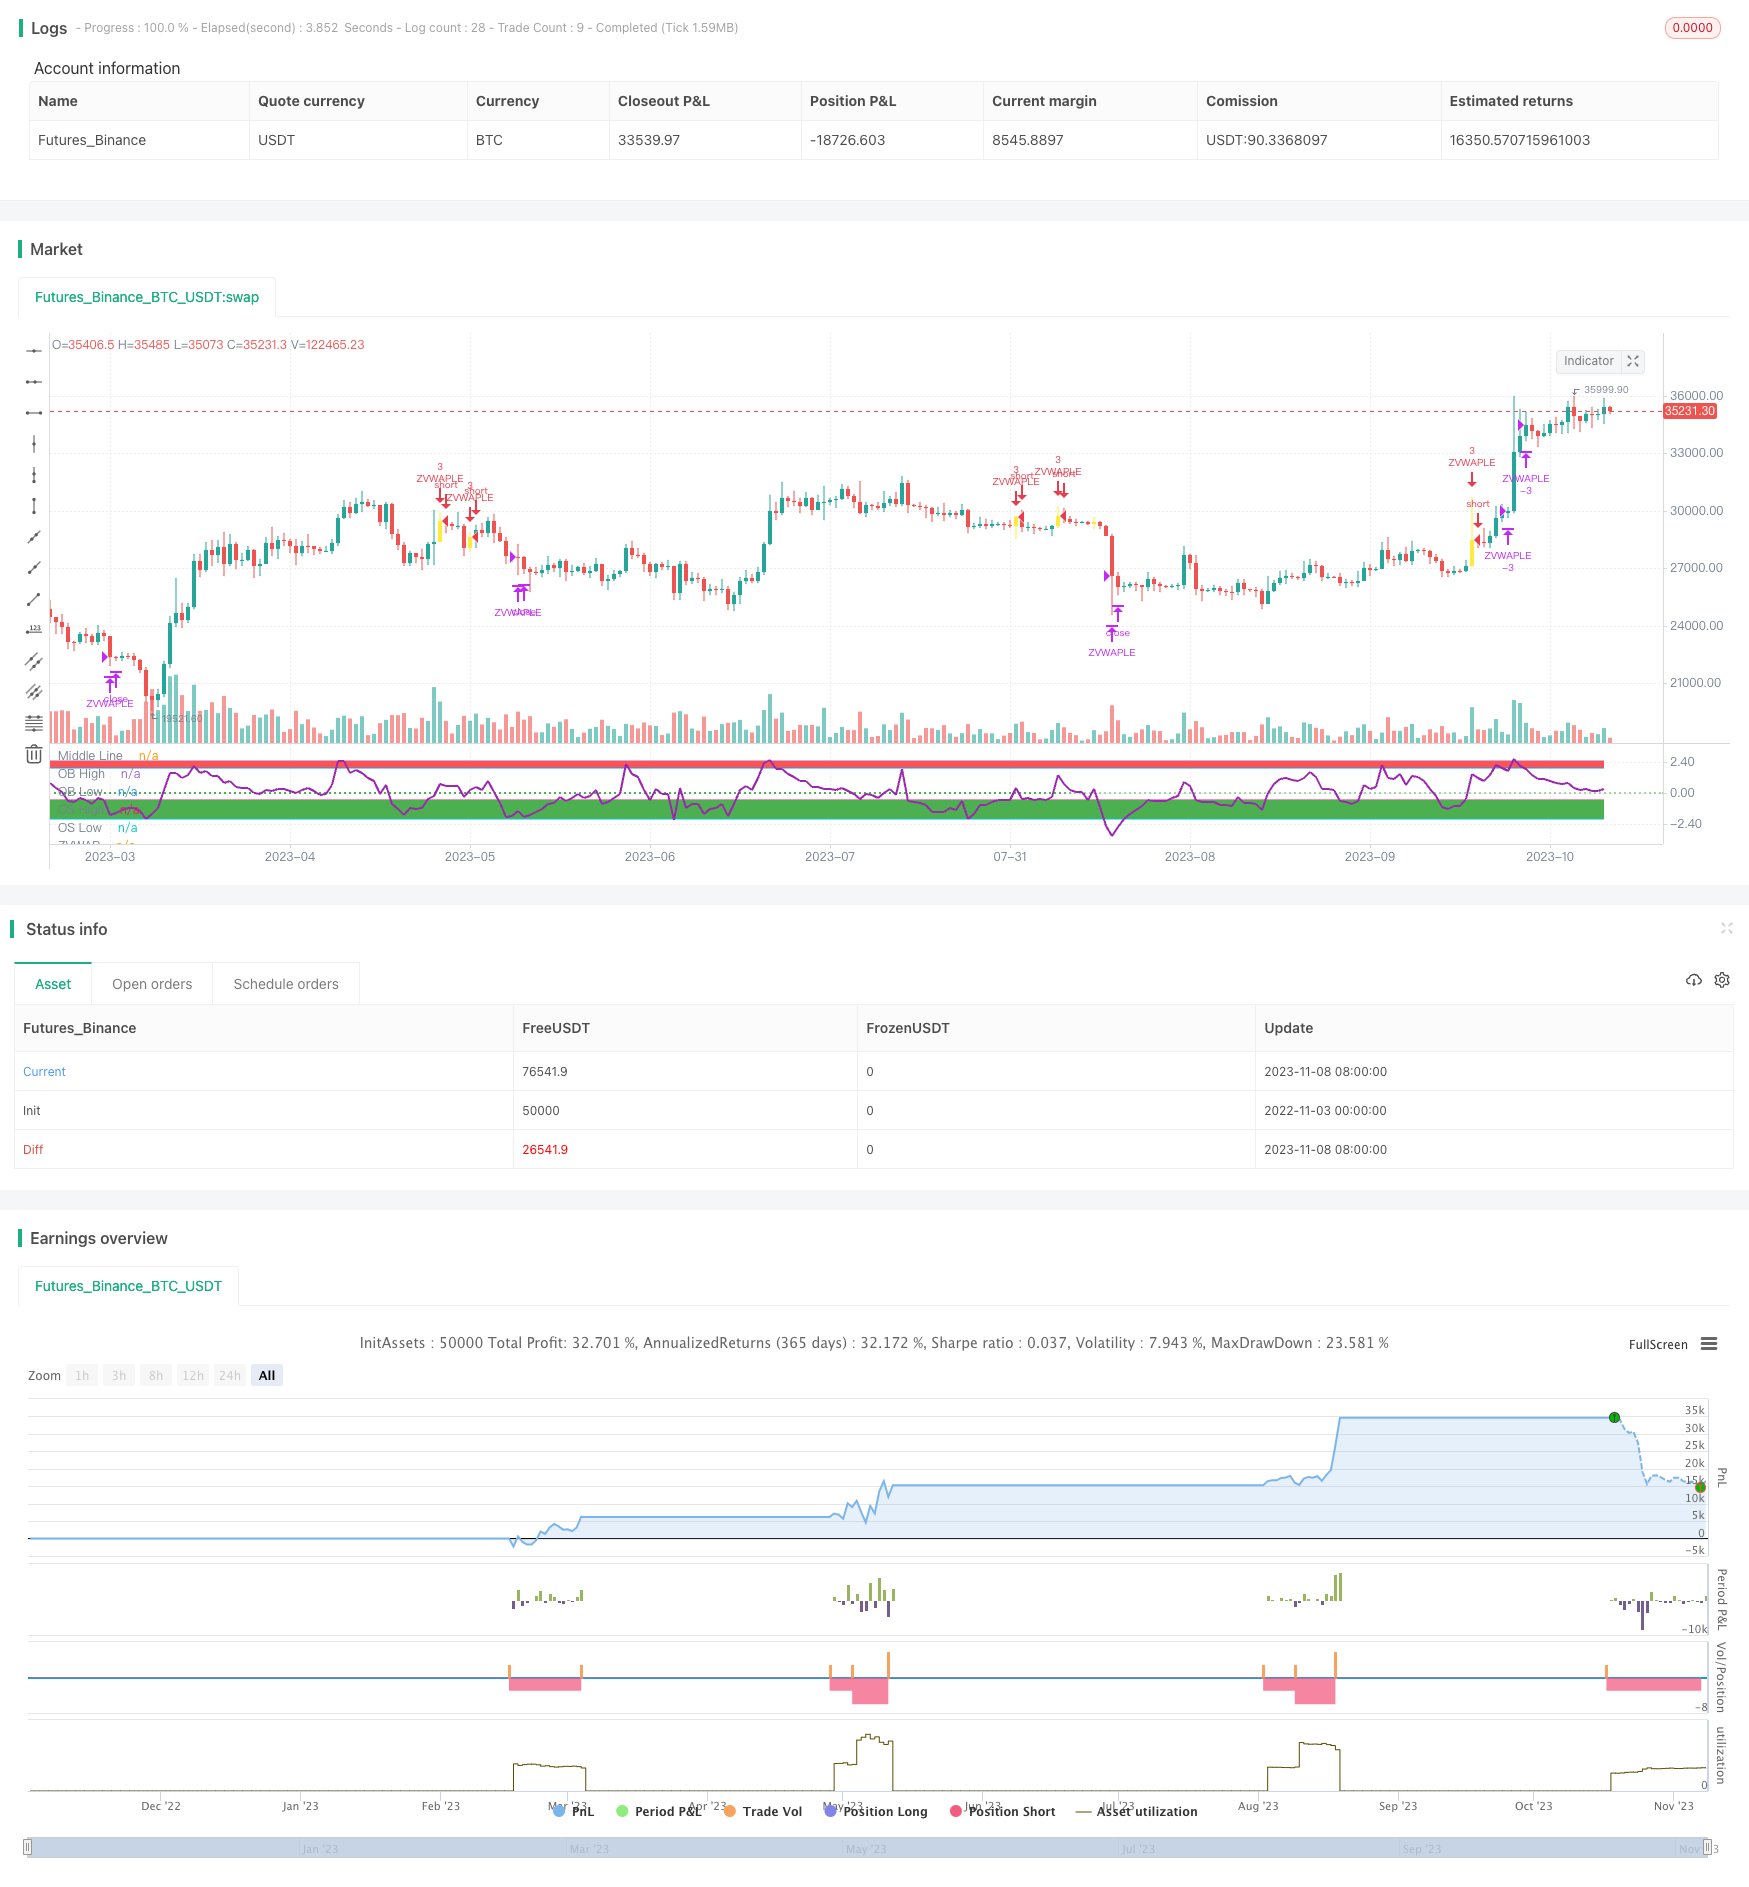 [trans]
概述
该策略基于LazyBear的Z距离VWAP指标,通过计算价格与VWAP的Z距离来判断是否超买超卖,以及进行入场出场。策略加入EMA均线以及Z距离回归0轴的判断,可过滤掉部分噪声信号。
策略原理
- 计算VWAP的值
- 计算价格与VWAP的Z距离
- 设置超买线(2.5)和超卖线(-0.5)
- 当快线大于慢线,Z距离低于超卖线,且Z距离上穿0轴时做多
- 当Z距离超过超买线时平仓
- 加入止损逻辑
关键函数:
- calc_zvwap:计算价格与VWAP的Z距离
- VWAP值:vwap(hlc3)
- 快线:ema(close,fastEma)
- 慢线:ema(close,slowEma)
优势分析
- 使用Z距离更直观判断超买超卖
- 结合EMA过滤假突破,避免被套
- 允许加仓,可以利用趋势获利
- 有止损逻辑,可以控制风险
风险分析
- 需确保参数设置合理,如超买超卖线位置,EMA周期等
- Z距离指标有滞后,可能错过关键买卖点
- 允许加仓会增大损失风险
- 止损位置需要合理设置
解决方法:
- 通过回测优化参数设置
- 结合额外指标过滤信号
- 合理设置加仓条件
- 动态调整止损位置
优化方向
- 优化EMA周期参数
- 测试不同的超买超卖判断标准
- 加入其他指标过滤信号噪音
- 测试不同的止损方式
- 优化入场、加仓和止损逻辑
总结
该策略利用Z距离判定价格与VWAP的关系,结合EMA过滤噪音信号,以捕捉趋势机会。策略允许加仓追踪趋势,同时设置止损控制风险。通过参数优化及加入其他指标可以提高策略稳定性。但Z距离指标存在滞后问题,在优化时需考量。总体来说,该策略以简单清晰的逻辑捕捉趋势,经过充分优化后可成为高效的趋势跟踪策略。
||
Overview
This strategy is based on the Z-distance from VWAP indicator by LazyBear. It uses the Z-distance between price and VWAP to determine overbought and oversold conditions, as well as entries and exits. The strategy incorporates EMA lines and Z-distance crossing 0 level to filter out some noise.
Strategy Logic
- Calculate VWAP value
- Calculate Z-distance between price and VWAP
- Set overbought line (2.5) and oversold line (-0.5)
- Go long when fast EMA > slow EMA, Z-distance < oversold line and Z-distance crosses above 0
- Close position when Z-distance > overbought line
- Incorporate stop loss logic
Key Functions:
- calc_zvwap: Calculate Z-distance between price and VWAP
- VWAP value: vwap(hlc3)
- Fast EMA: ema(close,fastEma)
- Slow EMA: ema(close,slowEma)
Advantage Analysis
- Z-distance intuitively shows overbought/oversold levels
- EMA filters out false breakouts
- Allows pyramiding to capitalize on trends
- Has stop loss logic to control risk
Risk Analysis
- Need to ensure parameters like lines, EMA periods are set properly
- Z-distance indicator lags, may miss key turning points
- Pyramiding can increase loss if trend reverses
- Stop loss needs to be set reasonably
Solutions:
- Optimize parameters via backtesting
- Add other indicators to filter signals
- Set proper conditions for pyramiding
- Use dynamic stop loss
Optimization Directions
- Optimize EMA periods
- Test different overbought/oversold criteria
- Add other indicators to filter noise
- Test different stop loss techniques
- Optimize entry, pyramiding and stop loss logic
Summary
The strategy uses Z-distance to determine price-VWAP relationship and adds EMA to filter signals, aiming to capture trend opportunities. It allows pyramiding to follow trends and has a stop loss to control risk. Optimization and adding other indicators can improve robustness. However, lagging issue of Z-distance should be considered during optimization. Overall, this is a trend-following strategy with simple, clear logic. When fully optimized, it can be an efficient tool to trade trends.
[/trans]
Strategy Arguments
| Argument | Default | Description |
|---|---|---|
| v_input_1 | 13 | length |
| v_input_2 | -0.5 | OverSold Line |
| v_input_3 | 2 | OverBought Line |
| v_input_4 | 13 | Fast EMA |
| v_input_5 | 55 | Slow EMA |
| v_input_6 | 5 | Stop Loss |
Source (PineScript)
/*backtest
start: 2022-11-03 00:00:00
end: 2023-11-09 00:00:00
period: 1d
basePeriod: 1h
exchanges: [{"eid":"Futures_Binance","currency":"BTC_USDT"}]
*/

// This source code is subject to the terms of the Mozilla Public License 2.0 at https://mozilla.org/MPL/2.0/
// © mohanee

//@version=4
//This is based on Z distance from VWAP by Lazybear
strategy(title="ZVWAP[LB] strategy", overlay=false,pyramiding=2, default_qty_type=strategy.fixed, default_qty_value=3,    initial_capital=10000, currency=currency.USD)
length=input(13,"length")

calc_zvwap(pds, source1) =>
	mean = sum(volume*source1,pds)/sum(volume,pds)
	vwapsd = sqrt(sma(pow(source1-mean, 2), pds) )
	(close-mean)/vwapsd


upperTop=2.5  //input(2.5)
upperBottom=2.0  //input(2.0)
lowerTop=-0.5  //input(-0.5)
lowerBottom=-2.0 //input(-2.0)

buyLine=input(-0.5, title="OverSold Line",minval=-2, maxval=3)
sellLine=input(2.0, title="OverBought Line",minval=-2, maxval=3)

fastEma=input(13, title="Fast EMA",minval=1, maxval=50)
slowEma=input(55, title="Slow EMA",minval=10, maxval=200)

stopLoss =input(5, title="Stop Loss",minval=1)

hline(0, title="Middle Line", linestyle=hline.style_dotted, color=color.green)

ul1=plot(upperTop, "OB High")
ul2=plot(upperBottom, "OB Low")
fill(ul1,ul2, color=color.red)
ll1=plot(lowerTop, "OS High")
ll2=plot(lowerBottom, "OS Low")
fill(ll1,ll2, color=color.green)
zvwapVal=calc_zvwap(length,close)
plot(zvwapVal,title="ZVWAP",color=color.purple, linewidth=2)


longEmaVal=ema(close,slowEma)
shortEmaVal=ema(close,fastEma)

vwapVal=vwap(hlc3)


zvwapDipped=false

for i = 1 to 10
    zvwapDipped := zvwapDipped or zvwapVal[i]<=buyLine

longCondition=  shortEmaVal > longEmaVal  and zvwapDipped and  crossover(zvwapVal,0)

barcolor(longCondition ? color.yellow: na)

strategy.entry(id="ZVWAPLE", long=true,  when= longCondition  and strategy.position_size<1)


//Add
strategy.entry(id="ZVWAPLE", comment="Add", long=true,  when= strategy.position_size>1 and close<strategy.position_avg_price and crossover(zvwapVal,0))


//calculate stop Loss
stopLossVal =  strategy.position_avg_price -  (strategy.position_avg_price*stopLoss*0.01)

strategy.close(id="ZVWAPLE",comment="SL Exit",    when=close<stopLossVal)   //close all on stop loss

strategy.close(id="ZVWAPLE",comment="TPExitAll",    qty=strategy.position_size ,   when= crossunder(zvwapVal,sellLine))   //close all      zvwapVal>sellLine
Detail
https://www.fmz.com/strategy/431669
Last Modified
2023-11-10 12:02:19