
11 KiB
Name
基于SuperTrend和DEMA的趋势跟踪策略SuperTrend-and-DEMA-Based-Trend-Following-Strategy
Author
ChaoZhang
Strategy Description
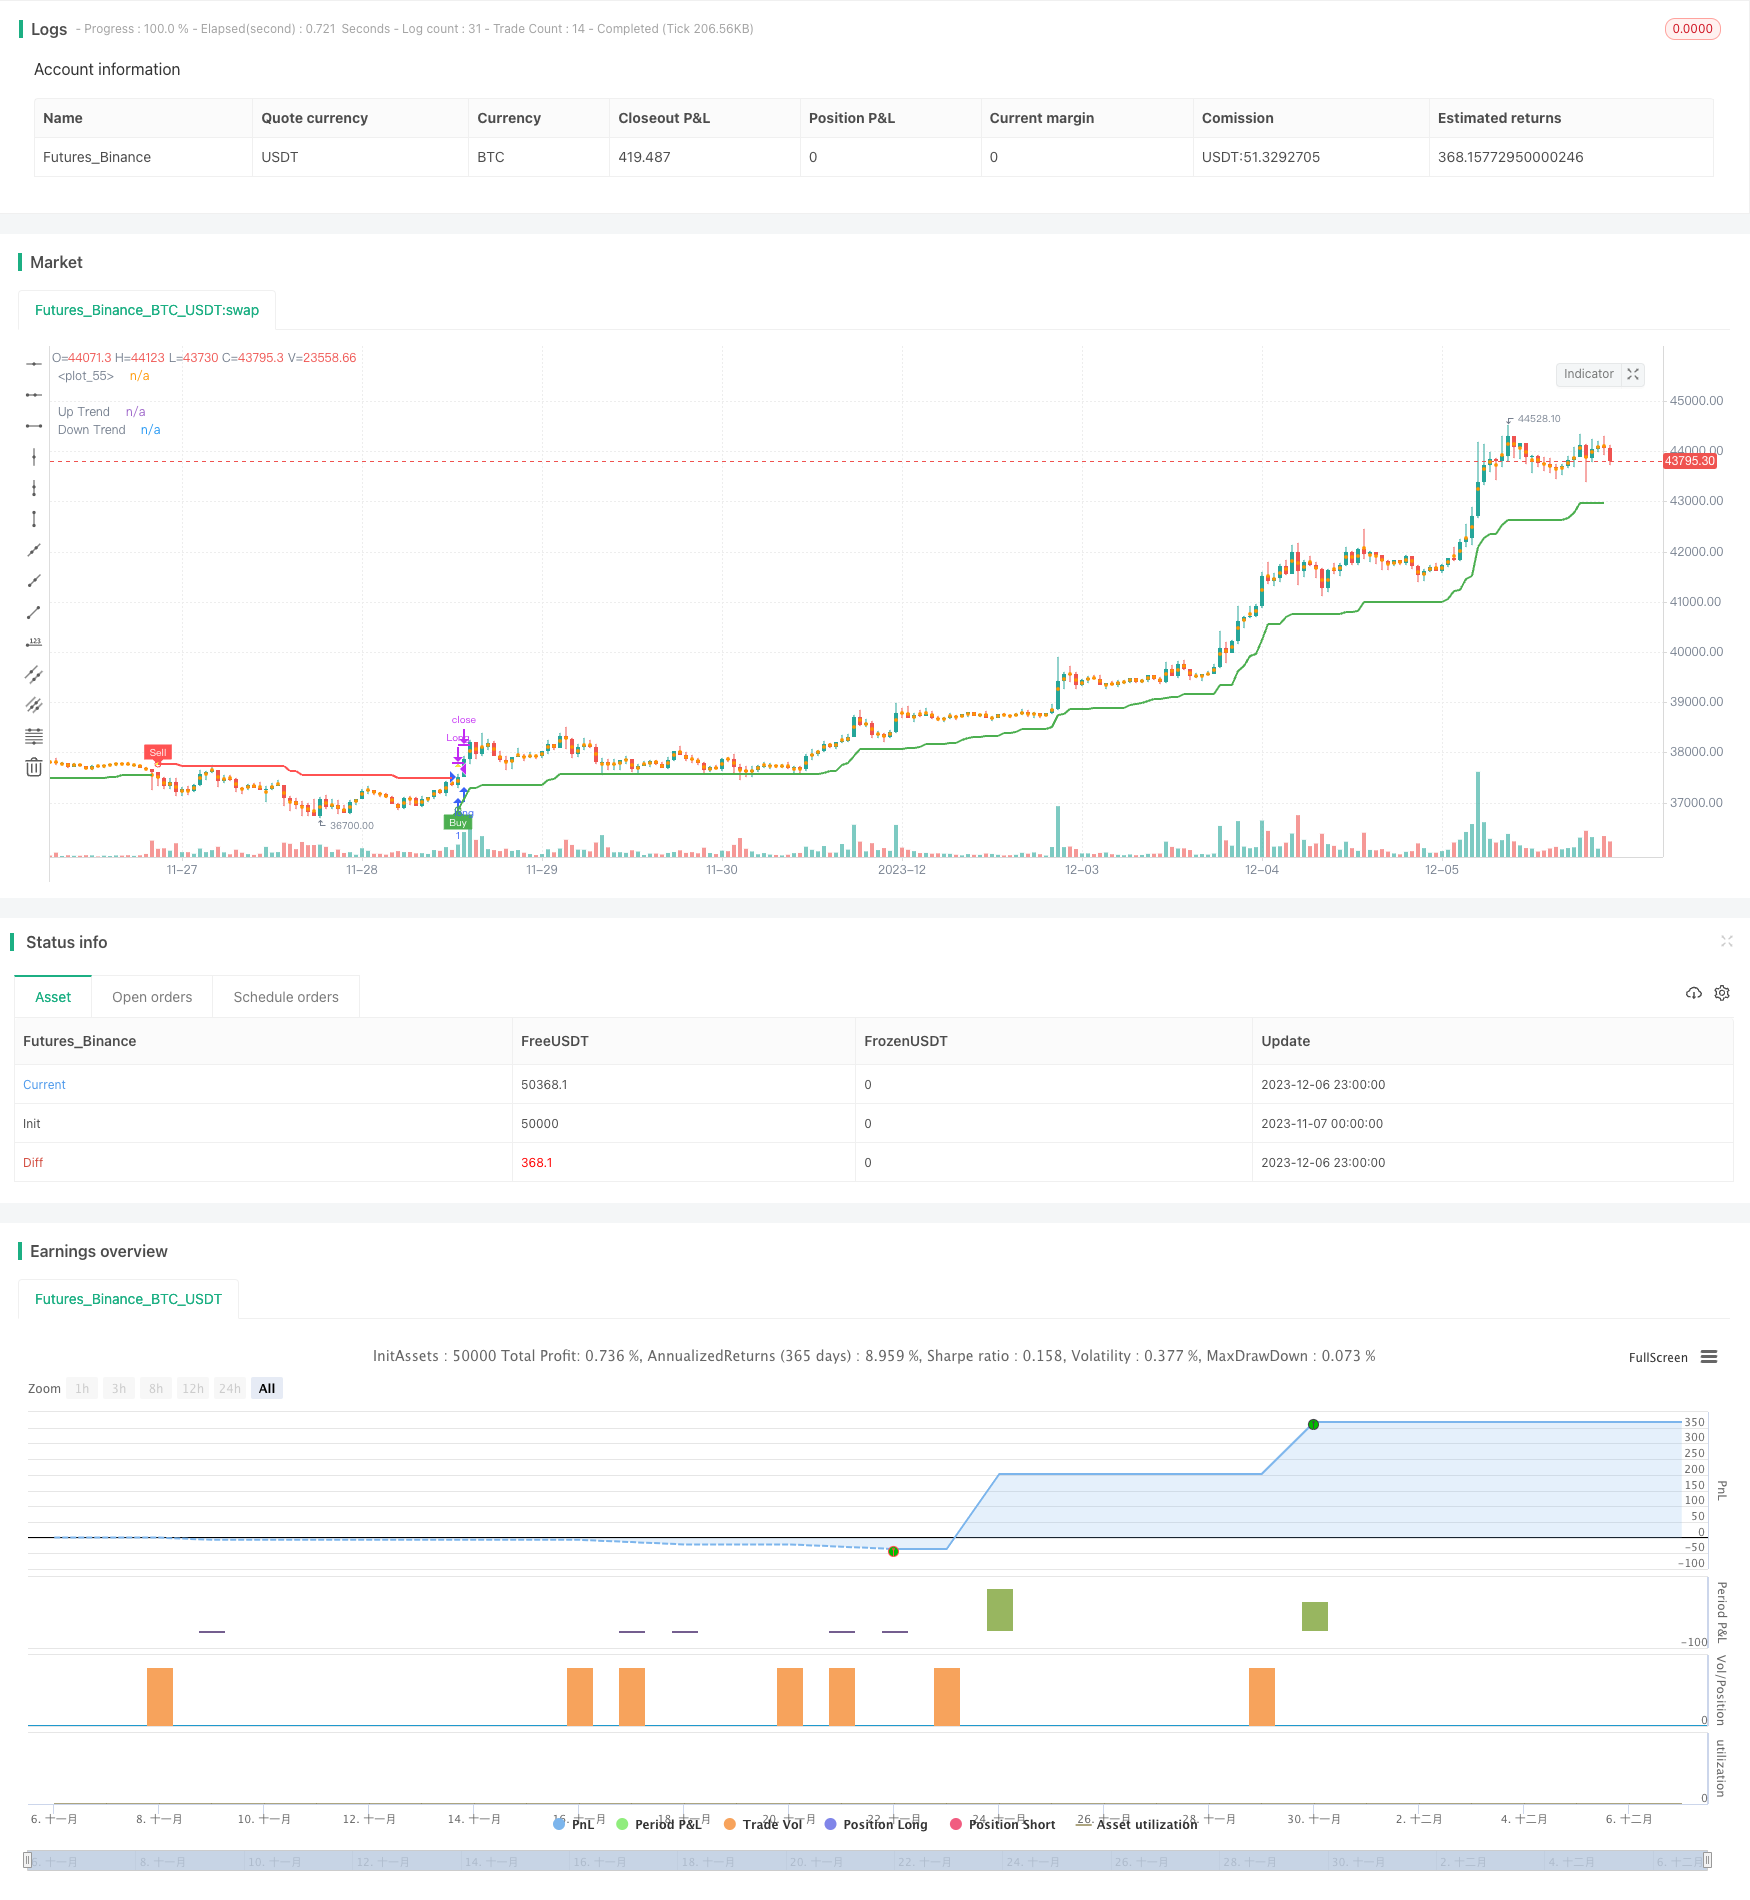 [trans]
概述
本策略结合了SuperTrend指标和DEMA指标,实现了一个趋势跟踪交易策略。当价格超过上轨时产生买入信号,当价格跌破下轨时产生卖出信号,结合DEMA指标过滤虚假信号。该策略适用于趋势性行情,能够有效跟踪趋势,过滤震荡。
策略原理
该策略主要基于SuperTrend指标判断价格趋势方向。SuperTrend指标结合ATR指标,能够有效判断价格趋势。当价格上涨时会形成上轨,当价格下跌时会形成下轨。当价格从下轨突破时为趋势转折,产生买入信号;当价格从上轨突破时为趋势转折,产生卖出信号。
为了过滤误报信号,该策略还结合了DEMA指标。只有当价格超过上轨且高于DEMA线时才产生买入信号;只有当价格跌破下轨且低于DEMA线时才产生卖出信号。这可以有效过滤震荡市场中的虚假信号。
具体来说,该策略的交易信号逻辑如下:
- 当价格从下轨突破时为趋势转折,产生买入信号
- 当价格从上轨突破时为趋势转折,产生卖出信号
- 只有当买入信号出现且价格高于DEMA线时,才实际产生买入信号
- 只有当卖出信号出现且价格低于DEMA线时,才实际产生卖出信号
通过这样的逻辑设计,能够在趋势성行情中顺势而为,避免在震荡市场中频繁开仓。
策略优势
- 结合SuperTrend指标和DEMA指标,实现趋势跟踪和信号过滤双重效果
- SuperTrend指标参数优化容易,可以根据不同品种和周期进行调整
- DEMA指标参数优化简单,无需重复测试
- 策略适用于趋势性行情,能够顺势而为,跟踪趋势
- 通过DEMA指标有效过滤震荡市场的假信号
- 策略实现简单,容易理解和修改
策略风险
- 策略无法很好应对价格剧烈波动的场景
- 在趋势反转时,可能出现亏损
- DEMA指标参数设置不当,可能错过买入/卖出的最佳时机
- SuperTrend指标参数如ATR周期设置不当,可能产生误报信号
风险解决方法:
- 优化DEMA参数和SuperTrend参数
- 结合止损策略,控制单次停损
- 在关键点增加确认机制,避免误报信号
策略优化方向
该策略可以从以下几个方面进行优化:
-
SuperTrend指标参数优化。可以测试不同的ATR周期参数,找到最佳参数组合。
-
DEMA指标参数优化。可以测试不同的参数,确定最佳的参数设置。
-
增加止损机制。可以根据ATR值设置止损位,避免止损过大。
-
增加信号过滤规则。可以在关键点增加其他指标的确认,避免误报信号。例如在趋势转折点增加量能指标的确认等。
-
优化仓位管理。可以根据市场波动性和风险状况动态调整仓位。
总结
本策略整合SuperTrend指标和DEMA指标的优点,实现了基于趋势跟踪和信号过滤的量化交易策略。策略优化空间较大,通过参数优化、止损机制和信号过滤等措施可以进一步改进策略的稳定性和盈利能力。该策略思路简单清晰易于实现,整体风险可控,适合量化交易实盘。 ||
Overview
This strategy combines the SuperTrend indicator and the DEMA indicator to implement a trend following trading strategy. It generates buy signals when the price breaks through the upper band and sell signals when the price breaks through the lower band. The DEMA indicator is used to filter out false signals. This strategy works well for trending markets and can effectively follow trends and filter out consolidations.
Strategy Logic
The core of this strategy relies on the SuperTrend indicator to determine the trend direction of prices. The SuperTrend indicator incorporates the ATR indicator and can effectively identify price trends. When prices rise, an upper band will form, and when prices fall, a lower band will form. A breakout from the lower band signals a trend reversal and generates a buy signal. A breakout from the upper band signals a trend reversal and generates a sell signal.
To filter out false signals, this strategy also incorporates the DEMA indicator. Buy signals are only generated when prices break through the upper band and are above the DEMA line. Sell signals are only generated when prices break through the lower band and are below the DEMA line. This effectively filters out false signals in ranging markets.
Specifically, the trading signal logic is as follows:
- A breakout from the lower band signals a trend reversal and generates a buy signal.
- A breakout from the upper band signals a trend reversal and generates a sell signal.
- A actual buy signal is only generated when the buy signal appears and the price is above the DEMA line.
- A actual sell signal is only generated when the sell signal appears and the price is below the DEMA line.
Through this logic design, the strategy can follow trends in trending markets and avoid frequently opening positions in ranging markets.
Advantages of the Strategy
- Combines the advantages of SuperTrend and DEMA indicators to achieve trend following and signal filtering.
- Easy to optimize SuperTrend parameters for different products and timeframes.
- Simple to optimize DEMA parameters without repeated testing.
- Suitable for trending markets, can follow trends effectively.
- False signals in ranging markets are filtered out by the DEMA indicator.
- Simple logic and easy to understand and modify.
Risks of the Strategy
- Cannot handle extreme price fluctuations well.
- May incur losses when trends reverse.
- Inappropriate DEMA parameter settings may miss best entry/exit points.
- Inappropriate SuperTrend parameters like ATR period may generate false signals.
Risk Management:
- Optimize DEMA and SuperTrend parameters.
- Use stop loss orders to limit losses.
- Add confirmation mechanisms at key points to avoid false signals.
Enhancement Areas
The strategy can be enhanced from the following aspects:
-
SuperTrend parameter optimization. Test different ATR period combinations to find optimum parameters.
-
DEMA parameter optimization. Test different values to determine optimum settings.
-
Add stop loss mechanism. Set stop loss based on ATR values to prevent oversized stops.
-
Add signal filters. Increase confirmation from other indicators at key points to prevent false signals. For example, add volume confirmation at trend reversal points.
-
Improve position sizing. Dynamically adjust sizes based on market volatility and risks.
Conclusion
This strategy combines the strengths of SuperTrend and DEMA indicators to implement a quantitative trading strategy based on trend following and signal filtering. There is ample room for optimization through parameter tuning, stop losses, and signal filters to further improve stability and profitability. The strategy logic is simple and easy to implement with controllable risks. It is suitable for live trading.
[/trans]
Strategy Arguments
| Argument | Default | Description |
|---|---|---|
| v_input_1 | 10 | ATR Period |
| v_input_2_hl2 | 0 | Source: hl2 |
| v_input_float_1 | 3 | ATR Multiplier |
| v_input_3 | true | Change ATR Calculation Method ? |
| v_input_4 | true | Show Buy/Sell Signals ? |
| v_input_5 | true | Highlighter On/Off ? |
Source (PineScript)
/*backtest
start: 2023-11-07 00:00:00
end: 2023-12-07 00:00:00
period: 1h
basePeriod: 15m
exchanges: [{"eid":"Futures_Binance","currency":"BTC_USDT"}]
*/

//@version=5
strategy('Krish\'s Supertrend Strategy', overlay=true)

// Supertrend Settings
Periods = input(title='ATR Period', defval=10)
src = input(hl2, title='Source')
Multiplier = input.float(title='ATR Multiplier', step=0.1, defval=3.0)
changeATR = input(title='Change ATR Calculation Method ?', defval=true)
showsignals = input(title='Show Buy/Sell Signals ?', defval=true)
highlighting = input(title='Highlighter On/Off ?', defval=true)

atr2 = ta.sma(ta.tr, Periods)
atr = changeATR ? ta.atr(Periods) : atr2

up = src - Multiplier * atr
up1 = nz(up[1], up)
up := close[1] > up1 ? math.max(up, up1) : up

dn = src + Multiplier * atr
dn1 = nz(dn[1], dn)
dn := close[1] < dn1 ? math.min(dn, dn1) : dn

trend = 1
trend := nz(trend[1], trend)
trend := trend == -1 and close > dn1 ? 1 : trend == 1 and close < up1 ? -1 : trend

upPlot = plot(trend == 1 ? up : na, title='Up Trend', style=plot.style_linebr, linewidth=2, color=color.new(color.green, 0))
buySignal = trend == 1 and trend[1] == -1

plotshape(buySignal ? up : na, title='UpTrend Begins', location=location.absolute, style=shape.circle, size=size.tiny, color=color.new(color.green, 0))
plotshape(buySignal and showsignals ? up : na, title='Buy', text='Buy', location=location.absolute, style=shape.labelup, size=size.tiny, color=color.new(color.green, 0), textcolor=color.new(color.white, 0))

dnPlot = plot(trend == 1 ? na : dn, title='Down Trend', style=plot.style_linebr, linewidth=2, color=color.new(color.red, 0))
sellSignal = trend == -1 and trend[1] == 1

plotshape(sellSignal ? dn : na, title='DownTrend Begins', location=location.absolute, style=shape.circle, size=size.tiny, color=color.new(color.red, 0))
plotshape(sellSignal and showsignals ? dn : na, title='Sell', text='Sell', location=location.absolute, style=shape.labeldown, size=size.tiny, color=color.new(color.red, 0), textcolor=color.new(color.white, 0))

// DEMA Settings
dema_length = 200
dema = ta.ema(close, dema_length)

// Long and Short Conditions
longCondition = buySignal and close > dema
shortCondition = sellSignal and close < dema

// Strategy Entry and Exit
strategy.entry('Long', strategy.long, when=longCondition)
strategy.entry('Short', strategy.short, when=shortCondition)

strategy.close('Long', when=ta.change(trend) or close < dema)
strategy.close('Short', when=ta.change(trend) or close > dema)

// Plotting
mPlot = plot(ohlc4, title='', style=plot.style_circles, linewidth=0)
longFillColor = highlighting ? trend == 1 ? color.green : color.white : color.white
shortFillColor = highlighting ? trend == -1 ? color.red : color.white : color.white

fill(mPlot, upPlot, title='UpTrend Highlighter', color=longFillColor, transp=90)
fill(mPlot, dnPlot, title='DownTrend Highlighter', color=shortFillColor, transp=90)

// Alerts (using plotshape for alerts in strategies)
plotshape(buySignal, title='SuperTrend Buy', color=color.new(color.green, 0), style=shape.triangleup, size=size.small)
plotshape(sellSignal, title='SuperTrend Sell', color=color.new(color.red, 0), style=shape.triangledown, size=size.small)
changeCond = trend != trend[1]
plotshape(changeCond, title='SuperTrend Direction Change', color=color.new(color.yellow, 0), style=shape.triangleup, size=size.small)
Detail
https://www.fmz.com/strategy/434711
Last Modified
2023-12-08 16:42:14