
8.1 KiB
Name
基于StochRSI和交易量的多空策略Stochastic-RSI-and-Volume-Based-Trading-Strategy
Author
ChaoZhang
Strategy Description
[trans]
概述
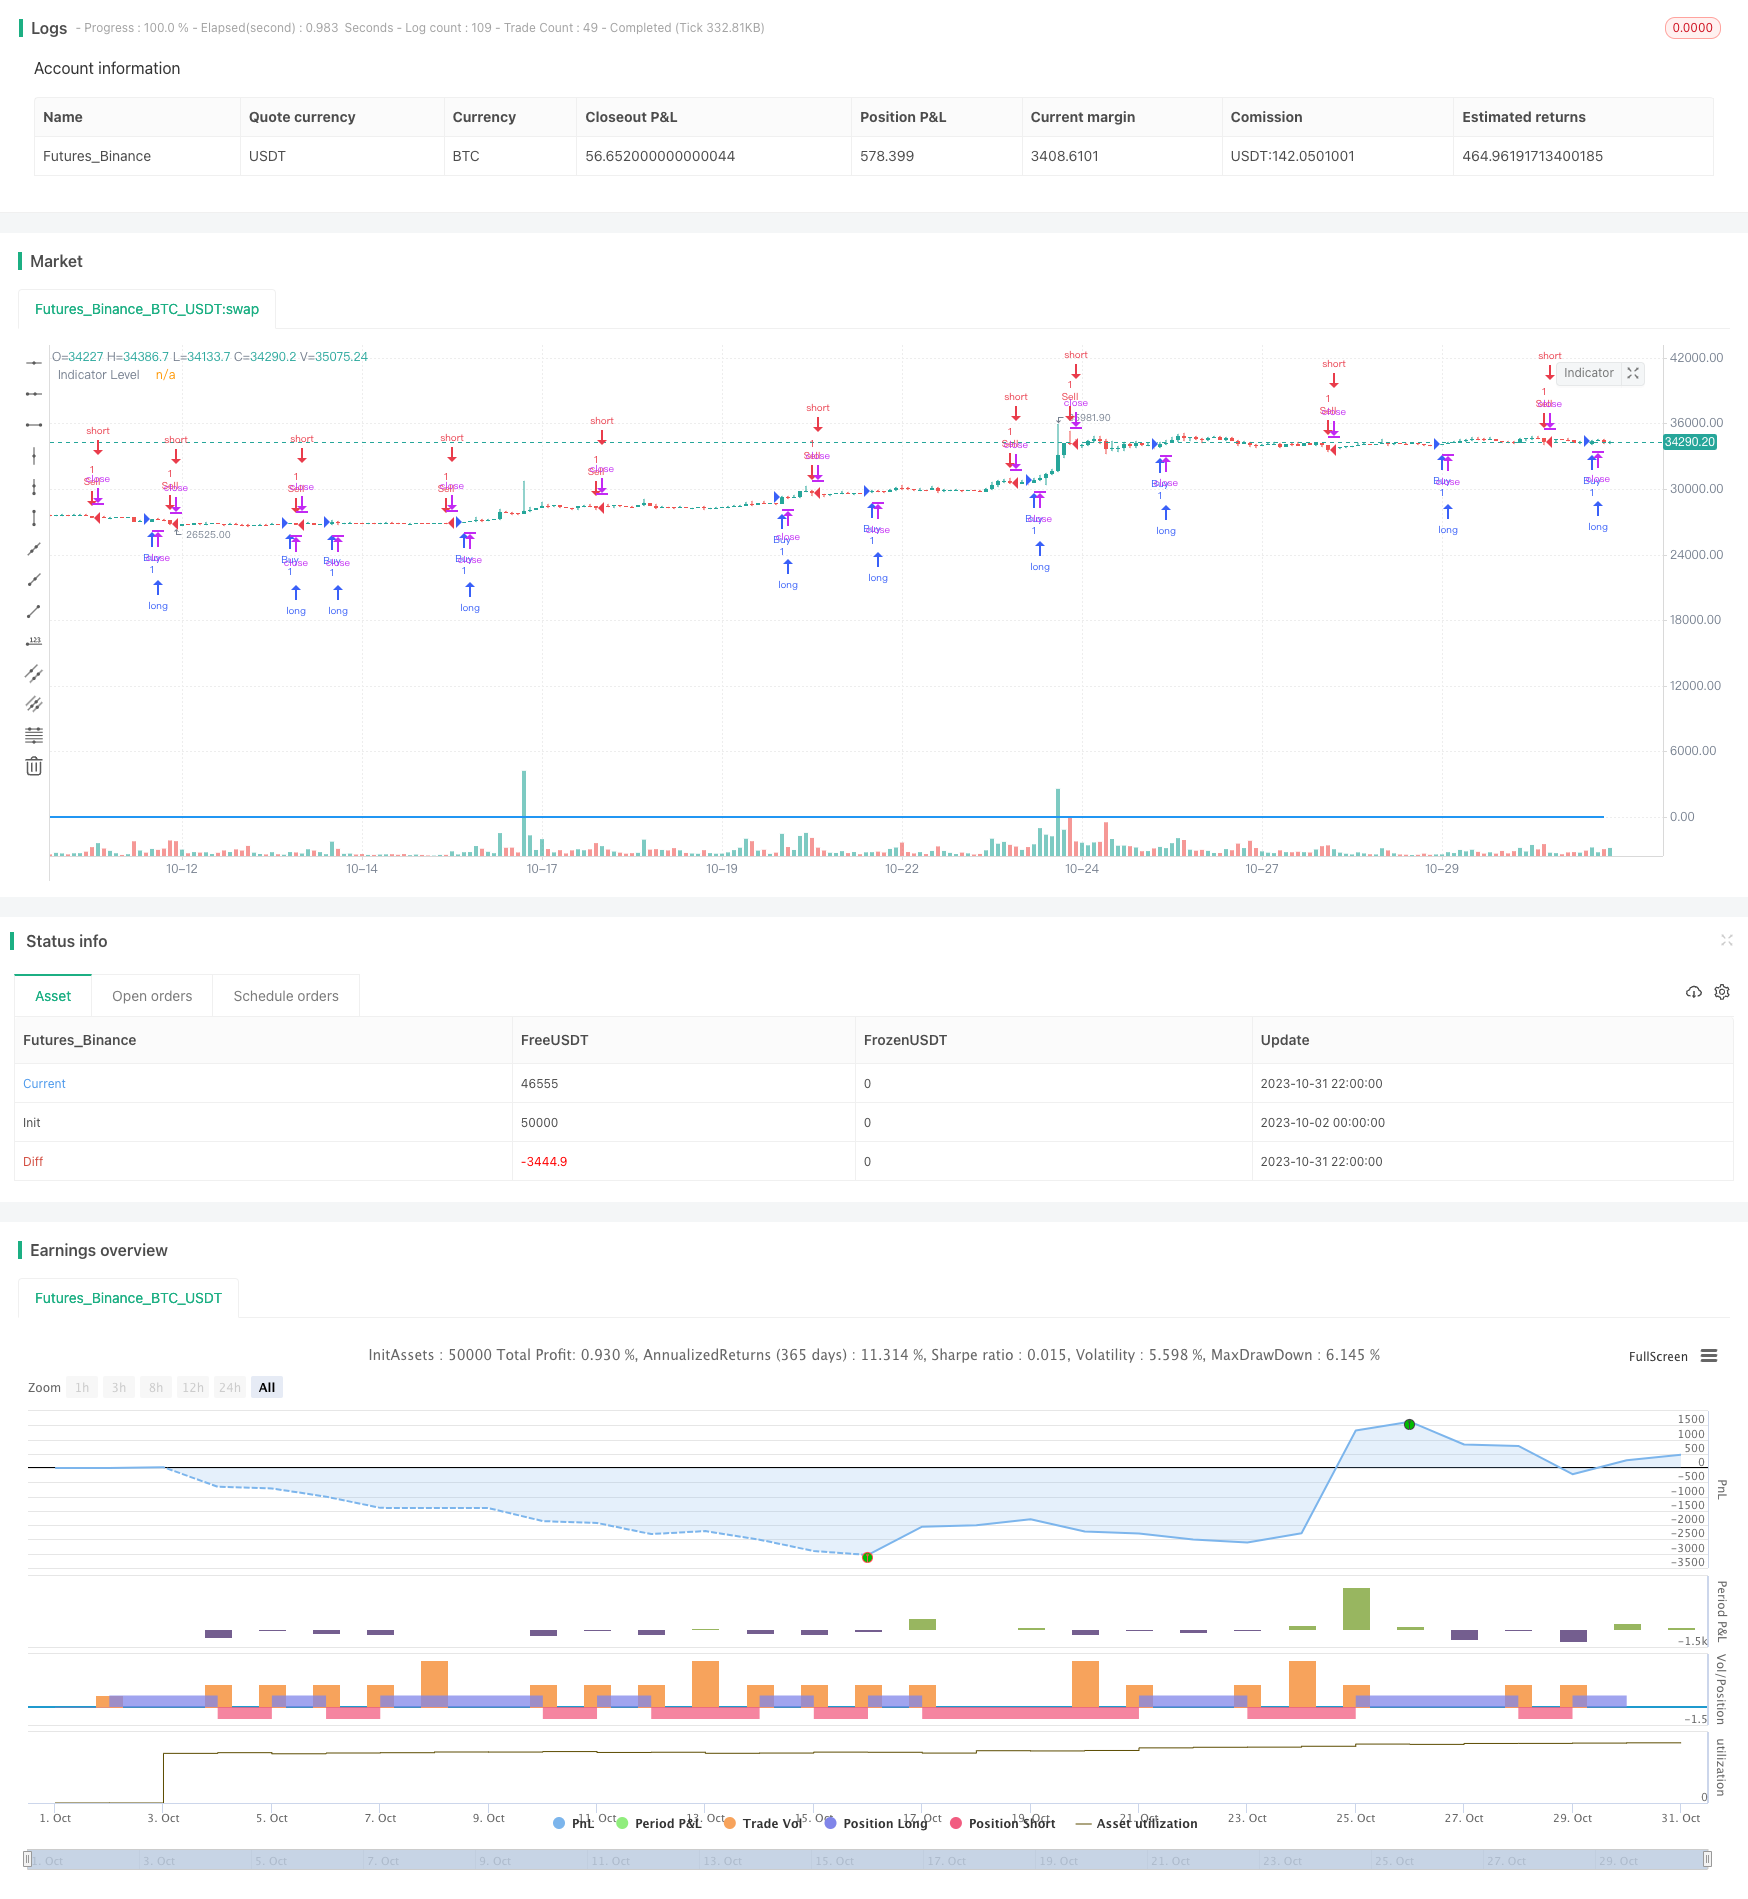
本策略结合了StochRSI指标和交易量,在StochRSI指标发出买入或卖出信号时,同时判断交易量是否大于过去7天的平均交易量。只有当指标信号和交易量条件同时满足时,才会进行买入或卖出操作。该策略旨在利用StochRSI指标判断超买超卖状态,同时用交易量过滤假信号,在高交易量的状况下寻找买入和卖出机会。
策略原理
首先,该策略计算14天RSI的值,然后在RSI上应用14天Stochastic指标,得到StochRSI的K值和D值。StochRSI指标在超买超卖区域发出信号。
然后,计算K值和D值的差值,当差值大于0时,指标水平设为1,小于0时设为-1。指标水平用于判断StochRSI的多空状态。
接着,计算过去7天的平均交易量。当K值上穿D值时(指标水平从负变正),并且收盘价高于开盘价,交易量大于平均量时,认为是买入信号。当K值下穿D值时(指标水平从正变负),并且收盘价低于开盘价,交易量大于平均量时,认为是卖出信号。
所以,该策略结合了StochRSI指标判断市场超买超卖状态,以及交易量来过滤假信号,在真实强势的行情中进行交易。
优势分析
-
StochRSI指标可以识别超买超卖状态,利用反转交易机会。结合交易量过滤可以避免在盘整区域出现的假信号。
-
交易量条件可以过滤低量的假突破。只在高交易量的趋势行情中交易,可以提高获利概率。
-
K值和D值均线交叉以及交易量条件组合,可以提高信号的可靠性,过滤假信号。
-
策略操作逻辑清晰简单,容易理解实现,适合用于量化交易。
风险分析
-
StochRSI指标存在时序问题,K值和D值交叉信号可能滞后,可能导致入场过早或过晚。需要优化参数以提高指标敏感性。
-
交易量放大效应可能导致策略在市场崩盘大跌时遭受重大损失。需要设置止损来控制风险。
-
只依靠StochRSI指标易受到假突破的影响,需要进一步优化,增加其他条件判断。
-
交易量 FILTER 可能会错过一些交易机会。可以结合成交笔、笔力分析进一步优化。
优化方向
-
优化StochRSI参数,寻找最佳K值、D值参数组合,提高指标的灵敏度。
-
增加成交量的均线指标,判断成交量趋势,避免交易量下跌期间的假信号。
-
增加其他指标,例如MACD,RSI等进行组合,提高信号的准确性。
-
增加止损策略,根据ATR等指标设置动态止损,控制单笔损失。
-
进行反向和同向交易量分析,避免同向交易量带来过度放大的风险。
-
根据市场阶段采用不同的参数,优化StochRSI的参数,使之更具有适应性。
总结
本策略首先利用StochRSI判断超买超卖状态,以及K值和D值的交叉来发出交易信号。同时,结合交易量指标来过滤假信号,只在真实强势行情中进行买入和卖出。该策略集成简单的指标,形成了易于实现的量化交易策略。通过进一步的测试和优化,可以提高策略的稳定性和盈利能力。但是也需要警惕交易量放大风险,建议增加止损来控制风险。
||
Overview
This strategy combines the Stochastic RSI indicator and trading volume. It generates buy and sell signals when the Stochastic RSI indicator crosses over, and only trades when the volume is higher than the average volume of the past 7 days. The goal is to identify overbought and oversold conditions using the StochRSI indicator, and then filter false signals using volume, to find trading opportunities during strong trends.
Strategy Logic
Firstly, the 14-period RSI is calculated, and then the Stochastic indicator is applied on the RSI to generate the StochRSI K and D values. The StochRSI indicator signals overbought and oversold conditions.
Then, the difference between the K and D values are computed. When the difference is above 0, the indicator level is set to 1, and when below 0, it is set to -1. The indicator level determines the long/short state of the StochRSI.
Next, the average volume over the past 7 days is calculated. When the K value crosses above the D value (indicator level changes from negative to positive), and the close is higher than open, and volume is greater than average, it signals a buy. When K crosses below D (indicator level changes from positive to negative), and close is lower than open, and volume is greater than average, it signals a sell.
So in summary, the strategy combines the StochRSI indicator to identify overbought/oversold conditions, and volume to filter out false signals, to trade during strong trends.
Advantage Analysis
-
StochRSI identifies overbought/oversold levels for mean reversion trades. Volume avoids false signals during range-bound markets.
-
Volume condition filters out low volume false breakouts. Trading only during high volume trends improves profitability.
-
Combination of K/D crossovers and volume provides robust signals, avoiding false signals.
-
Simple and easy to understand logic, suitable for algo trading implementation.
Risk Analysis
-
StochRSI can lag K/D crossovers. Parameters need optimization for sensitivity.
-
Volume amplification may cause huge losses during market crashes. Need stop loss to control risk.
-
Over-reliance on StochRSI may cause issues with false breakouts. Needs more logic.
-
Volume filter may miss some trading opportunities. Can add analysis of ticks, tick power for optimization.
Optimization Directions
-
Optimize StochRSI parameters to find best K, D values for sensitivity.
-
Add moving average of volume to determine volume trends, avoiding false signals when volume drops.
-
Add other indicators like MACD, RSI for combo signals to improve accuracy.
-
Add stop loss based on ATR for dynamic stop loss management.
-
Analyze parallel and contrary volume to avoid excessive risk from parallel volume.
-
Use adaptive StochRSI parameters based on market regime.
Conclusion
This strategy primarily utilizes the StochRSI to determine overbought/oversold and the K/D crossovers for signals. It adds volume analysis to filter false signals and trade only during strong trends. The simple integration of indicators creates an easy to implement algo strategy. Further testing and optimization can improve robustness and profitability. However volume amplification risks need to be monitored and stop losses are recommended to control risk.
[/trans]
Strategy Arguments
| Argument | Default | Description |
|---|---|---|
| v_input_int_1 | 3 | K |
| v_input_int_2 | 3 | D |
| v_input_int_3 | 14 | RSI Length |
| v_input_int_4 | 14 | Stochastic Length |
Source (PineScript)
/*backtest
start: 2023-10-02 00:00:00
end: 2023-11-01 00:00:00
period: 2h
basePeriod: 15m
exchanges: [{"eid":"Futures_Binance","currency":"BTC_USDT"}]
*/

//@version=5
strategy("StochRSI Volume Strategy", overlay = true)

// StochRSI inputs
smoothK = input.int(3, title="K")
smoothD = input.int(3, title="D")
lengthRSI = input.int(14, "RSI Length")
lengthStoch = input.int(14, "Stochastic Length")

// Calculate StochRSI
rsiValue = ta.rsi(close, lengthRSI)
k = ta.sma(ta.stoch(rsiValue, rsiValue, rsiValue, lengthStoch), smoothK)
d = ta.sma(k, smoothD)

// Calculate difference between lines
lineDifference = k - d

// Calculate indicator level based on line positions
level = lineDifference >= 0 ? 1 : -1

// Calculate mean of last 7 volume bars
meanVolume = ta.sma(volume, 7)

// Determine buy and sell conditions
buyCondition = level > -1 and level[1] <= -1 and close > open and volume > meanVolume
sellCondition = level < 1 and level[1] >= 1 and close < open and volume > meanVolume

// Execute buy and sell signals
strategy.entry("Buy", strategy.long, when = buyCondition)
strategy.entry("Sell", strategy.short, when = sellCondition)

// Plot StochRSI levels
plot(level, title="Indicator Level", color=color.blue, linewidth=2)
Detail
https://www.fmz.com/strategy/430839
Last Modified
2023-11-02 14:12:13