
11 KiB
Name
基于RSI指标的趋势跟踪止损策略Scalping-Strategy-based-on-RSI-Indicator-with-Trailing-Stop-Loss
Author
ChaoZhang
Strategy Description
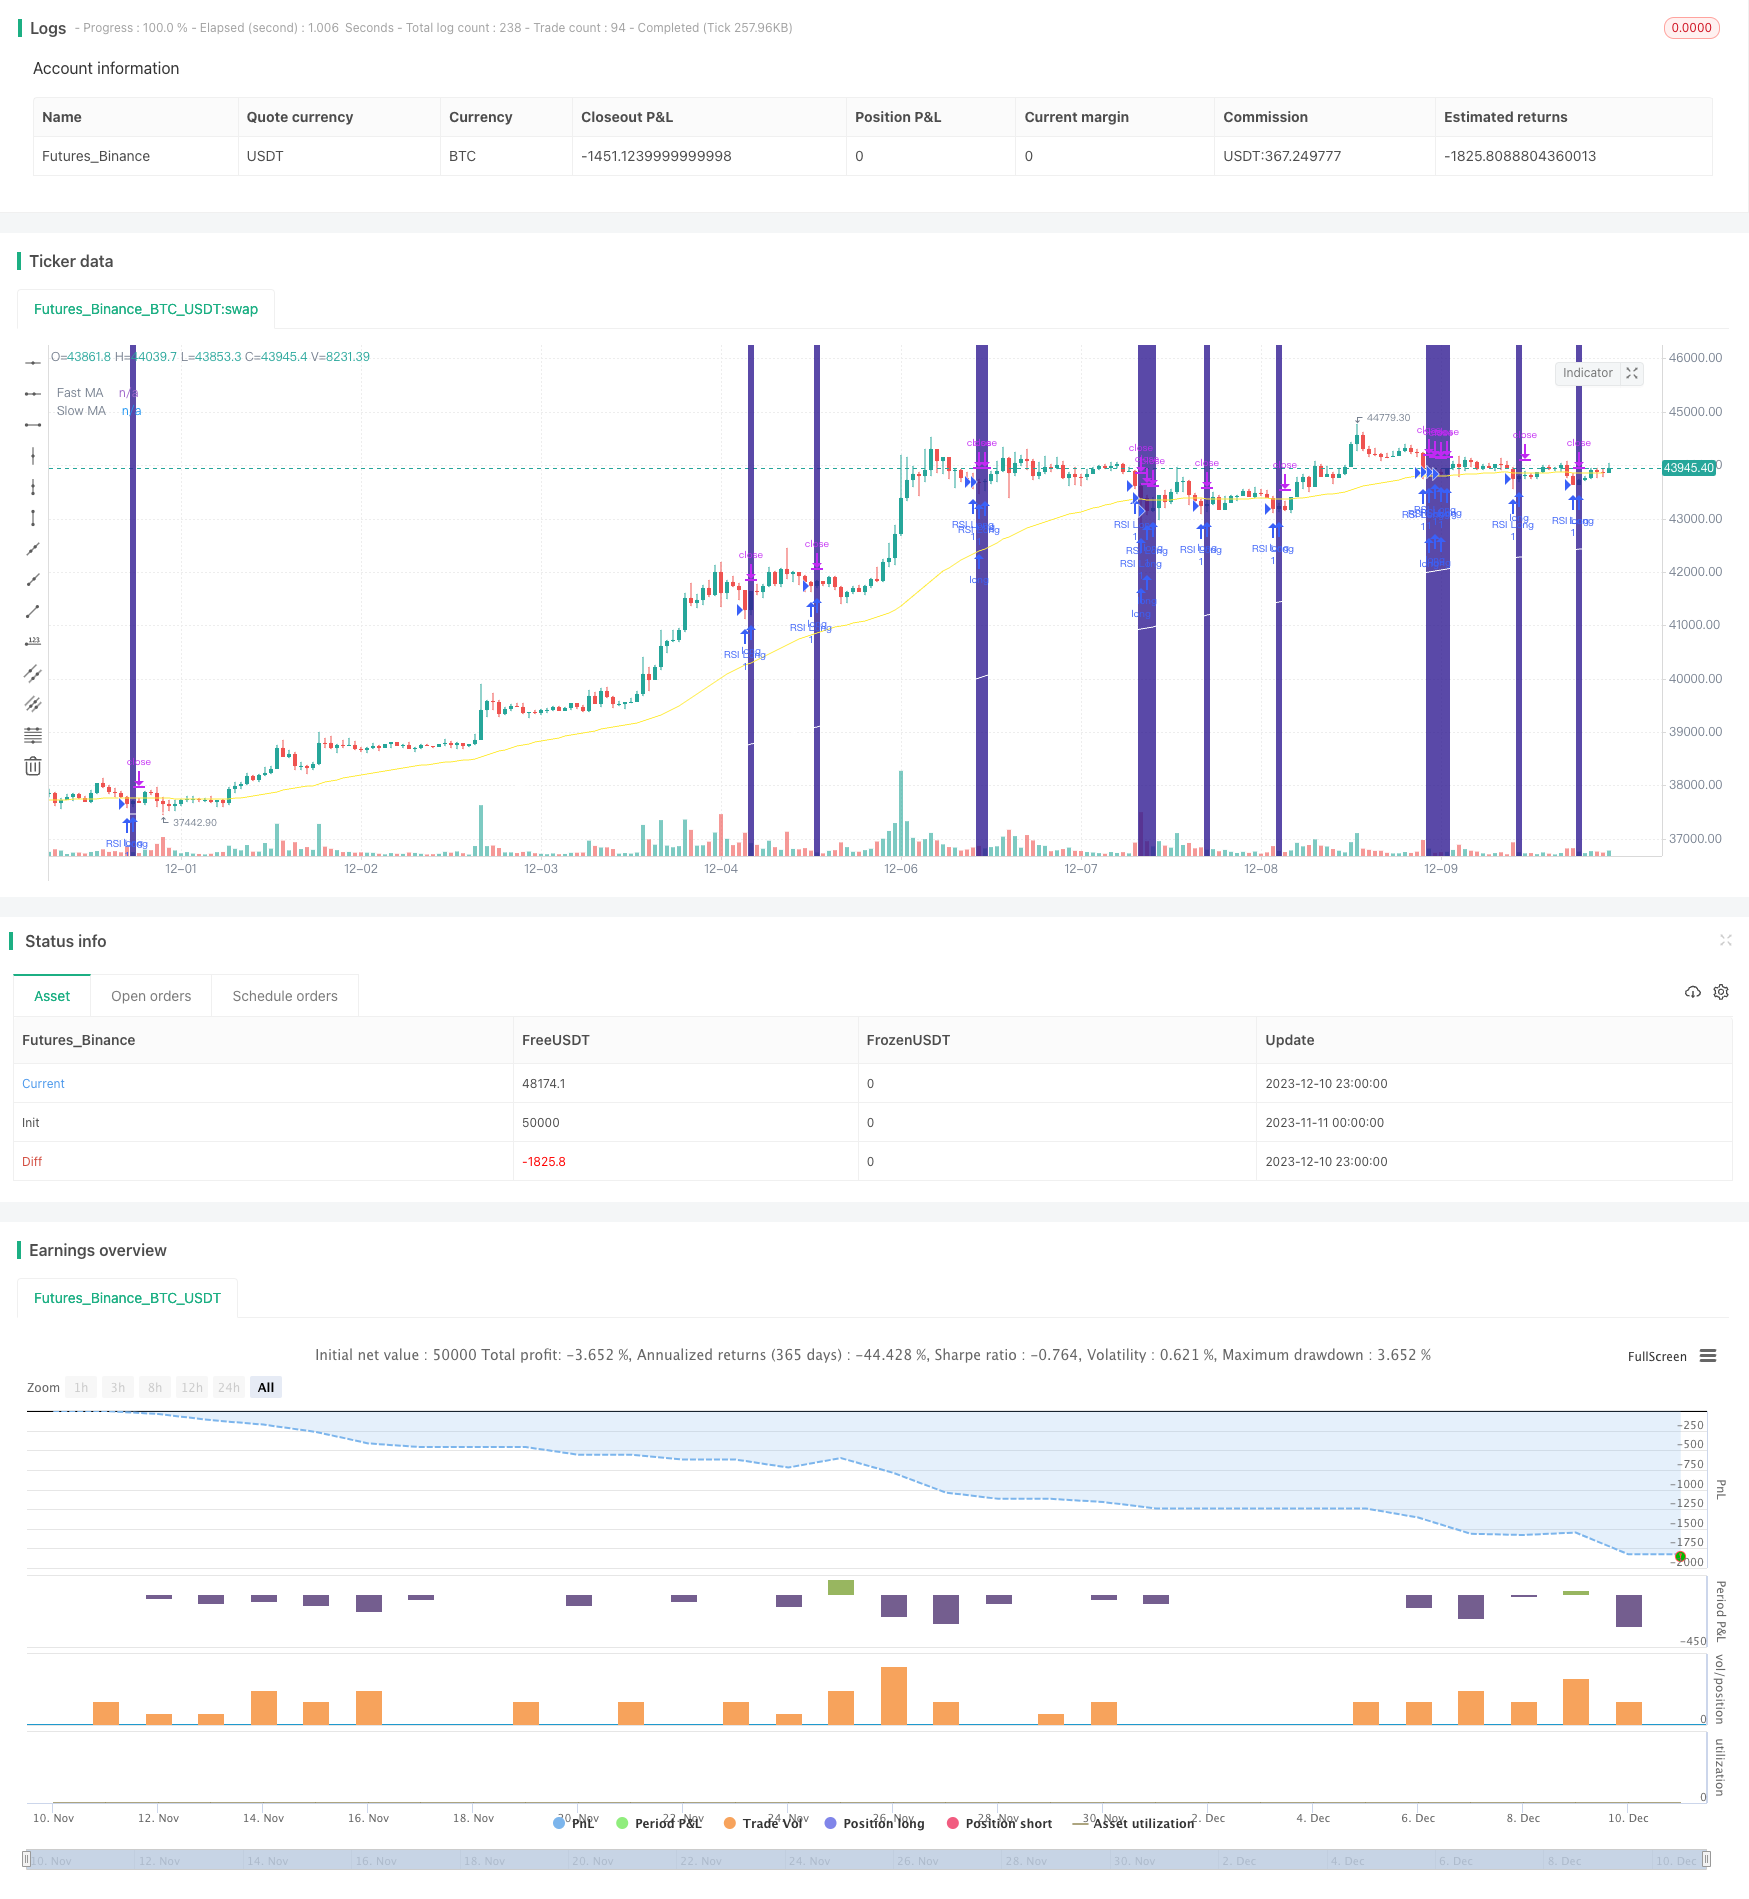 [trans]
概述
本策略名称为“基于RSI指标的趋势跟踪止损策略”。该策略利用RSI指标判断超买超卖情况,结合快慢MA指标判断趋势方向,设定入场条件。同时使用百分比跟踪止损机制,实现止损退出。
策略原理
该策略主要通过RSI指标和MA指标判断入场时机。RSI指标参数设置为2周期,判断超买超卖情况。快慢MA分别设置为50周期和200周期,判断趋势方向。具体入场逻辑为:
多头入场:快MA上穿慢MA,且价格高于慢MA,同时RSI低于超卖区域(默认10%)时做多;
空头入场:快MA下穿慢MA,且价格低于慢MA,同时RSI高于超买区域(默认90%)时做空。
此外,策略还设定了一个可选的波动率过滤器。该过滤器计算快慢MA的斜率差值,当差值超过设定阈值时才会开仓。其目的是避免价格震荡期无明确方向时开仓。
exit上,策略采用百分比跟踪止损方式。根据输入的止损百分比,结合每跳价差计算出止损价位,实现动态调整止损。
优势分析
该策略主要具有以下优势:
- RSI指标参数设置为2周期,能快速捕捉超买超卖情况,判断反转机会。
- 快慢MA能有效识别趋势方向和转折点。
- 结合RSI和MA双重指标判断,可避免假突破。
- 设置波动率过滤器,可过滤震荡市无明确方向时期。
- 采用百分比跟踪止损方式,可根据市场波动性调整止损幅度,有效控制风险。
风险分析
该策略也存在一定风险,主要体现在:
- RSI和MA指标存在一定滞后性,可能错过部分反转机会。
- 百分比止损在缩量下跌中容易被触发。
- 无法有效处理夜盘和盘前波动较大的品种。
针对上述风险,可从以下方面进行优化:
- 调整RSI参数,设置为1周期,可减少滞后性。
- 根据不同品种特点调整MA周期参数。
- 调整百分比止损水平,兼顾止损与震荡容忍度。
策略优化方向
该策略可从以下方面进行优化:
- 增加其他指标判断,如增加成交量指标,避免虚假突破。
- 增加机器学习模型判断,利用模型预测结果辅助决策。
- 优化复利次数和仓位管理,进一步提升策略收益率。
- 设定夜盘和盘前波动过滤机制。根据波动幅度设定是否参与下个交易日决策。
总结
本策略整体来说是一款较为稳定的趋势跟踪策略。它结合RSI和MA双重指标判断,在保证一定稳定性的同时,也能捕捉比较明确的趋势反转机会。同时设置波动率过滤器可避免部分风险,百分比止损方式也能有效控制单笔损失。该策略可作为多品种通用策略使用,也可针对特定品种进行参数调整和模型优化,从而获得更好的策略效果。
||
Overview
This strategy is named "Scalping Strategy based on RSI Indicator with Trailing Stop Loss". It utilizes the RSI indicator to determine overbought and oversold conditions, combines with fast and slow Moving Averages (MA) to determine the trend direction, and sets the entry conditions. It also uses percentage trailing stop loss mechanism to exit positions.
Strategy Logic
The entry signals of this strategy are mainly determined by the RSI indicator and MA crossovers. The RSI parameter is set to 2 periods to quickly capture overbought and oversold situations for reversal opportunities. The fast MA and slow MA are set to 50 and 200 periods respectively to identify the trend direction. Specifically, the entry logic is:
Long entry: Fast MA crosses above slow MA, price is above slow MA, and RSI is below oversold level (default 10%); Short entry: Fast MA crosses below slow MA, price is below slow MA, and RSI is above overbought level (default 90%).
In addition, there is an optional volatility filter in the strategy. It calculates the difference between the slopes of fast and slow MAs. Positions will only be opened when the difference exceeds a threshold. The purpose is to avoid opening positions when there is no clear direction during market fluctuation.
On the exit side, the strategy uses percentage trailing stop loss. Based on the input percentage, it calculates the stop loss price combined with the tick size, to dynamically adjust the stop loss.
Advantage Analysis
The main advantages of this strategy are:
- RSI set to 2 periods can quickly capture overbought and oversold situations for reversal opportunities.
- Fast and slow MAs can effectively identify trend direction and turning points.
- RSI and MA dual indicators combination avoids false breakouts.
- Volatility filter avoids opening positions when there is no clear direction during fluctuation.
- Percentage trailing stop loss can adjust stop loss level based on market volatility to effectively control risks.
Risk Analysis
There are also some risks in this strategy:
- RSI and MA indicators have some lagging effect, may miss some reversal opportunities.
- Percentage stop loss is likely to be triggered in low volume declines.
- Significant overnight and pre-market price swings are not handled effectively.
The optimization directions for the risks are:
- Adjust RSI parameter to 1 period to reduce lagging effect.
- Optimize MA periods based on symbol characteristics.
- Adjust percentage stop loss level to balance between stop loss and fluctuation tolerance.
Optimization Directions
The optimization directions for this strategy are:
- Add other indicators judgments, like volume, to avoid false breakout signals.
- Add machine learning model predictions to assist in decision making.
- Optimize pyramiding times and position sizing to further improve return.
- Set up filters for overnight and pre-market price swings. Determine whether to participate in next trading day based on fluctuation.
Conclusion
In general, this is a relatively stable trend following strategy. By combining dual RSI and MA indicators, it ensures certain stability while capturing clearer trend reversal opportunities. The volatility filter avoids some risks, and percentage stop loss also effectively controls single trade loss. This strategy can be used as a multi-symbol generic strategy, and can also be optimized on parameters and models for specific symbols to achieve better results.
[/trans]
Strategy Arguments
| Argument | Default | Description |
|---|---|---|
| v_input_1 | def_start_date | Start date |
| v_input_2 | def_end_date | End date |
| v_input_3_close | 0 | Source: close |
| v_input_4 | 2 | RSI Length |
| v_input_5 | 90 | Overbought threshold |
| v_input_6 | 10 | Oversold threshold |
| v_input_7 | 200 | Slow MA length |
| v_input_8 | 50 | Fast MA length |
| v_input_9 | 0 | MA choice: EMA |
| v_input_10 | 0.5 | Ticker size |
| v_input_11 | true | Trend Filter |
| v_input_12 | true | Trailing Stop % |
Source (PineScript)
/*backtest
start: 2023-11-11 00:00:00
end: 2023-12-11 00:00:00
period: 1h
basePeriod: 15m
exchanges: [{"eid":"Futures_Binance","currency":"BTC_USDT"}]
*/

// Scalping strategy
// © Lukescream and Ninorigo
// (original version by Lukescream - lastest versions by Ninorigo) - v1.3
//

//@version=4
strategy(title="Scalping using RSI 2 indicator", shorttitle="RSI 2 Strategy", overlay=true, pyramiding=0, process_orders_on_close=false)

var bool ConditionEntryL = false
var bool ConditionEntryS = false


//***********
// Costants
//***********
def_start_date = timestamp("01 Jan 2021 07:30 +0000")
def_end_date   = timestamp("01 Dec 2024 07:30 +0000")

def_rsi_length = 2
def_overbought_value = 90
def_oversold_value   = 10

def_slow_ma_length = 200
def_fast_ma_length = 50
def_ma_choice      = "EMA"

def_tick   = 0.5
def_filter = true

def_trailing_stop = 1


//***********
// Change the optional parameters
//***********
start_time  = input(title="Start date", defval=def_start_date, type=input.time)
end_time    = input(title="End date", defval=def_end_date, type=input.time)
// RSI
src         = input(title="Source", defval=close, type=input.source)
rsi_length  = input(title="RSI Length", defval=def_rsi_length, minval=1, type=input.integer)
overbought_threshold = input(title="Overbought threshold", defval=def_overbought_value, type=input.float)
oversold_threshold   = input(title="Oversold threshold", defval=def_oversold_value, type=input.float)
// Moving average
slow_ma_length = input(title="Slow MA length", defval=def_slow_ma_length, type=input.integer)
fast_ma_length = input(title="Fast MA length", defval=def_fast_ma_length, type=input.integer)
ma_choice = input(title="MA choice", defval="EMA", options=["SMA", "EMA"])
// Input ticker
tick   = input(title="Ticker size", defval=def_tick, type=input.float)
filter = input(title="Trend Filter", defval=def_filter, type=input.bool)
// Trailing stop (%)
ts_rate = input(title="Trailing Stop %", defval=def_trailing_stop, type=input.float)


//***********
// RSI
//***********
// Calculate RSI
up   = rma(max(change(src), 0), rsi_length)
down = rma(-min(change(src), 0), rsi_length)
rsi = (down == 0 ? 100 : (up == 0 ? 0 : 100-100/(1+up/down)))


//***********
// Moving averages
//***********
slow_ma = (ma_choice == "SMA" ? sma(close, slow_ma_length) : ema(close, slow_ma_length))
fast_ma = (ma_choice == "SMA" ? sma(close, fast_ma_length) : ema(close, fast_ma_length))
// Show the moving averages
plot(slow_ma, color=color.white,  title="Slow MA")
plot(fast_ma, color=color.yellow, title="Fast MA")


//***********
// Strategy
//***********
if true
    // Determine the entry conditions (only market entry and market exit conditions)
    // Long position
    ConditionEntryL := (filter == true ? (fast_ma > slow_ma and close > slow_ma and rsi < oversold_threshold) : (fast_ma > slow_ma and rsi < oversold_threshold))
    // Short position
    ConditionEntryS := (filter == true ? (fast_ma < slow_ma and close < slow_ma and rsi > overbought_threshold) : (fast_ma < slow_ma and rsi > overbought_threshold))

    // Calculate the trailing stop
    ts_calc = close * (1/tick) * ts_rate * 0.01

    // Submit the entry orders and the exit orders
    // Long position
    if ConditionEntryL
        strategy.entry("RSI Long", strategy.long)
    // Exit from a long position
    strategy.exit("Exit Long", "RSI Long", trail_points=0, trail_offset=ts_calc)

    // Short position
    if ConditionEntryS
        strategy.entry("RSI Short", strategy.short)
    // Exit from a short position
    strategy.exit("Exit Short", "RSI Short", trail_points=0, trail_offset=ts_calc)

// Highlights long conditions
bgcolor (ConditionEntryL ? color.navy : na, transp=60, offset=1, editable=true, title="Long position band")
// Highlights short conditions
bgcolor (ConditionEntryS ? color.olive : na, transp=60, offset=1, editable=true, title="Short position band")
Detail
https://www.fmz.com/strategy/435132
Last Modified
2023-12-12 15:46:49