
9.9 KiB
Name
基于RSI和MA均线的量化交易策略RSI-and-Moving-Average-Based-Quantitative-Trading-Strategy
Author
ChaoZhang
Strategy Description
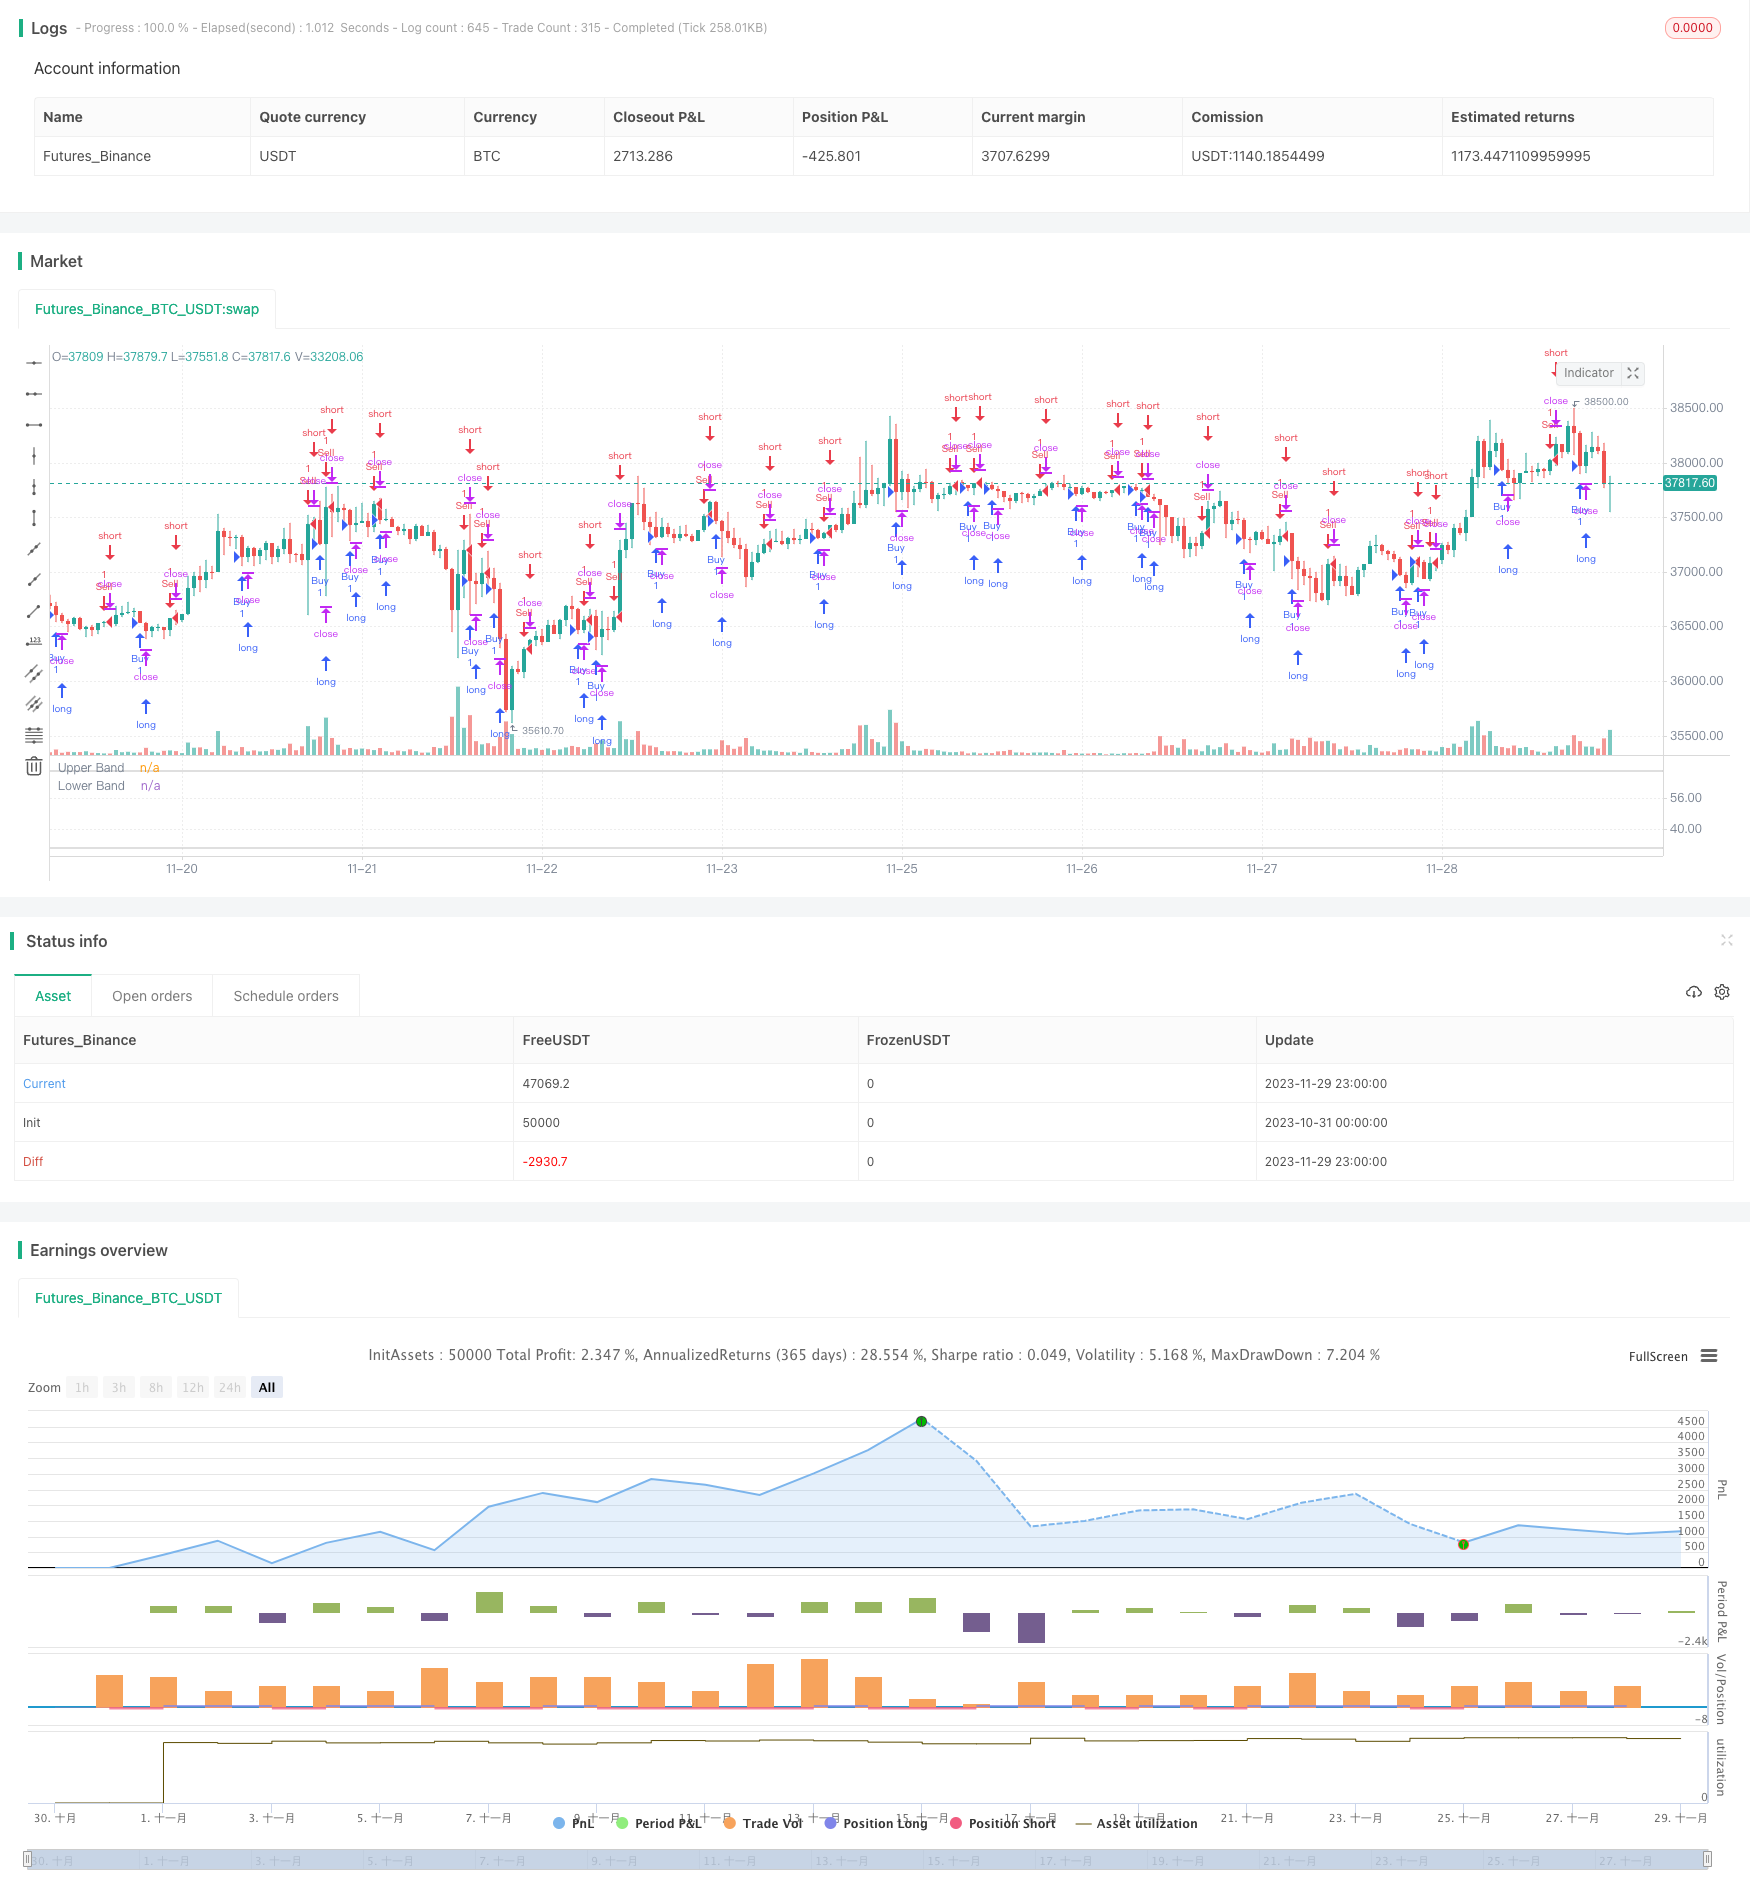 [trans]
概述
本策略名为“双均线策略”,其核心思想是同时利用相对强弱指标(RSI)和移动平均线(MA)这两个指标来产生交易信号。具体来说,当RSI线从上向下跨过MA线时生成买入信号;当RSI线从下向上跨过MA线时生成卖出信号。该策略相对简单,但通过结合两个不同类型的指标,可以有效减少假信号,提高信号的可靠性。
原理
双均线策略的基本逻辑是:
- 计算RSI值,以反映股票的超买超卖情况
- 计算MA值,以判断价格平均趋势
- 当RSI从高点下降,由超买区域进入超卖区域,并下穿MA时,产生买入信号
- 当RSI从低点上升,由超卖区域进入超买区域,并上穿MA时,产生卖出信号
以上交易信号发生时,我们会在图表上画出相关标记,方便视觉判断。这就是双均线策略的整体工作流程。
优势
双均线策略最大的优势在于能有效结合趋势指标和超买超卖指标,使交易信号更加可靠。具体来说,主要有以下几个方面的优势:
-
减少假信号。RSI和MA的结合使用,可以相互验证信号,避免单一指标产生的假信号。
-
提高胜率。相比单一RSI或MA策略,双均线策略可以获得更高的盈利机会。
-
适应性强。该策略仅用两个参数,操作简单,使用成本低,适合不同市场环境。
-
容易优化。通过调整RSI和MA的周期参数,可以方便优化,适应更多品种。
风险
尽管双均线策略有许多优点,但在实际应用中也不能完全避免风险。主要的风险包括:
-
MA采用了历史均价,可能滞后于最新价格变化。
-
RSI可能出现假突破的情况,产生错误信号。
-
无法适应快速变化的趋势市场,容易止损。
-
参数设置不当也会大幅影响策略表现。
对此,我们主要从以下几个方面进行风险控制:
-
采用自适应MA,根据最新价格变化调整周期参数。
-
增加止损机制,控制单笔亏损。
-
优化参数,选择最佳参数组合测试。
-
采用步进止损,锁定部分利润,降低风险。
优化方向
针对双均线策略可能存在的问题,我们考虑从以下几个维度进行优化:
-
利用自适应MA代替普通MA,可以更快捕捉价格变化趋势。
-
增加成交量指标的验证,避免假突破。例如收盘价与成交量齐齐上涨时才买入。
-
结合其他指标 filt过滤无效信号。例如MACD 或KD指标的 verifies 。
-
优化参数设置区间,寻找最优参数组合。可以通过回测寻找策略Highest 盈利的参数区间。
-
采用机器学习技术进行参数自适应优化。让策略能够根据实时市场状况选择最优参数。
通过以上几点优化,有望大幅提升双均线策略的实盘表现。
总结
双均线策略整合了RSI和MA两个指标的优点,通过二者配合,可以产生更加准确和可靠的交易信号。相比单一技术指标策略,双均线策略具有信号准确度高、假信号少、容易优化等优势。但也不能完全避免误操作风险,我们提出了一些具体的风险控制手段。此外,这一策略也存在可以继续优化的维度,若结合自适应指标、其他辅助验证指标、参数寻优等手段,有望进一步提高策略收益率。总体来说,本策略为量化交易提供了一个简洁实用的技术分析方案。
||
Overview
This strategy is called “Dual Moving Average Strategy”. The core idea is to generate trading signals by simultaneously using the Relative Strength Index (RSI) and Moving Average (MA) indicators. Specifically, a buy signal is generated when the RSI line crosses the MA line from top to bottom; A sell signal is generated when the RSI line crosses the MA line from bottom to top. This strategy is relatively simple, but by combining two different types of indicators, it can effectively reduce false signals and improve signal reliability.
Principle
The basic logic of the dual moving average strategy is:
- Calculate the RSI value to reflect the overbought and oversold situation of the stock
- Calculate the MA value to judge the average price trend
- When the RSI drops from the high point and enters the oversold area from the overbought area, and crosses below the MA, a buy signal is generated
- When the RSI rises from the low point, enters the overbought area from the oversold area, and crosses above the MA, a sell signal is generated.
When the above trading signals occur, we will draw relevant marks on the chart for easy visual judgment. This is the overall workflow of the dual moving average strategy.
Advantages
The biggest advantage of the dual moving average strategy is that it can effectively combine trend indicators and overbought/oversold indicators to make trading signals more reliable. Specifically, there are the following main advantages:
-
Reduce false signals. The combination of RSI and MA can verify signals with each other and avoid false signals generated by a single indicator.
-
Improve win rate. Compared with a single RSI or MA strategy, the dual moving average strategy can obtain more profitable opportunities.
-
Strong adaptability. This strategy uses only two parameters, simple to operate, low cost, and adapts to different market environments.
-
Easy to optimize. By adjusting the cycle parameters of RSI and MA, it is convenient to optimize and adapt to more varieties.
Risks
Despite the many advantages of the dual moving average strategy, risks cannot be completely avoided in actual application. The main risks include:
-
The MA uses historical average prices and may lag behind the latest price changes.
-
RSI may experience false breakouts, resulting in wrong signals.
-
Unable to adapt to rapidly changing trending markets, prone to stop loss.
-
Improper parameter settings can also greatly affect strategy performance.
In response, we mainly carry out risk control from the following aspects:
-
Use adaptive MA to adjust cycle parameters based on latest price changes.
-
Increase the stop loss mechanism to control single loss.
-
Optimize parameters to select the best parameter combination for testing.
-
Adopt step stop loss to lock in partial profits and reduce risks.
Optimization Directions
For potential issues with the dual moving average strategy, we consider optimization from the following dimensions:
-
Use adaptive MA instead of ordinary MA to capture price trend changes faster.
-
Increase volume indicator verification to avoid false breakouts. For example, only buy when the closing price and trading volume rise together.
-
Combine other indicators for filtering invalid signals. For example verifies of MACD or KD indicators.
-
Optimize parameter setting range to find the optimal parameter combination. Backtesting can find the highest profit parameter range for the strategy.
-
Use machine learning techniques for adaptive parameter optimization. Allow strategies to select optimal parameters based on real-time market conditions.
Through the above optimizations, it is expected to greatly improve the live performance of the dual moving average strategy.
Summary
The dual moving average strategy integrates the advantages of RSI and MA indicators. Through the cooperation of the two, more accurate and reliable trading signals can be generated. Compared with single technical indicator strategies, dual moving average strategies have higher signal accuracy, fewer false signals, easy optimization and other advantages. But the risk of misoperation cannot be completely avoided. We have also proposed some specific risk control measures. In addition, there are dimensions that can be further optimized for this strategy. By combining adaptive indicators, other auxiliary verification indicators, parameter optimization and other means, it is expected to further improve the strategy's rate of return. In general, this strategy provides a simple and practical technical analysis solution for quantitative trading.
[/trans]
Strategy Arguments
| Argument | Default | Description |
|---|---|---|
| v_input_1 | false | Use Reverse Trade? |
| v_input_2 | 14 | RSI Length |
| v_input_3_close | 0 | RSI Source: close |
| v_input_4 | true | Show MA |
| v_input_5 | 9 | MA Length |
| v_input_6 | false | MA Offset |
Source (PineScript)
/*backtest
start: 2023-10-31 00:00:00
end: 2023-11-30 00:00:00
period: 1h
basePeriod: 15m
exchanges: [{"eid":"Futures_Binance","currency":"BTC_USDT"}]
*/

//@version=4
strategy(title="RSI + MA", shorttitle="RSI + MA")
reverseTrade = input(false, title = "Use Reverse Trade?")
lengthRSI = input(14, minval=1, title="RSI Length")
sourceRSI = input(close, "RSI Source", type = input.source)

showMA = input(true, title="Show MA")
lengthMA = input(9, minval=1, title="MA Length")
offsetMA = input(title="MA Offset", type=input.integer, defval=0, minval=-500, maxval=500)

up = rma(max(change(sourceRSI), 0), lengthRSI)
down = rma(-min(change(sourceRSI), 0), lengthRSI)

rsi = down == 0 ? 100 : up == 0 ? 0 : 100 - (100 / (1 + up / down))
ma = sma(rsi, lengthMA)

plot(showMA ? ma : na, "MA", color=color.blue, linewidth=2, style=0, offset=offsetMA)
plot(rsi, "RSI", color=#9915FF, linewidth=1, style=0)

band1 = hline(70, "Upper Band", color=#C0C0C0, linestyle=2, linewidth=1)
band0 = hline(30, "Lower Band", color=#C0C0C0, linestyle=2, linewidth=1)
fill(band1, band0, color=color.new(#9915FF,95), title="Background")

buy = reverseTrade ? rsi[1] < ma[1] and rsi > ma : rsi[1] > ma[1] and rsi < ma
sell = reverseTrade ? rsi[1] > ma[1] and rsi < ma : rsi[1] < ma[1] and rsi > ma

strategy.entry("Buy", true, when = buy)
strategy.entry("Sell", false, when = sell)
Detail
https://www.fmz.com/strategy/433914
Last Modified
2023-12-01 14:21:18