
7.3 KiB
Name
基于HULL-SMA和EMA交叉的趋势策略Trend-Strategy-Based-on-HULL-SMA-and-EMA-Crossover
Author
ChaoZhang
Strategy Description
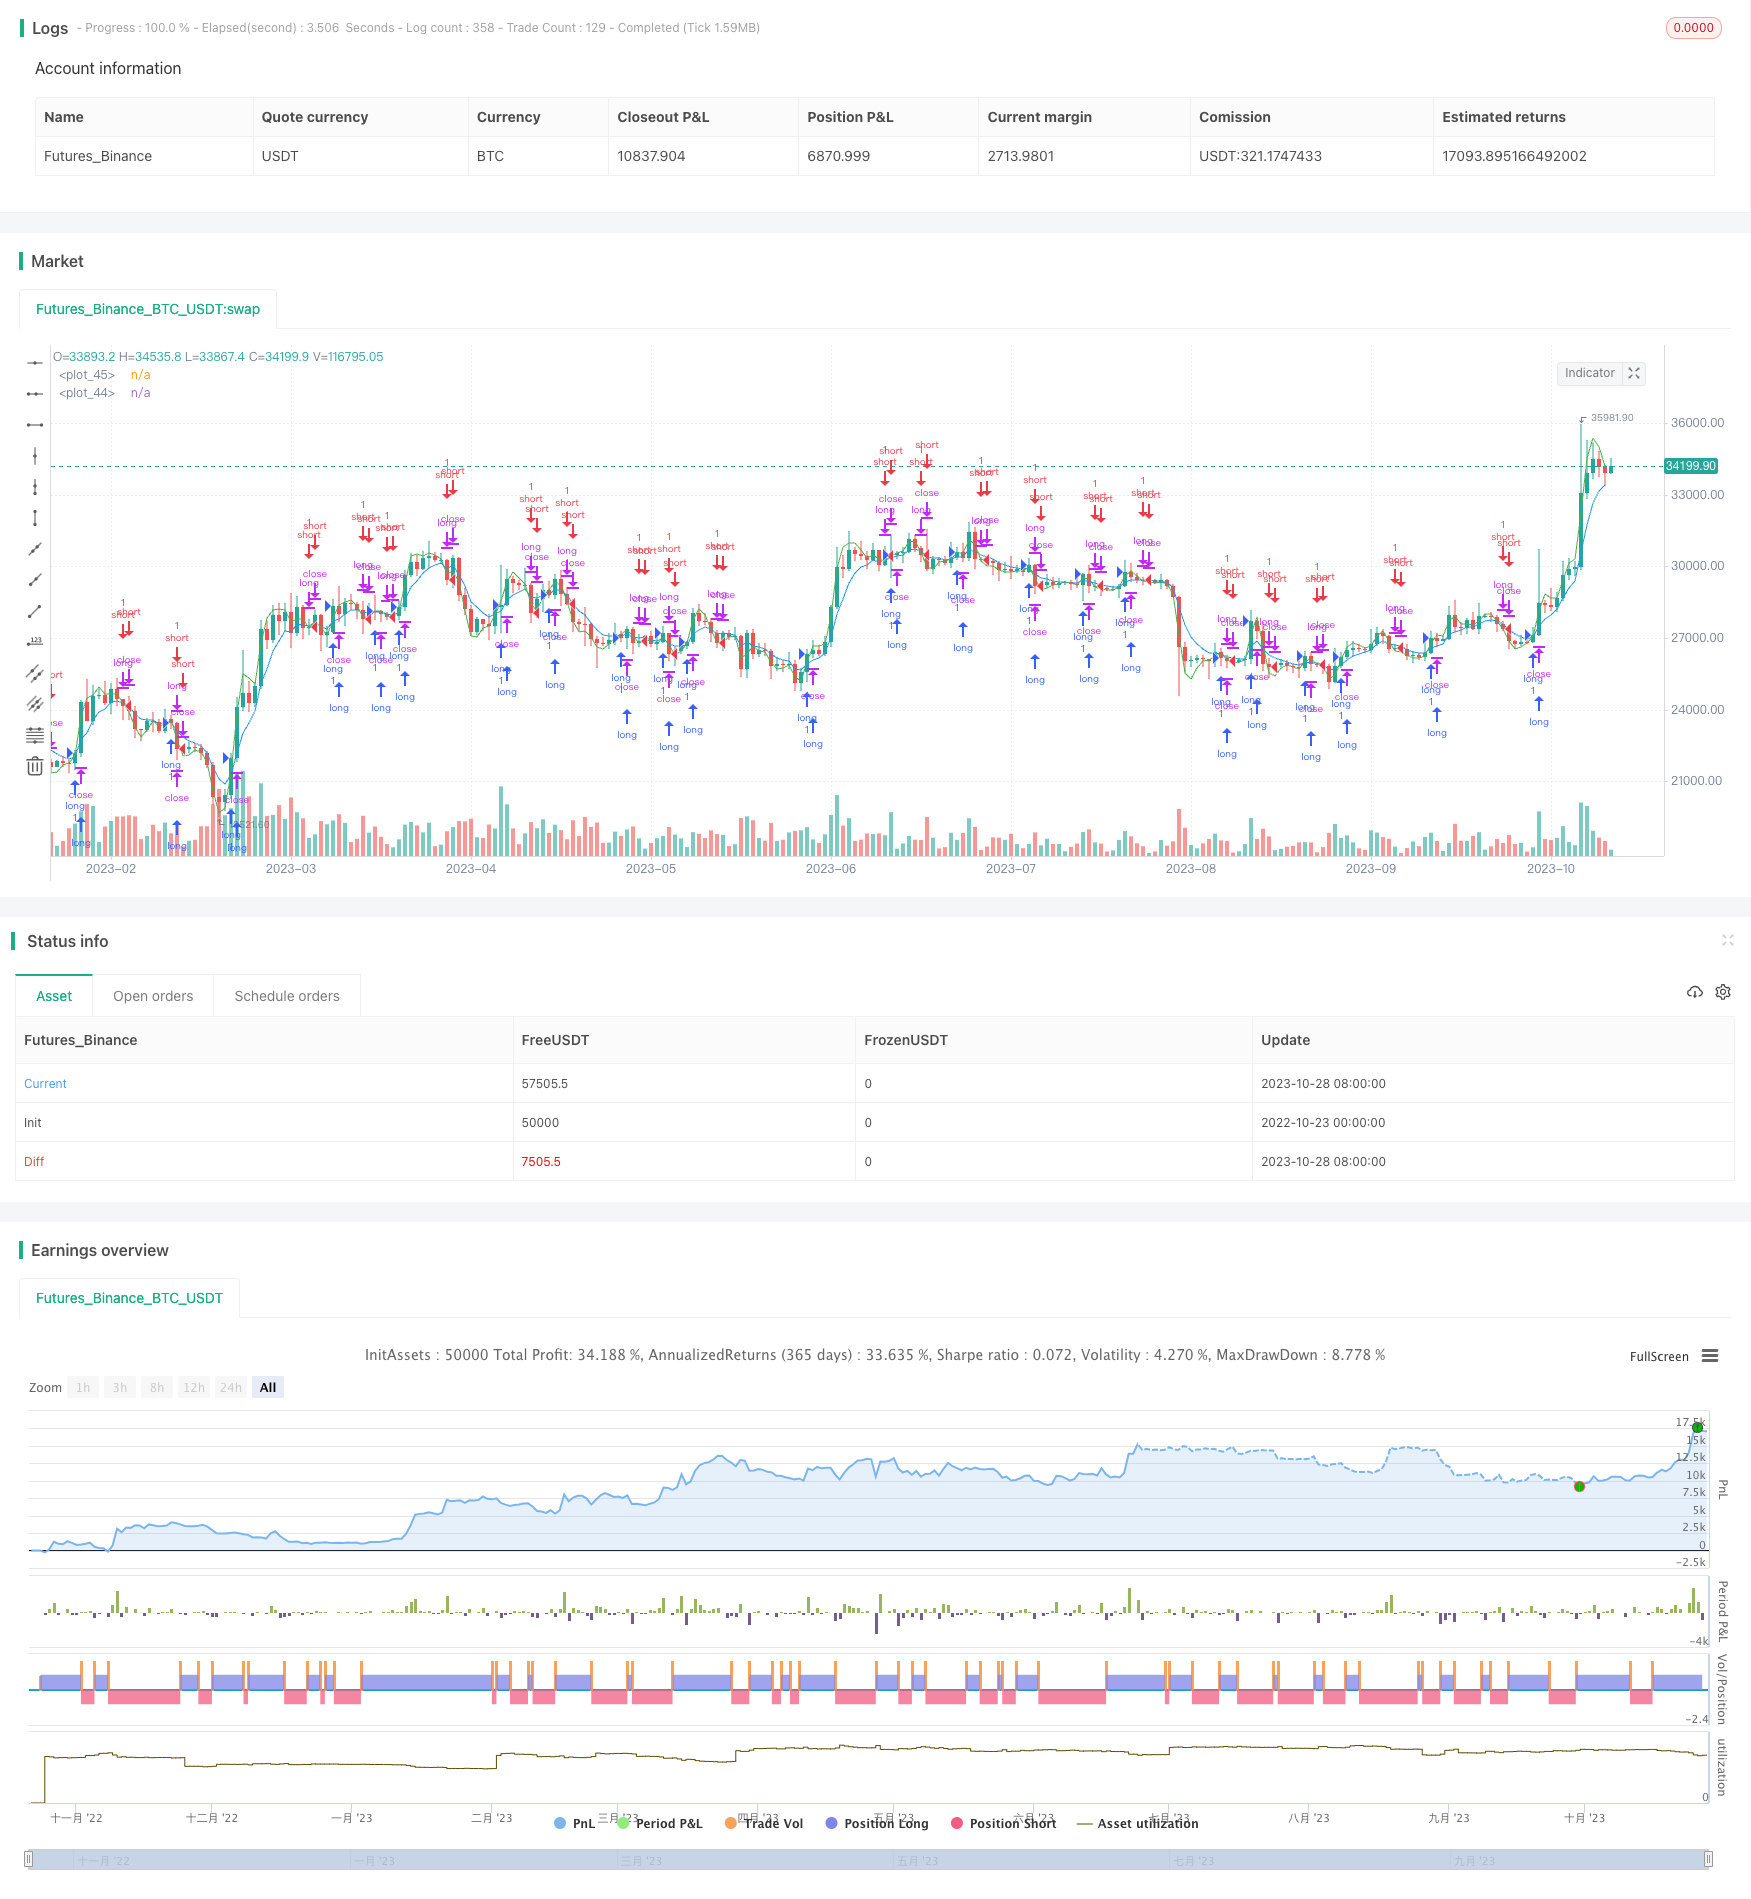
[trans]
概述
该策略通过计算HULL平滑移动平均线和指数移动平均线的交叉情况,判断市场趋势方向,产生买入和卖出信号。属于中短期趋势跟踪策略。
策略原理
-
计算5日HULL平滑移动平均线(HULL SMA)。HULL SMA通过加权移动平均和周期的平方根计算,能更快地响应价格变化。
-
计算5日指数移动平均线(EMA)。EMA通过给予近期价格更大权重的方式计算平均线,相比SMA更为灵敏。
-
判断HULL SMA和EMA的交叉情况,产生买入和卖出信号。
-
当HULL SMA上穿EMA时,产生买入信号。表示短期趋势向上突破长期趋势,预示着价格将上涨。
-
当HULL SMA下穿EMA时,产生卖出信号。表明短期趋势开始转向,价格将下跌。
- 以HULL SMA为快线,EMA为慢线,根据两条移动平均线的交叉形态判断市场短期和中期趋势的变化,产生交易信号。
优势分析
-
HULL SMA对价格变化敏感,可以更早发现趋势的变化。
-
EMA具有平滑 noise 的能力,跟踪长期趋势。
-
快线突破慢线产生信号,可以抓住趋势的转折点,及时进入市场。
-
通过调整移动平均线参数,可以适应不同周期的交易。
-
可同时判断上涨和下跌趋势,灵活捕捉双向行情。
风险分析
-
在震荡行情中可能产生较多错误信号。
-
无法判断趋势的强弱,可能在弱势趋势中重复亏损。
-
移动平均线间隙过大,可能错过部分行情。
-
快线和慢线参数设置不当,会影响交易信号质量。
-
交易频率可能过高,增加交易成本和滑点风险。
可通过结合其他指标过滤信号、评估趋势强弱、优化参数设置、控制风险等方式改进。
优化方向
-
增加指标过滤,如MACD、RSI等判断买卖时机。
-
加入趋势力度指标,如ADX,避免在弱势趋势中交易。
-
优化移动平均线参数,寻找最佳参数组合。
-
设定止损策略,控制单笔亏损。
-
考虑交易次数和成本控制,调整开仓频率。
-
结合更多时间周期分析,识别跨周期趋势信号。
-
开发自动参数优化程序,动态寻找最优参数。
总结
该策略通过快线HULL SMA和慢线EMA的交叉来判断市场趋势,属于典型的移动平均线交叉策略。相比传统移动平均线,该策略使用了更灵敏的HULL SMA,可以更早发现趋势变化。但仍需优化参数设定,并辅以其他技术指标来减少错误信号。若搭配完善的风险和资金管理,该策略可以成为效率较高的中短期趋势跟踪策略。
||
Overview
This strategy generates buy and sell signals by calculating the crossover between the HULL Smoothed Moving Average line and the Exponential Moving Average line to determine market trend direction. It belongs to the category of medium-term trend-following strategies.
Strategy Logic
-
Calculate the 5-period HULL Smoothed Moving Average (HULL SMA). HULL SMA responds faster to price changes by using weighted moving averages and the square root of the period.
-
Calculate the 5-period Exponential Moving Average (EMA). EMA gives more weight to recent prices and is more sensitive than SMA in tracking the trend.
-
Generate buy and sell signals based on the crossover between HULL SMA and EMA.
-
When HULL SMA crosses above EMA, a buy signal is generated, indicating the short-term trend breaks out above the long-term trend, suggesting an upward price movement.
-
When HULL SMA crosses below EMA, a sell signal is generated, indicating the short-term trend turning down, suggesting a downward price movement.
- Use HULL SMA as the fast line and EMA as the slow line to determine changes in short-term and medium-term trends based on the crossover, generating trading signals.
Advantage Analysis
-
HULL SMA is sensitive to price changes and can detect trend changes earlier.
-
EMA smoothes market noise and tracks long-term trends.
-
Crossover signals catch trend turning points in a timely manner.
-
Parameters can be adjusted for different trading timeframes.
-
Captures upside and downside trends flexibly.
Risk Analysis
-
More false signals may occur during range-bound markets.
-
Unable to determine trend strength, may lead to repeated losses in weak trends.
-
Price movements between the averaging intervals may be missed.
-
Improper parameter settings affect signal quality.
-
High trading frequency increases costs and slippage risks.
Improvements can be made via signal filtering, evaluating trend strength, parameter optimization, risk management, etc.
Optimization Directions
-
Add indicators like MACD, RSI for signal confirmation.
-
Incorporate trend strength indicators like ADX to avoid trading weak trends.
-
Optimize moving average parameters for best combinations.
-
Implement stop loss to control single trade loss.
-
Manage trade frequency and costs.
-
Incorporate multi-timeframe analysis to identify cross-cycle trends.
-
Develop auto parameter optimization programs.
Summary
This strategy judges the trend based on the crossover between the fast HULL SMA and slow EMA. It is a typical moving average crossover system. Compared to traditional moving averages, the more responsive HULL SMA provides earlier trend change detection. But parameters and supplemental indicators should be optimized to reduce false signals. With proper risk and money management, this strategy can be an efficient medium-term trend following system.
[/trans]
Strategy Arguments
| Argument | Default | Description |
|---|---|---|
| v_input_int_1 | 5 | Hull EMA Value |
| v_input_1 | 5 | EMA Value |
Source (PineScript)
/*backtest
start: 2022-10-23 00:00:00
end: 2023-10-29 00:00:00
period: 1d
basePeriod: 1h
exchanges: [{"eid":"Futures_Binance","currency":"BTC_USDT"}]
*/

//@version=5
strategy("HULL EMA Crossover", overlay = true, process_orders_on_close = true)

// This source code is subject to the terms of the Mozilla Public License 2.0 at https://mozilla.org/MPL/2.0/
// © spiritedPerson95700

inSession = true


HULL_INP = input.int(5, "Hull EMA Value")
EMA_INP = input(5, "EMA Value")

/// Indicator
HULL_EMA = ta.hma(close, HULL_INP)
EMA = ta.ema(close, EMA_INP)

prevSignal = ''
if (prevSignal == '')
    prevSignal := HULL_EMA > EMA ? 'buy' : 'sell'

/// buy and sell signal
buy = ta.crossover(HULL_EMA, EMA)
short = ta.crossover(EMA, HULL_EMA)

sell = short
cover = buy

if inSession
    if buy
        prevSignal := 'na'
        strategy.entry("long", direction = strategy.long, comment = "Buy")

    if sell
        prevSignal := 'na'
        strategy.close("long", comment = "Sell")

    if short
        strategy.entry("short", direction = strategy.short, comment = "Short")

    if cover
        strategy.close("short", comment = "Cover")


plot(HULL_EMA, color = color.green)
plot(EMA, color = color.blue)

// if ( hour(time) == 15 and minute(time) > 25  )
//     strategy.close("long", comment="EOD")
//     strategy.close("short", comment="EOD")
//     buy := false
//     sell := false
//     prevSignal := ''
Detail
https://www.fmz.com/strategy/430563
Last Modified
2023-10-30 14:36:25