
9.0 KiB
Name
基于ATR的均值回复策略Mean-Reversion-Strategy-Based-on-ATR
Author
ChaoZhang
Strategy Description
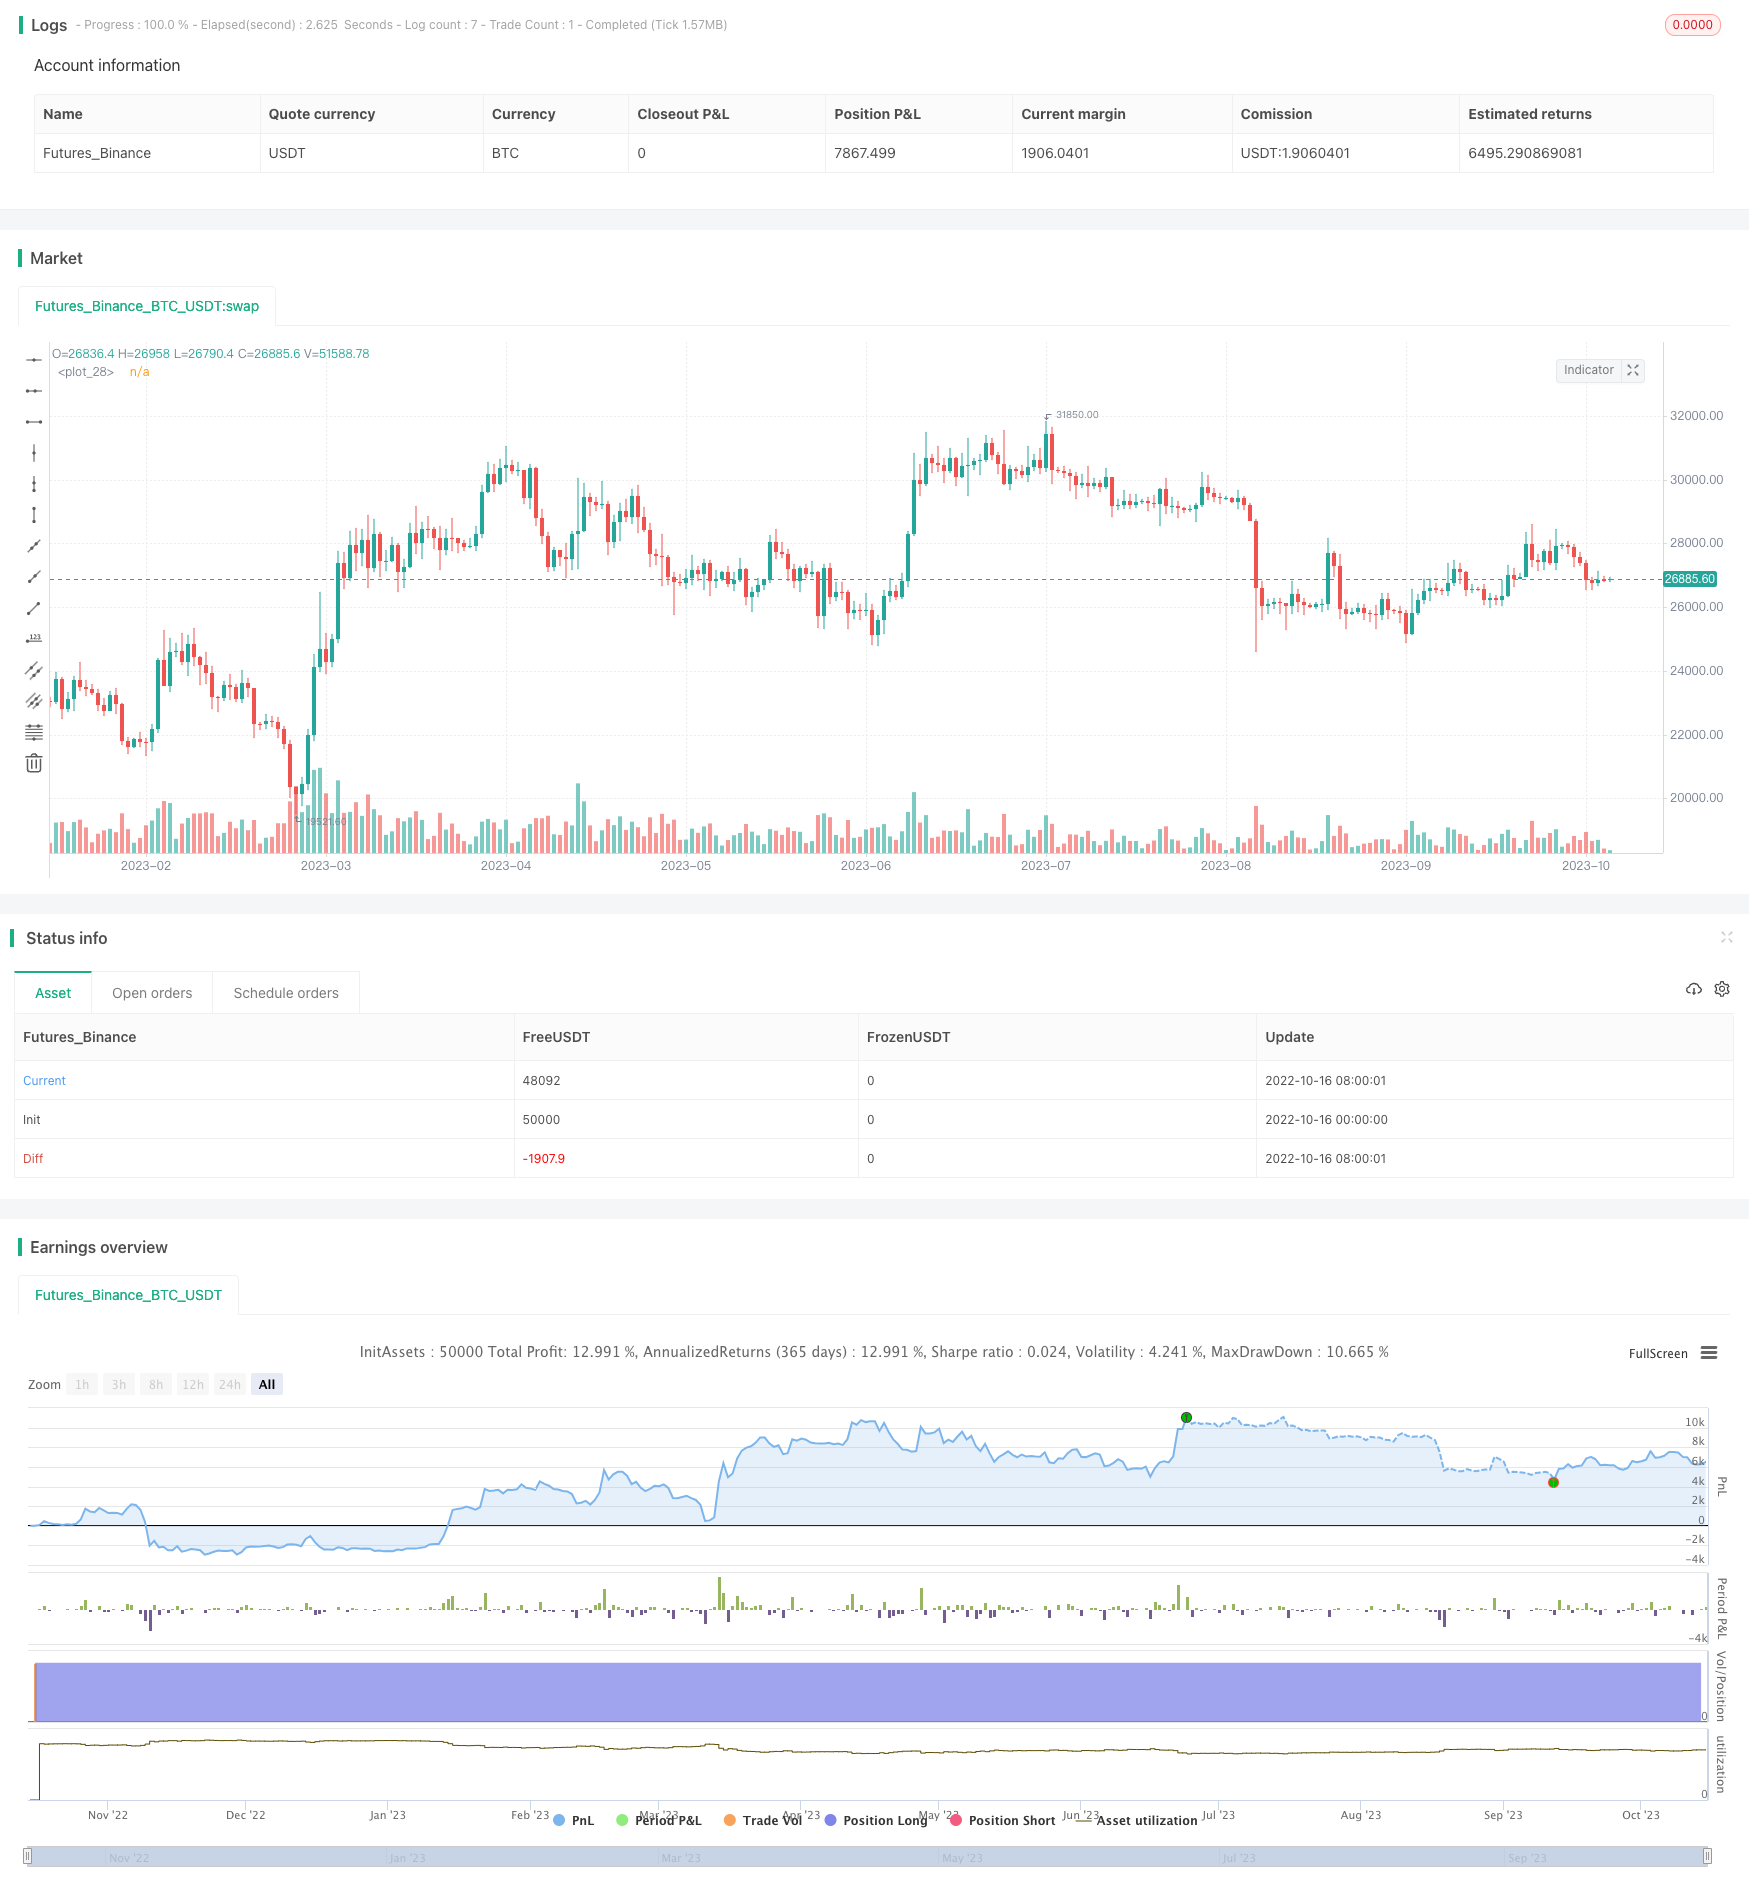
[trans]
概述
本策略运用假设检验的方法判断ATR是否偏离均值,结合对价格走势的预测,实现了一个基于ATR的均值回复交易策略。当ATR出现显著偏离时,表明市场可能存在反常波动。此时,如果价格走势预测为看涨,则可以建立做多头寸。
策略原理
-
假设检验
-
快速ATR周期(参数atr_fast)与慢速ATR周期(参数atr_slow)进行两样本t检验。假设检验的零假设H0为两样本均值无显著差异。
-
如果检验统计量高于阈值(参数reliability_factor指定的置信区间),则拒绝原假设,即认为快速ATR已明显偏离慢速ATR。
-
-
价格走势预测
-
计算对数收益率的移动平均作为预期漂移率(参数drift)。
-
如果漂移率上升,则判断目前为看涨趋势。
-
-
入场及止损退出
-
当快慢ATR差异显著且趋势看涨时,做多入场。
-
随后利用ATR计算持续调整止损线。当价格跌破止损线时止损退出。
-
优势分析
-
利用假设检验判断ATR异常偏离更科学、参数自适应。
-
结合价格趋势预测,避免了仅凭ATR偏离做出错误交易。
-
持续调整止损,降低亏损风险。
风险分析
-
价格出现断崖式下跌时,无法止损。
-
趋势判断存在错误,可能买入最高点。
-
参数设置不当,将错过正确的交易时点或者增加不必要的交易。
优化建议
-
可考虑加入其它指标进行多因子确认,避免单一指标造成错误交易。
-
可以测试不同的ATR参数组合,找到更稳定的参数。
-
增加对突破关键价格关口的判断,避免买入假突破。
总结
本策略总体思路清晰,利用假设检验判断反常波动的思路可取。但ATR偏离并不能完全判断趋势,需增加判断依据提高准确性。止损规则可靠,但无法应对断崖式下跌。未来可从入场条件、参数选择、止损优化等方面进行改进。
||
Overview
This strategy uses hypothesis testing to determine if ATR deviates from its mean value. Combined with prediction of price trend, it implements a mean reversion strategy based on ATR. Significant deviation of ATR indicates potential abnormal volatility in the market. If the price trend is predicted to be bullish, a long position can be established.
Strategy Logic
-
Hypothesis Testing
-
Conduct two-sample t-test between fast ATR period (atr_fast) and slow ATR period (atr_slow). Null hypothesis H0 is that there is no significant difference between the two sample means.
-
If test statistic exceeds threshold (confidence interval specified by reliability_factor), reject null hypothesis, i.e. fast ATR is considered to deviate significantly from slow ATR.
-
-
Price Trend Prediction
-
Moving average of logarithmic returns is calculated as expected drift rate (drift).
-
If drift is increasing, current trend is judged as bullish.
-
-
Entry and Stop Loss Exit
-
Go long when fast and slow ATR differs significantly and trend is bullish.
-
Continuously adjust stop loss using ATR. Exit position when price breaks below stop loss.
-
Advantage Analysis
-
Using hypothesis testing to determine ATR deviation is more scientific and adaptive.
-
Combining with price trend prediction avoids wrong trades based solely on ATR deviation.
-
Adjusting stop loss continually manages downside risk.
Risk Analysis
-
Unable to stop loss when price crashes.
-
Incorrect trend prediction may result in buying at the top.
-
Improper parameter settings may miss correct entry or add unnecessary trades.
Optimization Suggestions
-
Consider adding other indicators for multifactor confirmation to avoid mistakes.
-
Test different ATR parameter combinations to find more stable values.
-
Add criteria on breakthrough of key price levels to avoid false breakout.
Conclusion
The overall logic of this strategy is clear. Using hypothesis testing to detect abnormal volatility is reasonable. However, ATR deviation alone is insufficient to determine trend. More confirming factors are needed to improve accuracy. The stop loss rules are reliable but ineffective against cliff-style crashes. Future improvements can be made in areas like entry criteria, parameter selection, stop loss optimization.
[/trans]
Strategy Arguments
| Argument | Default | Description |
|---|---|---|
| v_input_1 | timestamp(01 Apr 2000 13:30 +0000) | Backtest Start Time |
| v_input_2 | 14 | (?Stop loss)Length of ATR for trailing stop loss |
| v_input_3 | 2 | ATR Multiplier for trailing stop loss |
| v_input_4 | 14 | (?Hypothesis testing)Length of ATR (fast) for diversion test |
| v_input_5 | 28 | Length of ATR (slow) for diversion test |
| v_input_float_1 | 1.645 | Reliability factor |
| v_input_6 | 14 | (?Trend prediction)Length of drift |
Source (PineScript)
/*backtest
start: 2022-10-16 00:00:00
end: 2023-10-16 00:00:00
period: 1d
basePeriod: 1h
exchanges: [{"eid":"Futures_Binance","currency":"BTC_USDT"}]
*/

// This source code is subject to the terms of the Mozilla Public License 2.0 at https://mozilla.org/MPL/2.0/
// © DojiEmoji

//@version=5
strategy("Mean Reversion (ATR) Strategy v2 [KL] ", overlay=true, pyramiding=1)
var string ENUM_LONG = "Long"
var string GROUP_TEST = "Hypothesis testing"
var string GROUP_TSL = "Stop loss"
var string GROUP_TREND = "Trend prediction"

backtest_timeframe_start = input(defval=timestamp("01 Apr 2000 13:30 +0000"), title="Backtest Start Time")
within_timeframe = true

// TSL: calculate the stop loss price. {
ATR_TSL      = ta.atr(input(14, title="Length of ATR for trailing stop loss", group=GROUP_TSL)) * input(2.0, title="ATR Multiplier for trailing stop loss", group=GROUP_TSL)
TSL_source      = low
TSL_line_color  = color.green
TSL_transp      = 100
var stop_loss_price = float(0)

if strategy.position_size == 0 or not within_timeframe
    TSL_line_color := color.black
    stop_loss_price := TSL_source - ATR_TSL
else if strategy.position_size > 0
    stop_loss_price := math.max(stop_loss_price, TSL_source - ATR_TSL)
    TSL_transp := 0

plot(stop_loss_price, color=color.new(TSL_line_color, TSL_transp))
// } end of "TSL" block

// Entry variables {
// ATR diversion test via Hypothesis testing (2-tailed):
//     H0 : atr_fast equals atr_slow
//     Ha : reject H0 if z_stat is above critical value, say reliability factor of 1.96 for a 95% confidence interval
len_fast    = input(14,title="Length of ATR (fast) for diversion test", group=GROUP_TEST)
atr_fast    = ta.atr(len_fast)
std_error   = ta.stdev(ta.tr, len_fast) / math.pow(len_fast, 0.5) // Standard Error (SE) = std / sq root(sample size)

atr_slow = ta.atr(input(28,title="Length of ATR (slow) for diversion test", group=GROUP_TEST))
test_stat = (atr_fast - atr_slow) / std_error
reject_H0 = math.abs(test_stat) > input.float(1.645,title="Reliability factor", tooltip="Strategy uses 2-tailed test; Confidence Interval = Point Estimate (avg ATR) +/- Reliability Factor x Standard Error; i.e use 1.645 for a 90% confidence interval", group=GROUP_TEST)

// main entry signal, subject to confirmation(s), gets passed onto the next bar
var _signal_diverted_ATR = false
if not _signal_diverted_ATR
    _signal_diverted_ATR := reject_H0


// confirmation: trend prediction; based on expected lognormal returns
_prcntge_chng = math.log(close / close[1])

// Expected return (drift) = average percentage change + half variance over the lookback period
len_drift = input(14, title="Length of drift", group=GROUP_TREND)
_drift = ta.sma(_prcntge_chng, len_drift) - math.pow(ta.stdev(_prcntge_chng, len_drift), 2) * 0.5
_signal_uptrend = _drift > _drift[1]

entry_signal_all = _signal_diverted_ATR and _signal_uptrend // main signal + confirmations
// } end of "Entry variables" block

// MAIN {
// Update the stop limit if strategy holds a position
if strategy.position_size > 0 and ta.change(stop_loss_price)
    strategy.exit(ENUM_LONG, comment="sl", stop=stop_loss_price)

// Entry
if within_timeframe and entry_signal_all
    strategy.entry(ENUM_LONG, strategy.long, comment=strategy.position_size > 0 ? "adding" : "initial")

// Alerts
_atr = ta.atr(14)
alert_helper(msg) =>
    prefix = "[" + syminfo.root + "] "
    suffix = "(P=" + str.tostring(close, "#.##") + "; atr=" + str.tostring(_atr, "#.##") + ")"
    alert(str.tostring(prefix) + str.tostring(msg) + str.tostring(suffix), alert.freq_once_per_bar)

if strategy.position_size > 0 and ta.change(strategy.position_size)
    if strategy.position_size > strategy.position_size[1]
        alert_helper("BUY")
    else if strategy.position_size < strategy.position_size[1]
        alert_helper("SELL")

// Clean up - set the variables back to default values once no longer in use
if strategy.position_size == 0
    stop_loss_price := float(0)
if ta.change(strategy.position_size)
    _signal_diverted_ATR := false
// } end of MAIN block
Detail
https://www.fmz.com/strategy/429496
Last Modified
2023-10-17 16:27:44