
12 KiB
Name
基于ATR指标的自适应跟踪止损策略ATR-Trailing-Stop-Bands-Strategy
Author
ChaoZhang
Strategy Description
[trans]
概述
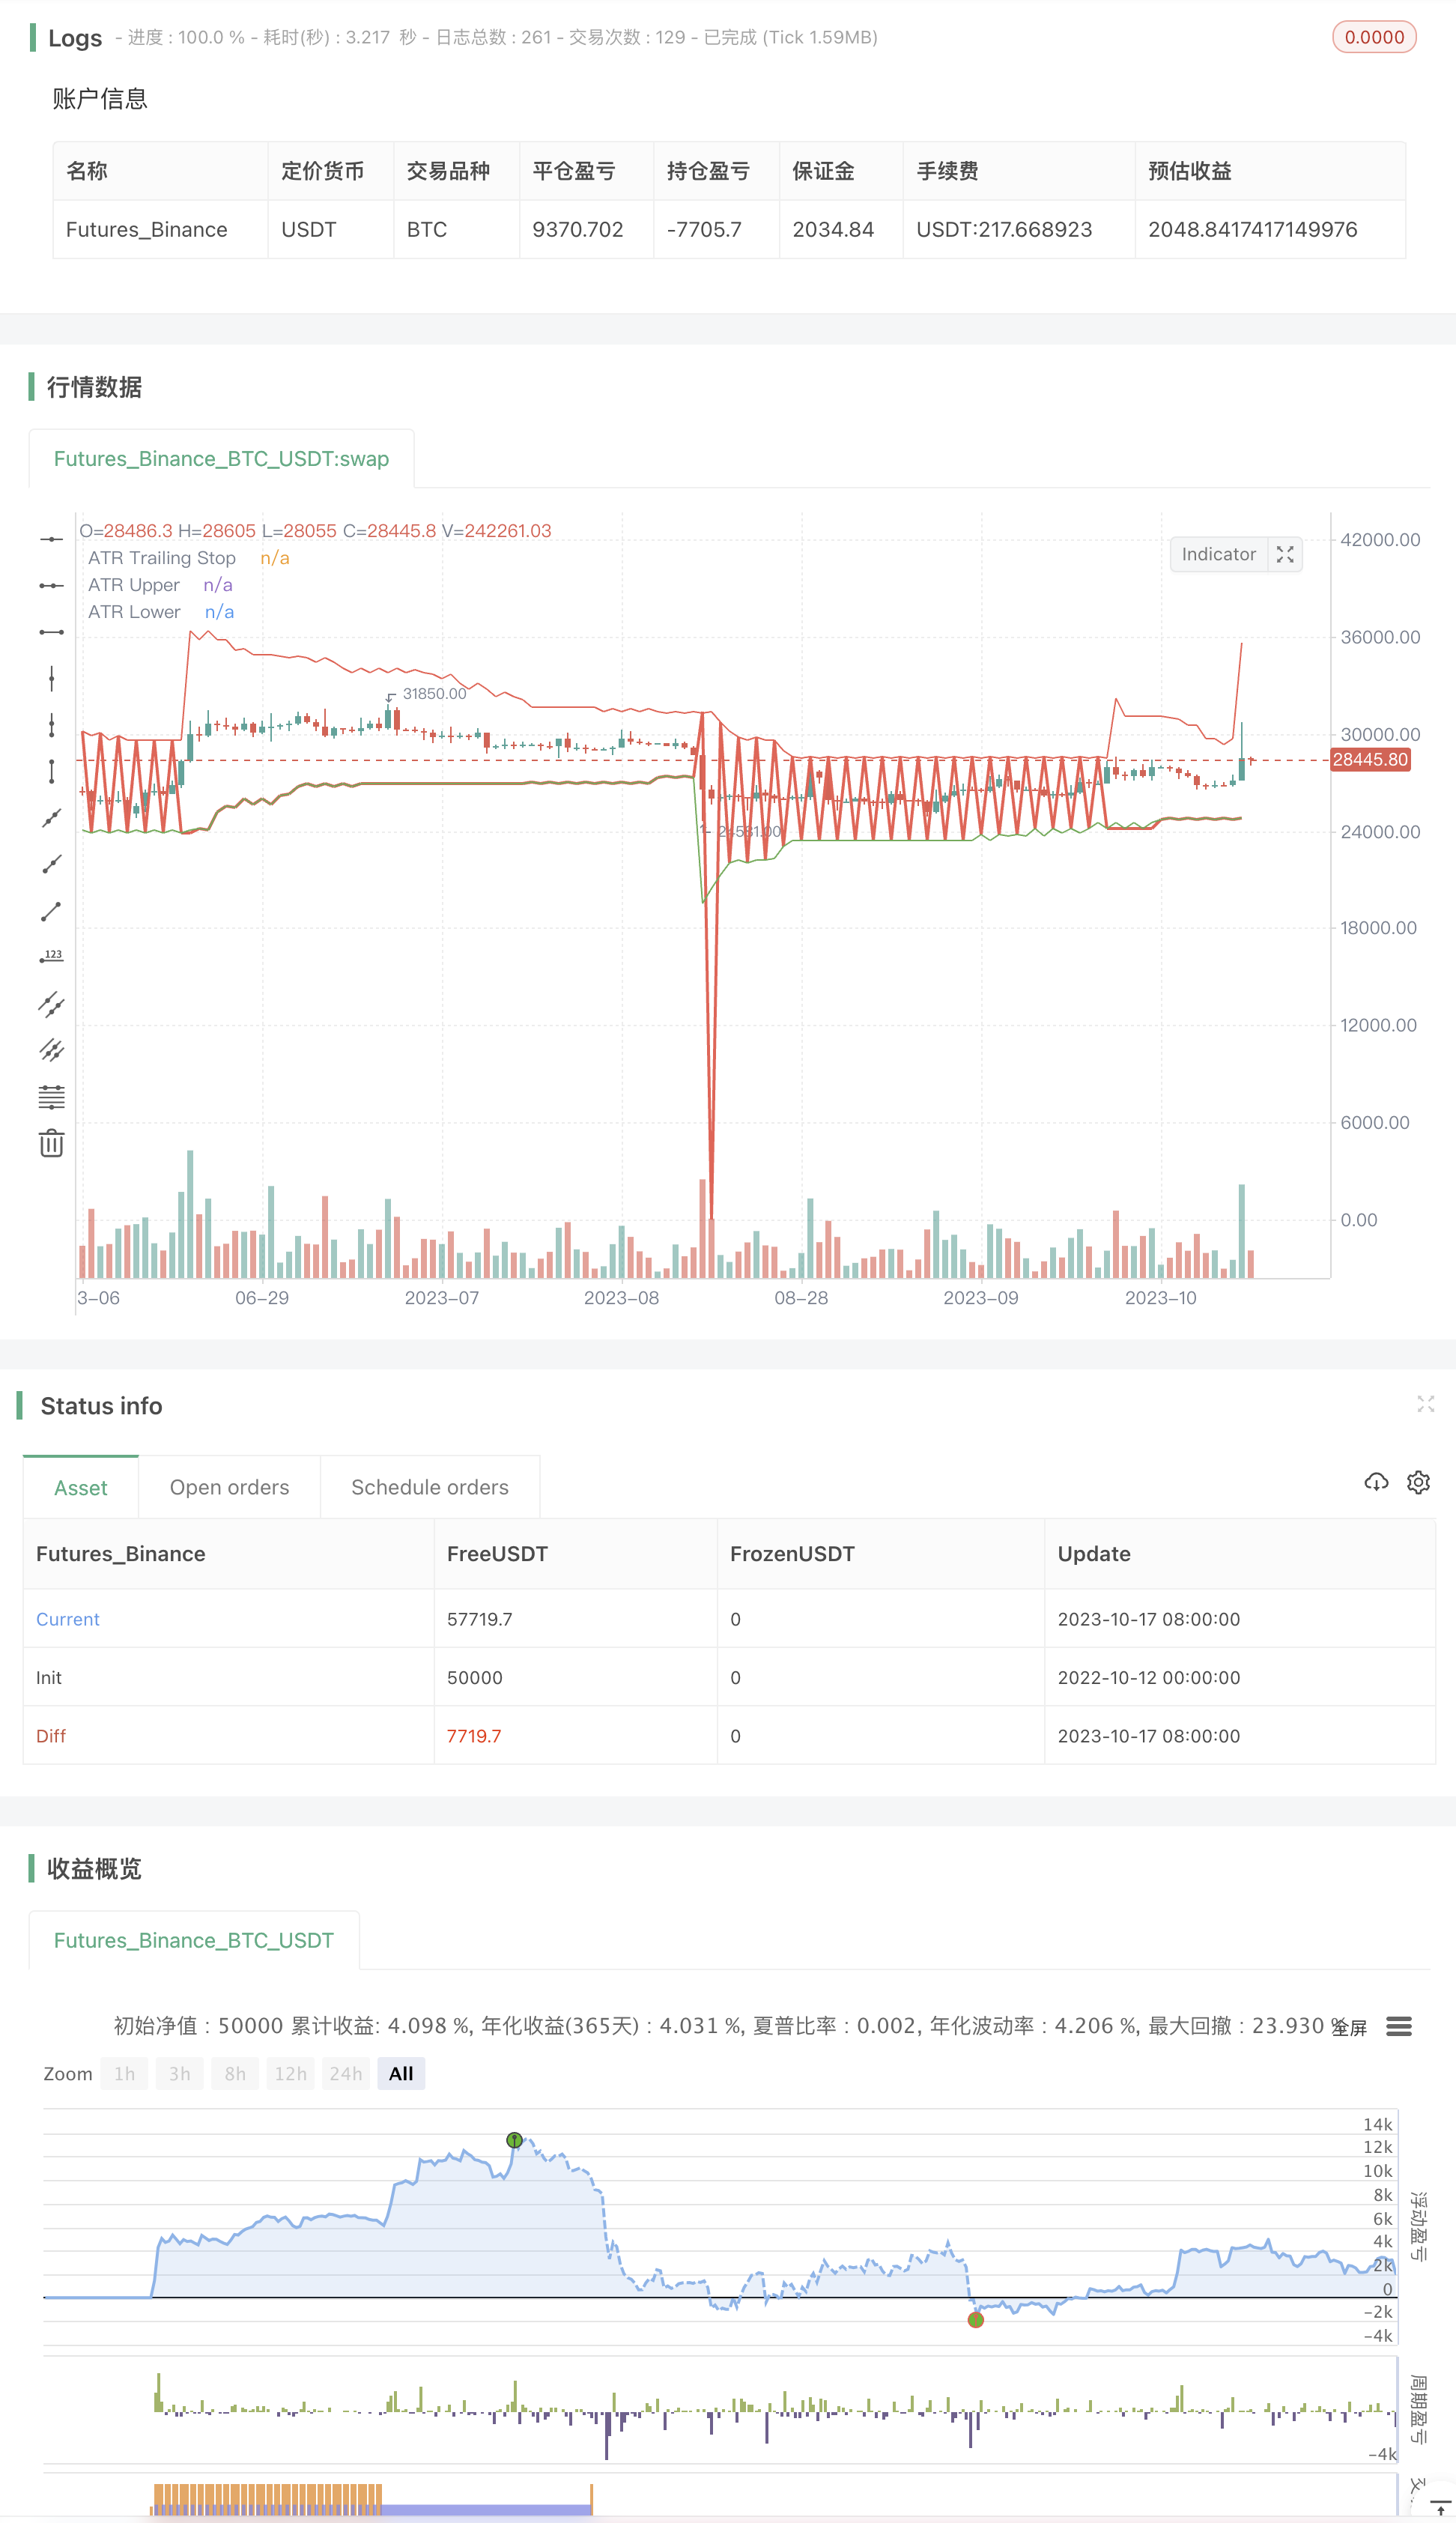
本策略的核心思想是利用平均真实波幅(ATR)指标来设定一个自适应的跟踪止损线,让获利的头寸得到最大程度的保护,同时避免过早止损。ATR指标能够动态捕捉市场的波动程度,根据市场波动调整止损距离,在保证止损的同时尽量减少止损被触发的概率。本策略同时加入布林带,可视化止损线的上下限,并可选择是否加入影线保护来抵御震荡市的影响。
策略原理
本策略使用ATR指标的N周期平均值乘以一个倍数作为基础止损距离。ATR值越大,表示市场波动越大,止损距离就设定的越宽;ATR值越小,止损距离就设定的越窄。这样可根据市场波动程度动态调整止损距离。
具体来说,策略使用以下核心逻辑:
-
计算ATR周期(nATRPeriod)的ATR值。
-
根据ATR值乘以倍数(nATRMultip)得到基础止损距离nLoss。
-
根据当前高点、低点和上一周期的止损线更新止损线xATRTrailingStop。
-
如果当前低点触发了上一周期止损线,则止损线上移至低点以下nLoss的距离。
-
如果当前高点触发了上一周期止损线,则止损线下移至高点以上nLoss的距离。
-
如果未触发止损,则根据收盘价离止损线的距离调整止损线。
-
加入可选的影线保护距离,进一步优化止损线。
-
绘制布林带轨道来可视化止损线的上下限。
-
根据止损线颜色判定持仓方向。
该策略灵活运用ATR指标,让止损线能够根据市场波动自适应调整,既可确保止损距离合理,也可尽量避免过于激进的止损造成不必要的头寸损失。
优势分析
本策略具有以下优势:
-
利用ATR指标动态调整止损距离,能够自适应不同市况。
-
倍数参数可自定义,实现止损距离的灵活调整。
-
加入布林带轨道,形成止损线的可视化上下限。
-
可选影线保护功能,避免震荡市的whipsaw。
-
可作为跟踪止损使用,让获利头寸最大限度回撤。
-
策略思路清晰易懂,参数少易优化。
-
可在多种品种和周期使用,适用面较广。
风险分析
本策略也存在一些风险需要注意:
-
ATR指标对市场突发事件反应滞后,可能导致止损距离过大。
-
倍数设置过大也会导致止损距离过宽,增加亏损风险。
-
影线保护功能在震荡增大时会使止损线过于宽松。
-
未考虑进场规则,不能作为 Entries/Exits 策略。
-
需反复测试优化参数,适应不同品种和周期。
-
突破止损可能导致亏损扩大,需要有效的资金管理。
优化方向
本策略可从以下几个方面进行优化:
-
测试不同的ATR周期参数,优化止损距离。
-
调整倍数参数,在止损距离和止损概率间找到平衡。
-
优化影线保护周期参数,防止 whipsaw。
-
尝试在止损基础上加入入场条件,使之成为 Entries/Exits 策略。
-
加入趋势判断指标,根据趋势调整止损距离。
-
结合波浪理论,根据波浪位置调整止损距离。
-
加入仓位控制,限制单笔损失。
总结
本策略利用ATR指标的自适应特性,设计了一个能够动态调整的止损机制。在保证止损的同时,也尽可能减少不必要的止损触发。策略思路简单清晰,可根据自身需要进行灵活优化。作为跟踪止损工具使用效果更佳,可最大限度保护头寸获利。在参数优化和风险控制到位的情况下,本策略可以成为量化交易中的一个有效止损工具。
||
Overview
The core idea of this strategy is to use the Average True Range (ATR) indicator to set an adaptive trailing stop loss line to maximize the protection of profitable positions while avoiding premature stop loss. The ATR indicator can dynamically capture the volatility of the market and adjust the stop loss distance based on market volatility, ensuring effective stop loss while minimizing the probability of stop loss being triggered. This strategy also incorporates Bollinger Bands for visualizing the upper and lower limits of the stop loss line, with the option of adding wick protection to counter the whipsaw effect in ranging markets.
Strategy Logic
This strategy uses the N period average of ATR indicator multiplied by a factor as the base stop loss distance. The larger the ATR value, the larger the market volatility, so the wider the stop loss distance is set. The smaller the ATR value, the narrower the stop loss distance is set. This allows dynamic adjustment of stop loss distance based on market volatility.
Specifically, the strategy uses the following core logic:
-
Calculate the ATR value of the ATR period (nATRPeriod).
-
Obtain the base stop loss distance nLoss by multiplying the ATR value by a factor (nATRMultip).
-
Update the stop loss line xATRTrailingStop based on current high, low and stop loss line of previous period.
-
If current low triggers previous period's stop loss line, the stop loss line moves up to below the low by nLoss distance.
-
If current high triggers previous period's stop loss line, the stop loss line moves down to above the high by nLoss distance.
-
If stop loss is not triggered, adjust the stop loss line based on the distance of close price to it.
-
Add optional wick protection distance for further optimization of stop loss line.
-
Plot Bollinger Bands to visualize upper and lower limit of stop loss line.
-
Determine position direction based on color of stop loss line.
The strategy flexibly uses ATR indicator to enable the stop loss line to adjust adaptively based on market volatility, ensuring reasonable stop loss distance while avoiding excessive stop loss that causes unnecessary loss of positions.
Advantages
The advantages of this strategy:
-
Use ATR indicator to adjust stop loss distance dynamically adapting to different market conditions.
-
Customizable multiplier allows flexible adjustment of stop loss distance.
-
Addition of Bollinger Bands provides visualization of upper and lower limits of stop loss line.
-
Optional wick protection avoids whipsaw in ranging markets.
-
Can be used as trailing stop loss to maximize drawdown of profitable positions.
-
Strategy logic is clear and easy to understand with few optimizable parameters.
-
Applicable to multiple products and timeframes.
Risks
Some risks of this strategy to note:
-
ATR indicator reacts slowly to market shocks, leading to large stop loss distance.
-
Excessive multiplier setting also enlarges stop loss distance, increasing loss risk.
-
Wick protection can make stop loss line too loose when whipsaw increases.
-
Entry rules not considered, cannot be used as Entries/Exits strategy.
-
Extensive testing and optimization of parameters needed for different products and timeframes.
-
Stop loss breakout may enlarge losses, requiring effective capital management.
Optimization Directions
The strategy can be optimized in the following aspects:
-
Test different ATR periods to optimize stop loss distance.
-
Adjust multiplier to balance between stop loss distance and probability.
-
Optimize wick protection period to prevent whipsaw.
-
Try adding entry conditions on top of stop loss to make it Entries/Exits strategy.
-
Add trend indicator to adjust stop loss distance based on trend.
-
Adjust stop loss based on Elliott Waves theory.
-
Add position sizing to limit single loss amount.
Summary
This strategy utilizes the adaptive characteristic of ATR indicator to design a dynamic stop loss mechanism. While ensuring stop loss, it also minimizes unnecessary stop loss triggers. The strategy logic is simple and clear, allowing flexible optimization based on needs. It works best as trailing stop loss to maximize protection of profits. With proper parameter optimization and risk control, this strategy can be an effective stop loss tool in quantitative trading.
[/trans]
Strategy Arguments
| Argument | Default | Description |
|---|---|---|
| v_input_1 | 5 | nATRPeriod |
| v_input_2 | 4 | nATRMultip |
| v_input_3 | 30 | #Periods of Wick Protection |
| v_input_4 | false | Max [1] or Avg Wick Protection [0] |
Source (PineScript)
/*backtest
start: 2022-10-12 00:00:00
end: 2023-10-18 00:00:00
period: 1d
basePeriod: 1h
exchanges: [{"eid":"Futures_Binance","currency":"BTC_USDT"}]
*/

//@version=2
////////////////////////////////////////////////////////////
//  Copyright by HPotter v2.0 13/10/2014
// Average True Range Trailing Stops Strategy, by Sylvain Vervoort
// The related article is copyrighted material from Stocks & Commodities Jun 2009
// Modified by River to add Bands, and change color of Trailing Stop and add Wick Protection. Now turned into a Strategy for Backtesting Purposes.
// After backtesting, it seems clear that it functions well as a Trailing Stop, but not as an Entry/Exit strategy.
////////////////////////////////////////////////////////////
strategy(title="ATR Trailing Stop Bands Strategy[R] ", overlay = true)
nATRPeriod = input(5)
nATRMultip = input(4)
length = input(30, "#Periods of Wick Protection", minval=2)
bType = input(0, "Max [1] or Avg Wick Protection [0]", minval=0, maxval=1)
avgupperwick = sma(close[1] <= open[1] ? high[1] - open[1] : high[1] - close[1], length)
maxupperwick = highest(close[1] <= open[1] ? high[1] - open[1] : high[1] - close[1], length)
avglowerwick = sma(close[1] > open[1] ? open[1] - low[1] : close[1] - low[1], length)
maxlowerwick = highest(close[1] > open[1] ? open[1] - low[1] : close[1] - low[1], length)
upperwick = bType == 0 ? avgupperwick : maxupperwick
lowerwick = bType == 0 ? avglowerwick : maxlowerwick
xATR = atr(nATRPeriod)
nLoss = nATRMultip * xATR
upperband = iff(high < nz(upperband[1], 0) and high[1] < nz(upperband[1], 0), min(nz(upperband[1]), high + nLoss + upperwick), high + nLoss + upperwick)
lowerband = iff(low > nz(lowerband[1], 0) and low[1] > nz(lowerband[1], 0), max(nz(lowerband[1]), low - nLoss - lowerwick), low - nLoss - lowerwick)
xATRTrailingStop = iff(low > nz(xATRTrailingStop[1], 0) and low[1] > nz(xATRTrailingStop[1], 0), max(nz(xATRTrailingStop[1]), low - nLoss - lowerwick),
 iff(high < nz(xATRTrailingStop[1], 0) and high[1] < nz(xATRTrailingStop[1], 0), min(nz(xATRTrailingStop[1]), high + nLoss + upperwick),
//                        iff(low <= nz(xATRTrailingStop[1], 0) and close[1] > nz(xATRTrailingStop[1], 0), high + nLoss + upperwick, iff(high >= nz(xATRTrailingStop[1], 0) and close[1] < nz(xATRTrailingStop[1], 0), low - nLoss - lowerwick,0))))
 iff(low <= nz(xATRTrailingStop[1], 0) and close[1] > nz(xATRTrailingStop[1], 0), upperband[1], iff(high >= nz(xATRTrailingStop[1], 0) and close[1] < nz(xATRTrailingStop[1], 0), lowerband[1],0))))

pos =	iff(close[1] > nz(xATRTrailingStop[1], 0) and low <= nz(xATRTrailingStop[1], 0), 1,
 iff(close[1] < nz(xATRTrailingStop[1], 0) and high >= nz(xATRTrailingStop[1], 0), -1, nz(pos[1], 0)))
color = pos == 1 ? red: pos == -1 ? green : blue
plot(upperband, color=red, title="ATR Upper")
plot(xATRTrailingStop, color=color, title="ATR Trailing Stop", linewidth=2)
plot(lowerband, color=green, title="ATR Lower")

longCondition = (color == green and color[1] == red)
if (longCondition)
    strategy.entry("Long", strategy.long)
longExitCondition = (color == red and color[1] == green)
if (longExitCondition)
    strategy.close("Long")

shortCondition = (color == red and color[1] == green)
if (shortCondition)
    strategy.entry("Short", strategy.short)
shortexitCondition = (color == green and color[1] == red)
if (shortexitCondition)
    strategy.close("Short")
Detail
https://www.fmz.com/strategy/429651
Last Modified
2023-10-19 12:42:26