
19 KiB
Name
基于量价指标的多空平衡交易策略Volume-Price-Indicator-Balanced-Trading-Strategy
Author
ChaoZhang
Strategy Description
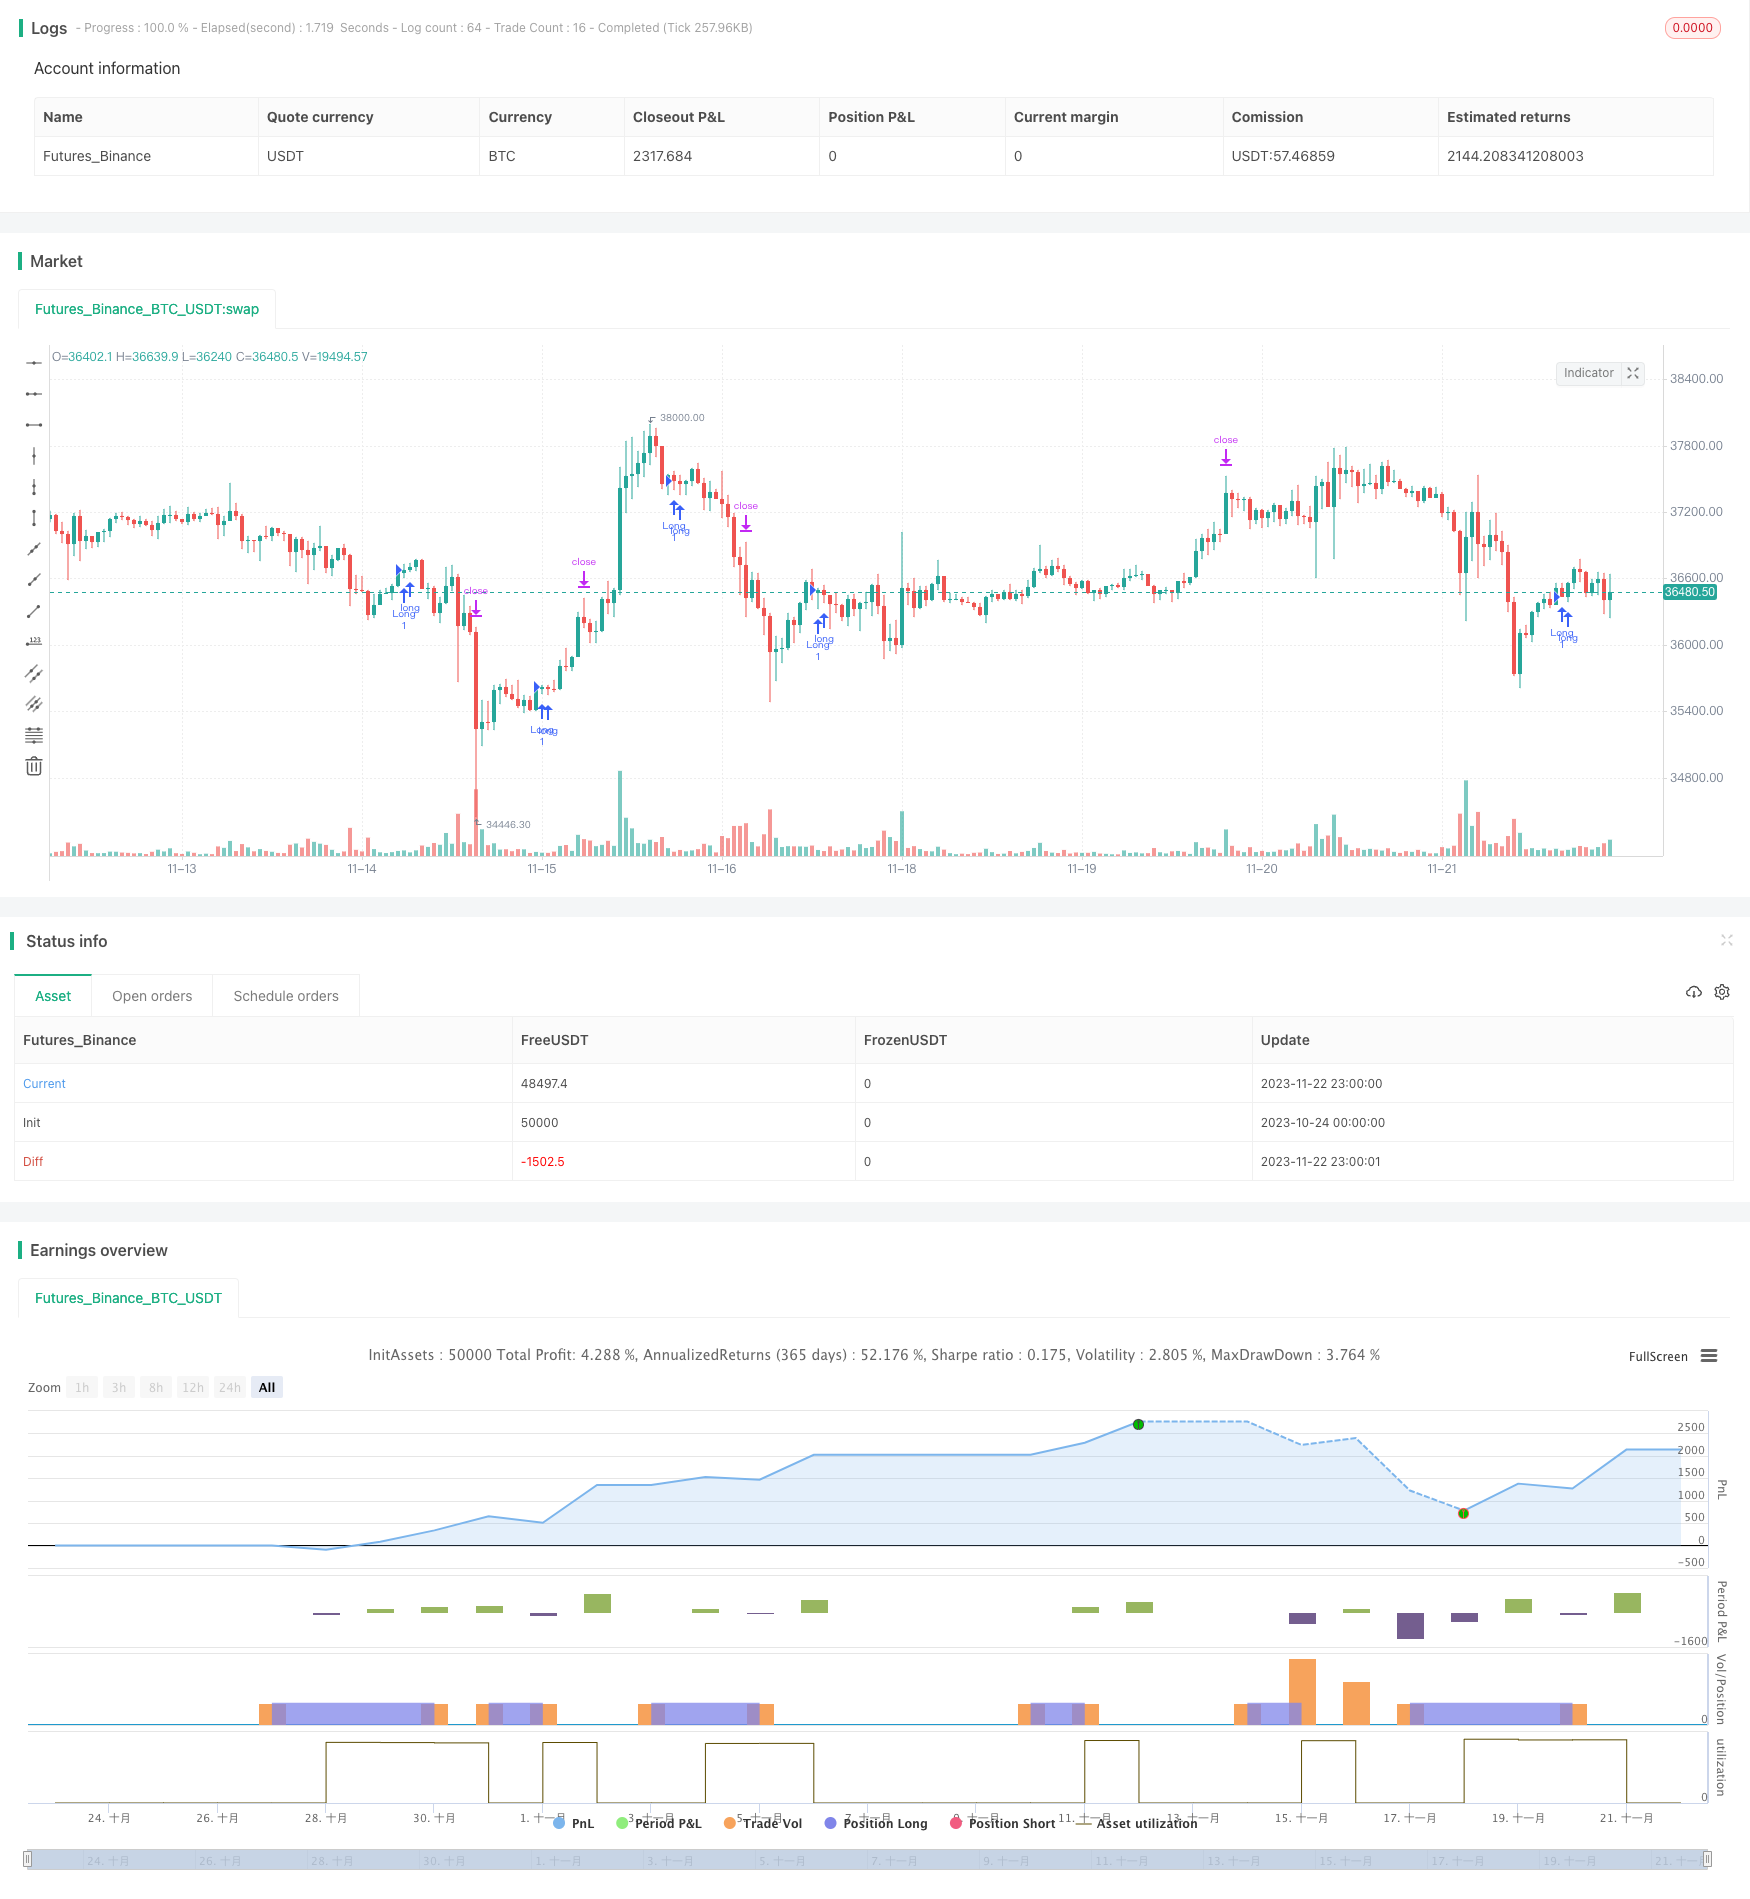
[trans]
概述
该策略是一种多时间框架的量价指标交易策略。它综合运用了相对强弱指数(RSI)、平均真实波幅(ATR)、简单移动平均线(SMA)以及自定义的量价条件来识别潜在的做多信号。当满足一定的超卖、量价指标交叉、价格突破等条件时,该策略会建立做多头寸。同时,它也设置了止损位和止盈位来控制每单的风险收益比。
策略原理
该策略主要基于以下几个关键点:
- RSI低于超卖线且在最近10根K线内连续处于超卖状态时,视为超卖信号
- 定义了多组量价条件,需要同时满足这些量价条件才认为量价指标发出做多信号
- 当收盘价从下向上突破13周期的SMA时,视为价格的突破信号
- ATR小周期低于大周期也是助推信号
- 综合上述多个指标信号,形成最终做多决策
具体来说,该策略对RSI指标设置了长度和超卖线参数,根据这些参数计算RSI值。当RSI指标连续多根K线低于超卖线时,产生超卖信号。
此外,该策略定义了3个交易量阈值,根据不同时间周期的数据,设定了多组量价条件。例如90周期的量值大于49周期量值的1.5倍。当这些量价条件同时满足时,发出量价指标的做多信号。
在价格方面,该策略计算13周期SMA指标,并统计价格向上突破SMA以来的K线数量。当价格从下向上突破SMA,且突破后的K线数量少于5根时,视为价格的突破信号。
ATR周期参数方面,该策略指定了小周期5和大周期14的ATR。当小周期ATR低于大周期ATR时,表示市场波动加速缩小,作为助推的做多信号。
最终,该策略综合考虑上述多个买入条件,包括超卖、量价指标、价格突破和ATR指标。当这些条件同时满足时,产生最终的做多信号,并建立做多头寸。
策略优势
该策略具有以下几个优势:
-
多时间框架量价指标判断,提高精确度。策略不仅考虑单一周期的量价数据,而是评估多组不同周期量价条件的交叉情况,可以更精确判断量能的集中度。
-
超卖+量价+价格三重判断机制,确保买入信号的可靠性。超卖提供了最基础的买入时点选取,此外量价和价格的指标交叉为买入时机增加了额外确认,可靠性较高。
-
设置止损止盈机制严格控制单笔交易风险。止损和止盈参数可以根据个人风险偏好进行调整,在追求利润最大化的同时合理控制每单的风险。
-
多指标集成判断增加弹性。即使部分指标发生故障或错误,仍能依靠其他指标判断保证一定的持续运作能力。
风险及对策
该策略也存在一些风险:
-
参数配置风险。各类指标的参数设置直接影响判断结果,不合理的参数可能导致交易信号产生偏差。需认真求证参数的合理取值。
-
盈利空间有限。作为融合多个指标进行集成判断的策略,信号产生频率相对更为保守,单位时间内交易次数较少,盈利空间存在一定局限。
-
指标发散风险。当部分指标发出做多信号而另一些指标发出做空信号时,策略无法确定最优决策。这需要提前识别并解决指标间可能的发散情况。
策略优化方向
该策略可以进一步从以下几个方面进行优化:
-
增加机器学习模型辅助判断。可以训练量价及波动特征模型,辅助人工设定的参数,实现参数的动态化。
-
提高止盈策略的成熟度。例如可以设置浮动止盈、分批止盈、跟踪止盈等,在防止掉期的同时可以进一步提升每单收益。
-
评估引入盘口数据。除K线量价数据外,结合深度买卖盘口数据也可以判断持仓分布情况,可提供额外参考信号。
-
测试校验其他指标集成。本策略主要运用RSI、ATR和SMA等指标进行集成,还可以尝试引入布林线、KDJ等其他指标组合,丰富和优化交易信号来源。
总结
本策略综合运用了RSI、ATR、SMA及自定义量价条件判断来实现对潜在做多时机的识别。它同时具有多时间框架量价指标判断、三重信号确认机制及止损止盈控制风险等优势。当然也需要留意参数配置风险、盈利空间限制等问题。未来该策略可以从机器学习辅助、止盈策略优化、盘口数据引入及指标集成扩展等方面进行进一步优化。
||
Overview
This strategy is a multi-timeframe volume price indicator trading strategy. It comprehensively utilizes the Relative Strength Index (RSI), Average True Range (ATR), Simple Moving Average (SMA) and custom volume price conditions to identify potential long signals. When certain oversold, volume price crossover, price breakout and other entry conditions are met, this strategy will establish long positions. It also sets stop loss and take profit levels to control the risk-reward ratio per trade.
Strategy Logic
The key points of this strategy are:
- When the RSI is below the oversold level and stays oversold for the recent 10 bars, it is considered an oversold signal
- Multiple sets of volume price conditions are defined, and all these conditions need to be satisfied at the same time to trigger the volume price indicator long signal
- When the close price breaks above the 13-period SMA, it is considered a price breakout signal
- The ATR small period being lower than the ATR big period is also a contributing long signal
- The strategy combines all the above signals to make the final long entry decision
Specifically, this strategy sets the length and oversold parameters for the RSI indicator and calculates the RSI values based on these parameters. When the RSI stays below the oversold level for multiple successive bars, an oversold signal is triggered.
In addition, the strategy defines 3 volume thresholds and sets up multiple sets of volume price conditions based on data from different timeframes. For example, the volume value of the 90-period is greater than 1.5 times that of the 49-period. When all these volume price conditions are met at the same time, the volume price indicator generates a long signal.
On the price aspect, the strategy calculates the 13-period SMA and counts the number of bars since the price breaks above the SMA. When the price breaks out above the SMA and the number of bars after breakout is less than 5, it is considered a price breakout signal.
For the ATR period parameters, this strategy specifies a small period of 5 and a big period of 14 for the ATR. When the small period ATR is lower than the big period ATR, it signals that the market volatility is accelerating downward and contributes to the long signal.
Finally, the strategy takes into account all the above entry criteria, including oversold, volume price, price breakout and ATR indicators. When all these conditions are met at the same time, the final long signal is triggered and a long position is established.
Advantages
This strategy has the following advantages:
-
Multi-timeframe volume price condition judgement improves accuracy. By evaluating multiple sets of volume price data across different timeframes instead of just a single timeframe, the strategy can judge the concentration of trading volumes more precisely.
-
The triple confirmation mechanism of oversold + volume price + price breakout ensures reliable entry signals. The oversold condition provides the basic timing for entries, while the additional confirmations from volume price and price indicators further ensure the reliability of the long signals.
-
The stop loss and take profit mechanism strictly controls the risk per trade. The stop loss and take profit parameters can be adjusted based on personal risk appetite to maximize profits while reasonably controlling the risk per trade.
-
Integrating multiple indicators increases robustness. Even if some indicators fail or malfunction, the strategy can still rely on other indicators for judgement and ensure a certain level of resilience.
Risks and Countermeasures
There are also some risks with this strategy:
-
Parameter configuration risk. The parameter settings of indicators directly impact the judgement, and improper parameters may lead to biases in the trading signals. The reasonable parameter values need to be carefully validated.
-
Limited profit potential. As a strategy integrating multiple indicators for collective judgement, its signals tend to be more conservative with relatively fewer trades per unit time, thus the profit potential has some constraints.
-
Indicator divergence risk. When some indicators give out long signals while others give out short signals, the strategy cannot determine the optimal decision. Such potential divergence amongst indicators needs to be identified and resolved in advance.
Optimization Directions
This strategy can be further optimized in the following aspects:
-
Incorporate machine learning models to aid judgement. Models can be trained on the volume price and volatility features to dynamically tune the manually defined parameters.
-
Improve the sophistication of take profit strategies, such as trailing stop take profit, partial take profits, etc. to further increase the profit per trade while preventing loss of profit.
-
Evaluate incorporating order book data. In addition to price & volume chart data, order book data also reveals depth liquidity distribution information to provide supplementary reference signals.
-
Test combinations with other indicators. This strategy mainly utilizes indicators like RSI, ATR and SMA. Other indicators such as Bollinger Bands and KDJ can also be combined to diversify and optimize the sources of trading signals.
Conclusion
This strategy utilizes a combination of indicators including RSI, ATR, SMA and custom volume price conditions to identify potential long entry opportunities. It has advantages like multi-timeframe volume price evaluation, triple confirmation mechanism and stop loss/take profit risk controls. Nonetheless, risks like parameter configuration, constrained profit potential also need to be noted. In the future, this strategy can be further enhanced via machine learning augmentation, more sophisticated take profit design, incorporation of order book data as well as expanded indicator combinations.
[/trans]
Strategy Arguments
| Argument | Default | Description |
|---|---|---|
| v_input_float_1 | 3 | (?▶ Stop Loss/Take Profit => Long-Strategy)Stop-Loss (SL) % |
| v_input_float_2 | 2 | Take-Profit (TP) % |
| v_input_int_1 | true | (?▶ ValueWhen)occurrence_ValueWhen_1 |
| v_input_int_2 | 5 | occurrence_ValueWhen_2 |
| v_input_int_3 | 170 | distance_value_occurrence |
| v_input_int_4 | 60 | (?▶ RSI)Oversold Level |
| v_input_int_5 | 40 | RSI Length |
| v_input_float_3 | 0.5 | (?▶ Volume)volume_threshold_1 |
| v_input_float_4 | 0.4 | volume_threshold_2 |
| v_input_float_5 | 0.62 | volume_threshold_3 |
| v_input_int_6 | 5 | (?▶ Atr)ATR_Small |
| v_input_int_7 | 14 | ATR_Big |
| v_input_int_8 | true | (?▶ Time-Period for Back-Testing)Start Day |
| v_input_int_9 | true | until Day |
| v_input_int_10 | 7 | Start Month |
| v_input_int_11 | true | until Month |
| v_input_int_12 | 2022 | Start Year |
| v_input_int_13 | 2077 | until Year |
Source (PineScript)
/*backtest
start: 2023-10-24 00:00:00
end: 2023-11-23 00:00:00
period: 1h
basePeriod: 15m
exchanges: [{"eid":"Futures_Binance","currency":"BTC_USDT"}]
*/

// © Kimply_Tr
//@version=5

// Strategy settings and parameters
strategy(title='Volume ValueWhen Velocity', overlay=true)

// Define the stop-loss and take-profit percentages for the long strategy
long_stoploss_value = input.float(defval=3, title='Stop-Loss (SL) %', minval=0, group='▶ Stop Loss/Take Profit => Long-Strategy', inline='2')
long_stoploss_percentage = close * (long_stoploss_value / 100) / syminfo.mintick  // Calculate long stop-loss percentage
long_takeprofit_value = input.float(defval=2, title='Take-Profit (TP) %', minval=0, group='▶ Stop Loss/Take Profit => Long-Strategy', inline='2')
long_takeprofit_percentage = close * (long_takeprofit_value / 100) / syminfo.mintick  // Calculate long take-profit percentage

// Define parameters related to ValueWhen occurrences
occurrence_ValueWhen_1 = input.int(title='occurrence_ValueWhen_1', defval=1, maxval=100, step=1, group="▶ ValueWhen",tooltip ="Its value must be smaller than (occurrence_ValueWhen_2)")
occurrence_ValueWhen_2 = input.int(title='occurrence_ValueWhen_2', defval=5, maxval=100, step=1, group="▶ ValueWhen" ,tooltip="Its value must be greater than (occurrence_ValueWhen_1)")
distance_value=input.int(title='distance_value_occurrence', defval=170, maxval=5000, step=1, group="▶ ValueWhen" ,tooltip="It indicates the minimum distance between the occurrences of 1 and 2, i.e. the difference between the occurrences of 1 and 2 is greater than (distance_value_occurrence)")

// Define RSI-related parameters
rsi_over_sold = input.int(defval=60, minval=1, title='Oversold Level', group='▶ RSI',inline ='2')  // Input for oversold level in RSI
rsi_length = input.int(defval=40, minval=1, title='RSI Length', group='▶ RSI',inline ='2')  // Input for RSI length
rsi = ta.rsi(close, rsi_length)  // Calculate RSI

// Define volume thresholds
volume_threshold1 = input.float(title='volume_threshold_1', defval=0.5, maxval=10, step=0.1, group="▶ Volume")
volume_threshold2 = input.float(title='volume_threshold_2', defval=0.4, maxval=10, step=0.1, group="▶ Volume")
volume_threshold3 = input.float(title='volume_threshold_3', defval=0.62, maxval=10, step=0.1, group="▶ Volume")

// ATR (Average True Range)
// Define ATR parameters
atr_small = input.int(title='ATR_Small', defval=5, maxval=500, step=1, group="▶ Atr",inline ='2')
atr_big = input.int(title='ATR_Big ', defval=14, maxval=500, step=1, group="▶ Atr",inline ='2')

atr_value3 = ta.atr(15)  // Calculate ATR value 3
////////////////////////////////////////////////////////////////////////////////////////////////////////////////////////
// Date Range
// Define the date range for back-testing
start_date = input.int(title='Start Day', defval=1, minval=1, maxval=31, group='▶ Time-Period for Back-Testing', inline='1')  // Input for start day
end_date = input.int(title='until Day', defval=1, minval=1, maxval=31, group='▶ Time-Period for Back-Testing', inline='1')  // Input for end day
start_month = input.int(title='Start Month', defval=7, minval=1, maxval=12, group='▶ Time-Period for Back-Testing', inline='2')  // Input for start month
end_month = input.int(title='until Month', defval=1, minval=1, maxval=12, group='▶ Time-Period for Back-Testing', inline='2')  // Input for end month
start_year = input.int(title='Start Year', defval=2022, minval=1800, maxval=3000, group='▶ Time-Period for Back-Testing', inline='3')  // Input for start year
end_year = input.int(title='until Year', defval=2077, minval=1800, maxval=3000, group='▶ Time-Period for Back-Testing', inline='3')  // Input for end year
in_date_range = time >= timestamp(syminfo.timezone, start_year, start_month, start_date, 0, 0) and time < timestamp(syminfo.timezone, end_year, end_month, end_date, 0, 0)  // Check if the current time is within the specified date range
////////////////////////////////////////////////////////////////////////////////////////////////////////////////////////
was_over_sold = ta.barssince(rsi <= rsi_over_sold) <= 10  // Check if RSI was oversold in the last 10 bars
////////////////////////////////////////////////////////////////////////////////////////////////////////////////////////
getVolume(symbol, bar) =>
    request.security(syminfo.tickerid, "D", volume)[bar]  // Function to get volume data for a specific symbol and bar

getVolume2(symbol, bar) =>
    request.security(syminfo.tickerid, "39", volume)[bar]  // Function to get volume data for a specific symbol and bar 2
////////////////////////////////////////////////////////////////////////////////////////////////////////////////////////

firstCandleColor1 = request.security(syminfo.tickerid, "D", close[2] > open[1] ? 1 : 0)
firstCandleColor2 = request.security(syminfo.tickerid, "1", close[2] > open[0] ? 1 : 0)
firstCandleColor3 = request.security(syminfo.tickerid, "W", close[1] > open[1] ? 1 : 0)

firstCandleColor= ((firstCandleColor1+firstCandleColor2)) > firstCandleColor3 ? 1 : 0

////////////////////////////////////////////////////////////////////////////////////////////////////////////////////////
sma = ta.sma(close, 13)  // Calculate the simple moving average (SMA) of the close price over 13 periods
numCandles = ta.barssince(close > sma)  // Count the number of candles since the close price crossed above the SMA
atr1=request.security(syminfo.tickerid, "30", ta.atr(atr_small)<ta.atr(atr_big))  // Get the ATR value for the specific security and timeframe (30 minutes) and check if ATR_small is less than ATR_big

prevClose = ta.valuewhen(close > sma, close, occurrence_ValueWhen_1)  // Get the close price when it first crosses above the SMA based on occurrence_ValueWhen_1
prevCloseBarsAgo = ta.valuewhen(close > sma, close, occurrence_ValueWhen_2)  // Get the close price when it first crosses above the SMA based on occurrence_ValueWhen_2
prevCloseChange =  (prevCloseBarsAgo - prevClose )  // Calculate the change in the close price between the occurrences of crossing above the SMA

atrval=(atr_value3>140) or (atr_value3 < 123)  // Check if atr_value3 is either greater than 140 or less than 123

Condition =  getVolume(syminfo.tickerid, 90) > volume_threshold1 * getVolume(syminfo.tickerid, 49)   and getVolume(syminfo.tickerid, 110) > volume_threshold3 * getVolume(syminfo.tickerid, 49)  and getVolume2(syminfo.tickerid, 30) > volume_threshold2 * getVolume2(syminfo.tickerid, 55) and getVolume2(syminfo.tickerid, 7) > volume_threshold2 * getVolume2(syminfo.tickerid, 3)  // Check multiple volume conditions

buy_signal=Condition  and atrval and firstCandleColor==0 and  was_over_sold and  prevCloseChange> distance_value and atr1 and  numCandles<5  // Determine if the buy signal is generated based on various conditions

////////////////////////////////////////////////////////////////////////////////////////////////////////////////////////
// Long Strategy
// Enter long position if the buy signal conditions are met and within the specified date range
if buy_signal and in_date_range
    strategy.entry('Long', strategy.long, alert_message='Open Long Position')  // Enter long position
    strategy.exit('Long SL/TP', from_entry='Long', loss=long_stoploss_percentage, profit=long_takeprofit_percentage, alert_message='Your SL/TP-Limit for the Long-Strategy has been activated.')  // Exit long position with stop-loss and take-profit
Detail
https://www.fmz.com/strategy/433102
Last Modified
2023-11-24 14:35:13