
9.0 KiB
Name
基于趋势置信度的趋势跟踪策略Trend-Following-Strategy-Based-on-Trend-Confidence
Author
ChaoZhang
Strategy Description
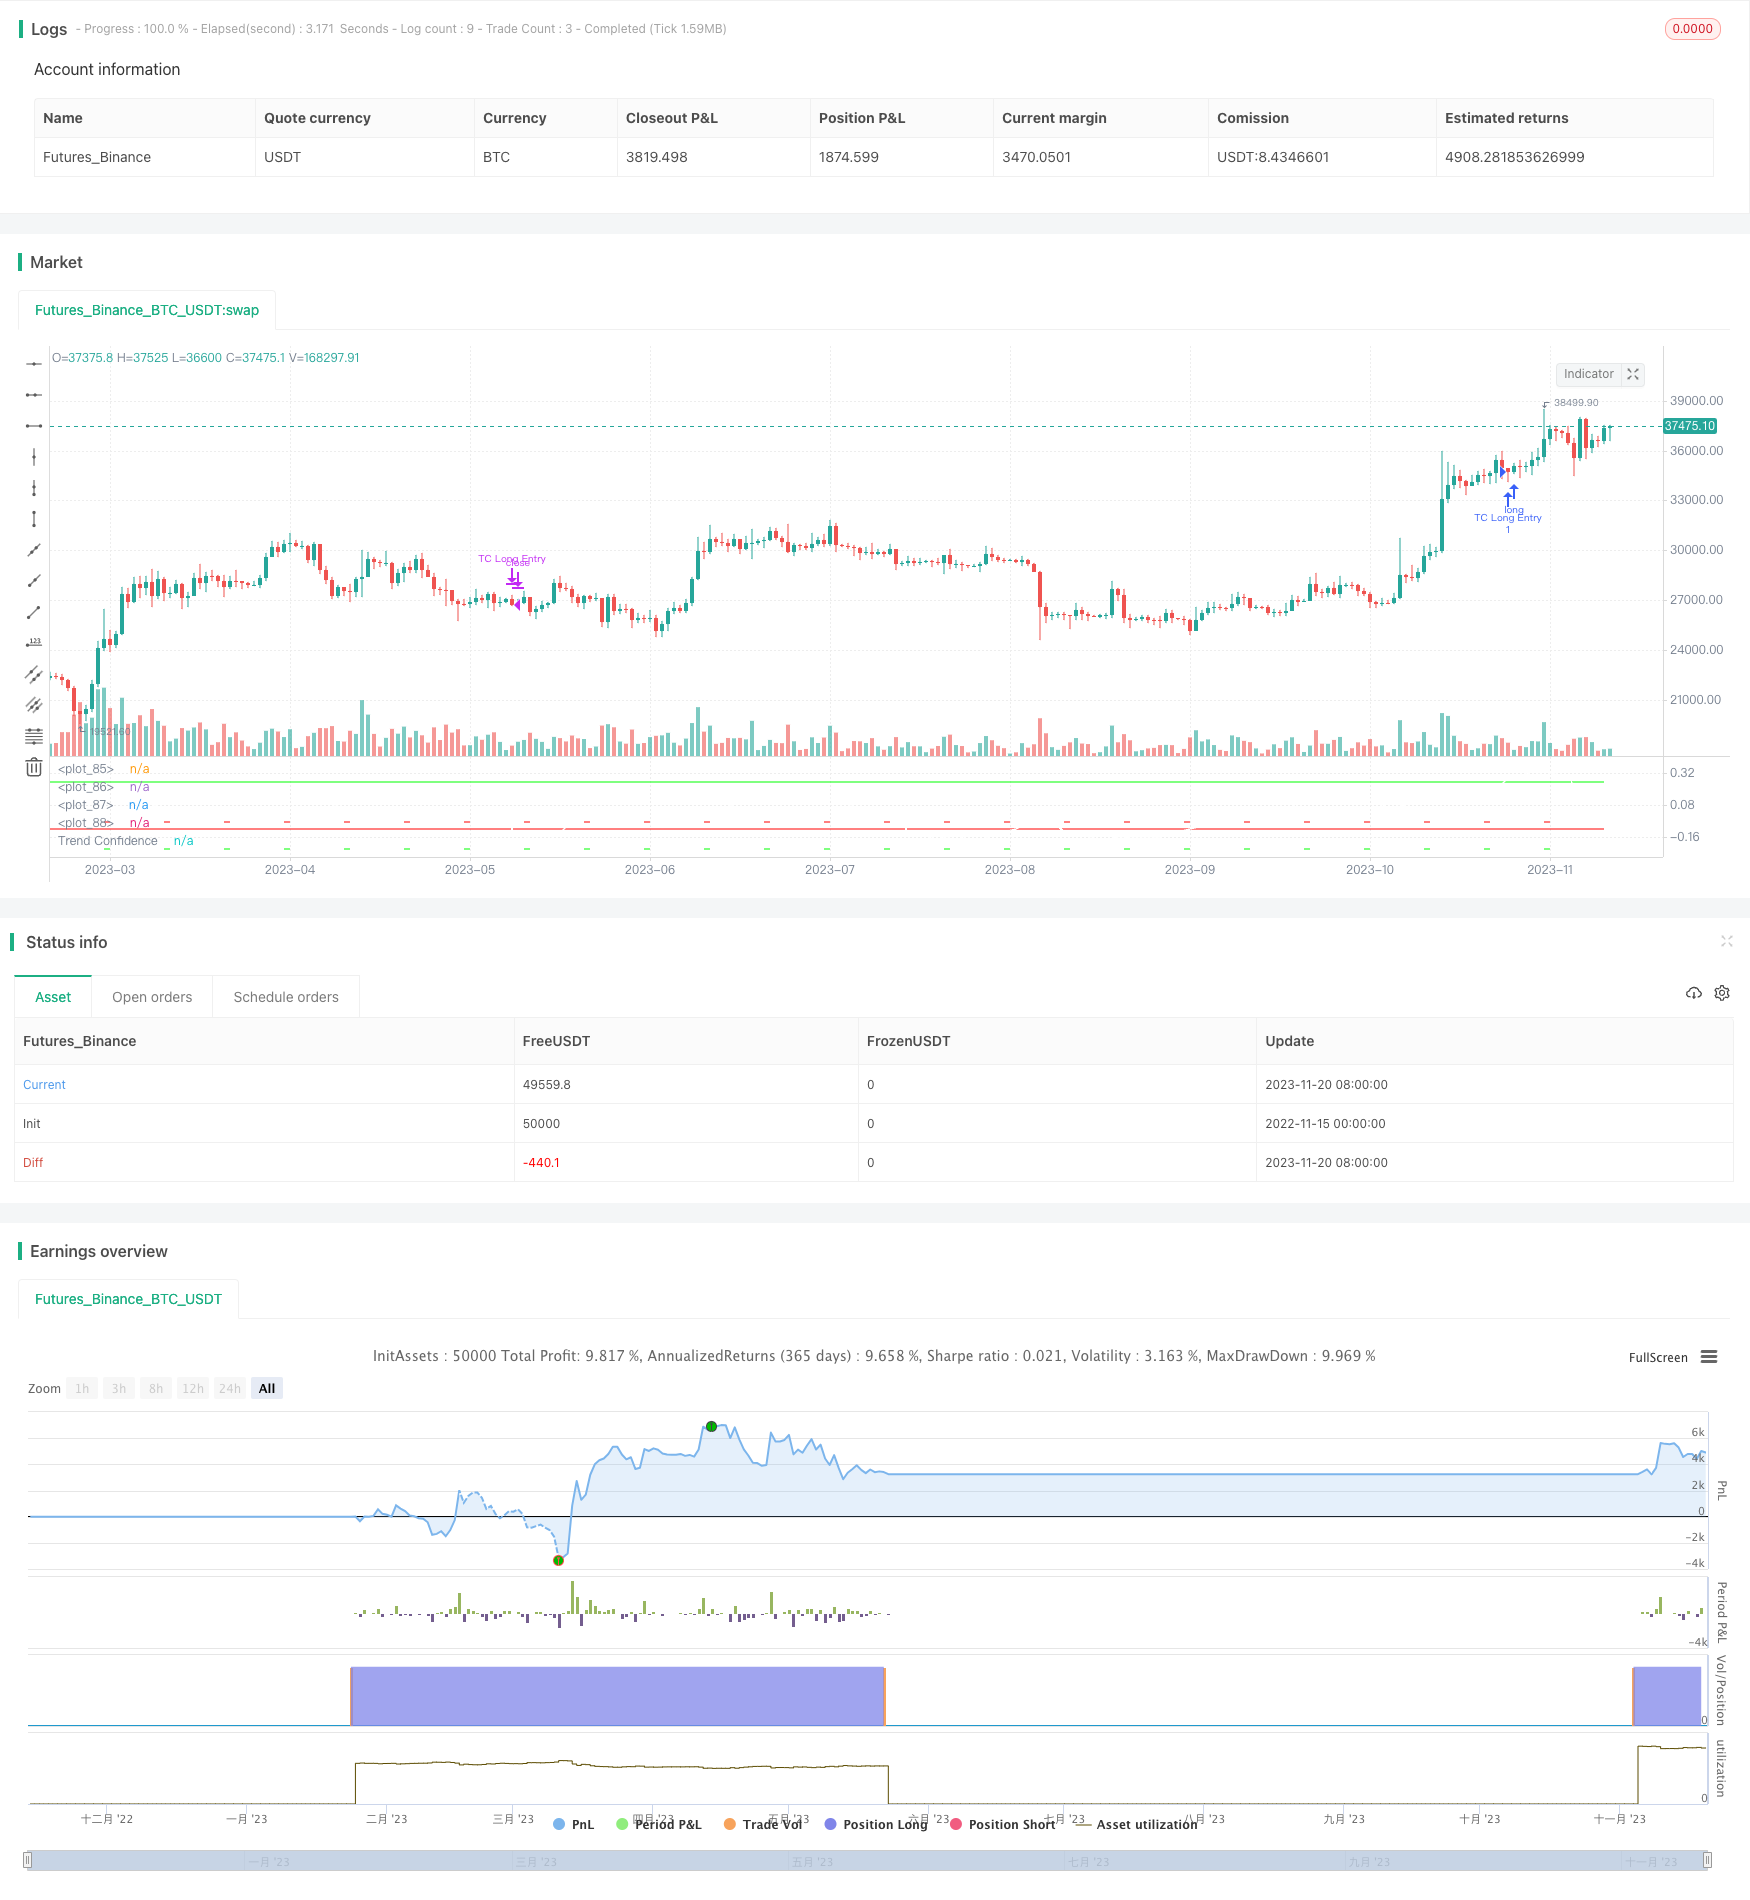 [trans]
概述
该策略的主要思想是实现一个尽可能精确的趋势跟踪策略。它通过计算过去一定数量收盘价的“置信度”来判断当前线性趋势的持续可能性。该策略假设,一旦置信度超过一定水平,正在发生的线性趋势更有可能持续下去。
策略原理
该策略通过普通线性回归方法计算过去N个收盘价的线性拟合,获得线性拟合的斜率k和与收盘价的偏差标准差σ。然后定义趋势置信度为k/σ。
当趋势置信度超过“做多入场”阈值时,做多;当下跌到“做多平仓”阈值时,平仓。同理,当趋势置信度低于“做空入场”阈值时,做空;当超过“做空平仓”阈值时,平仓。
这样,它可以过滤掉野性的、不遵循明确线性趋势的价格变动带来的信号。
优势分析
该策略结合了趋势跟踪和统计学中的线性回归方法,でき避免追随短期价格震荡,只跟随长期趋势,从而获得较低的交易频率和较高的胜率。
该策略参数调优空间大,可以通过调整参数适用于不同品种和时间周期,实现良好的泛化性。
风险分析
该策略存在被套利的风险。当价格出现明显趋势反转时,策略会产生较大亏损。此外,参数设置不当也会导致过度交易或错失良好交易机会。
可以设置止损来控制亏损风险。同时,必须慎重评估参数的选择,避免过度优化。
优化方向
该策略可以在以下方面进行进一步优化:
-
增加止损、止盈逻辑,以锁定利润、控制风险
-
增加参数自适应优化模块,使参数可以动态调整
-
增加机器学习模型判断趋势反转点,进一步提高策略胜率
-
尝试不同品种、时间周期的适配性,提高泛化能力
总结
该策略总体上是一个立足长期趋势、控制风险的量化策略。它融合了趋势跟踪和线性回归方法,可以过滤噪音交易信号。通过参数调优,它可以很好地适配不同品种和周期,是一种值得重点研究和改进的有效策略。
||
Overview
The main idea of this strategy is to implement a trend following strategy that is as precise as possible. It judges the continuity possibility of the current linear trend by calculating the "confidence" of a certain number of past closing prices. The strategy assumes that once the confidence exceeds a certain level, the ongoing linear trend is more likely to continue.
Strategy Principle
The strategy calculates the linear fit of the past N closing prices using ordinary linear regression, obtaining the slope k and standard deviation σ of the deviation from the closing prices. Then the trend confidence is defined as k/σ.
When the trend confidence exceeds the "long entry" threshold, go long; when it drops to the "long exit" threshold, close long. Similarly, when the trend confidence is below the "short entry" threshold, go short; when it exceeds the "short exit" threshold, close short.
This way it can filter out signals from wild price moves that do not follow a clear linear trend.
Advantage Analysis
The strategy combines trend following and linear regression methods in statistics, which can avoid following short-term price fluctuations and only follow long-term trends, thus obtaining lower trading frequency and higher win rate.
The strategy has large parameter tuning space and can be adapted to different products and timeframes by adjusting parameters, achieving good generalizability.
Risk Analysis
The strategy has the risk of being trapped. It will generate large losses when significant trend reversal occurs. In addition, improper parameter settings can also lead to overtrading or missing good trading opportunities.
Stop loss can be set to control downside risk. At the same time, the choice of parameters must be evaluated carefully to avoid overfitting.
Optimization Directions
The strategy can be further optimized in the following aspects:
-
Add stop loss/take profit logic to lock in profits and control risks
-
Add adaptive optimization module for dynamic parameter adjustment
-
Add machine learning model to determine trend reversal points and further improve win rate
-
Test adaptability on different products and timeframes to improve generalization
Conclusion
In general, this is a long-term trend following strategy with risk control. It combines trend following and linear regression methods to filter out noise trading signals. Through parameter tuning, it can adapt well to different products and timeframes, and is an effective strategy worth in-depth research and improvement.
[/trans]
Strategy Arguments
| Argument | Default | Description |
|---|---|---|
| v_input_1_close | 0 | source: close |
| v_input_2 | timestamp(2000-01-01) | Start trading interval |
| v_input_3 | timestamp(2030-01-01) | End trading interval |
| v_input_4 | 30 | Length |
| v_input_bool_1 | true | Longs |
| v_input_bool_2 | true | Shorts |
| v_input_float_1 | 0.25 | Long entry threshold |
| v_input_float_2 | -0.1 | Long exit threshold |
| v_input_float_3 | -0.25 | Short entry threshold |
| v_input_float_4 | -0.05 | Short exit threshold |
| v_input_float_5 | 10 | Stop loss (percentage) |
Source (PineScript)
/*backtest
start: 2022-11-15 00:00:00
end: 2023-11-21 00:00:00
period: 1d
basePeriod: 1h
exchanges: [{"eid":"Futures_Binance","currency":"BTC_USDT"}]
*/

// This source code is subject to the terms of the Mozilla Public License 2.0 at https://mozilla.org/MPL/2.0/
// © carefulCamel61097

// ################################################################################################

// "This is a trend following strategy that performed very well on the past 5 years"
// "Intended to be used on BTC-USDT, 4hr timeframe"

// "A factor 2 Leverage can be added by changing Order Size to 200% of equity"
// "Higher leverage is not recommended due to big drawdowns"

// "Also seems to work on 1D timeframe, although ideal parameters may be different"
// "Also seems to work on ETH-USDT and some other altcoins, although ideal parameters are different"

// ################################################################################################

//@version=5
strategy("Trend Following based on Trend Confidence", overlay=false )

// Inputs

source      = input(close)

since       = input(timestamp('2000-01-01'), title='Start trading interval')
till        = input(timestamp('2030-01-01'), title='End trading interval')

length      = input(30, title='Length')

longs_on    = input.bool(true, title='Longs')
shorts_on   = input.bool(true, title='Shorts')

// Parameters for best performance 2018 - 2022
// long_entry  = input.float(0.26, step=0.01, title='Long entry threshold')
// long_exit   = input.float(-0.10, step=0.01, title='Long exit threshold')
// short_entry = input.float(-0.24, step=0.01, title='Short entry threshold')
// short_exit  = input.float(-0.04, step=0.01, title='Short exit threshold')

long_entry  = input.float(0.25, step=0.01, title='Long entry threshold')
long_exit   = input.float(-0.10, step=0.01, title='Long exit threshold')
short_entry = input.float(-0.25, step=0.01, title='Short entry threshold')
short_exit  = input.float(-0.05, step=0.01, title='Short exit threshold')

stop_loss   = input.float(10, step=1, title='Stop loss (percentage)') / 100

// Trend Confidence

linreg = ta.linreg(source, length, 0)
linreg_p = ta.linreg(source, length, 0+1)

x = bar_index
slope = linreg - linreg_p
intercept = linreg - x*slope
deviationSum = 0.0
for i = 0 to length-1
    deviationSum := deviationSum + math.pow(source[i]-(slope*(x-i)+intercept), 2)
deviation = math.sqrt(deviationSum/(length))

slope_perc = slope / source[0]
deviation_perc = deviation / source[0]
trend_confidence = slope_perc / deviation_perc

// Strategy

in_interval = true

sl_long = strategy.position_avg_price * (1 - stop_loss)
sl_short = strategy.position_avg_price * (1 + stop_loss)

if in_interval and longs_on and ta.crossover(trend_confidence, long_entry)
    strategy.entry("TC Long Entry", strategy.long)
    strategy.exit("TC Long Exit", stop=sl_long)
if in_interval and longs_on and ta.crossunder(trend_confidence, long_exit)
    strategy.close("TC Long Entry")

if in_interval and shorts_on and ta.crossunder(trend_confidence, short_entry)
    strategy.entry("TC Short Entry", strategy.short)
    strategy.exit("TC Short Exit", stop=sl_short)
if in_interval and shorts_on and ta.crossover(trend_confidence, short_exit)
    strategy.close("TC Short Entry")

// Plots

plot(trend_confidence, "Trend Confidence", color.rgb(255, 255, 255))

plot(long_entry, "", color.rgb(0, 255, 0), linewidth=1)
plot(long_exit, "", color.rgb(255, 0, 0), linewidth=1)
plot(short_entry, "", color=bar_index % 10 == 0 ? color.rgb(0, 255, 0) : #00000000, linewidth=1)
plot(short_exit, "", color=bar_index % 10 == 0 ? color.rgb(255, 0, 0) : #00000000, linewidth=1)
Detail
https://www.fmz.com/strategy/432898
Last Modified
2023-11-22 15:50:07