
7.5 KiB
Name
基于自适应波动性的有限体积要素策略Adaptive-Volatility-Finite-Volume-Elements-Strategy
Author
ChaoZhang
Strategy Description
[trans]
概述
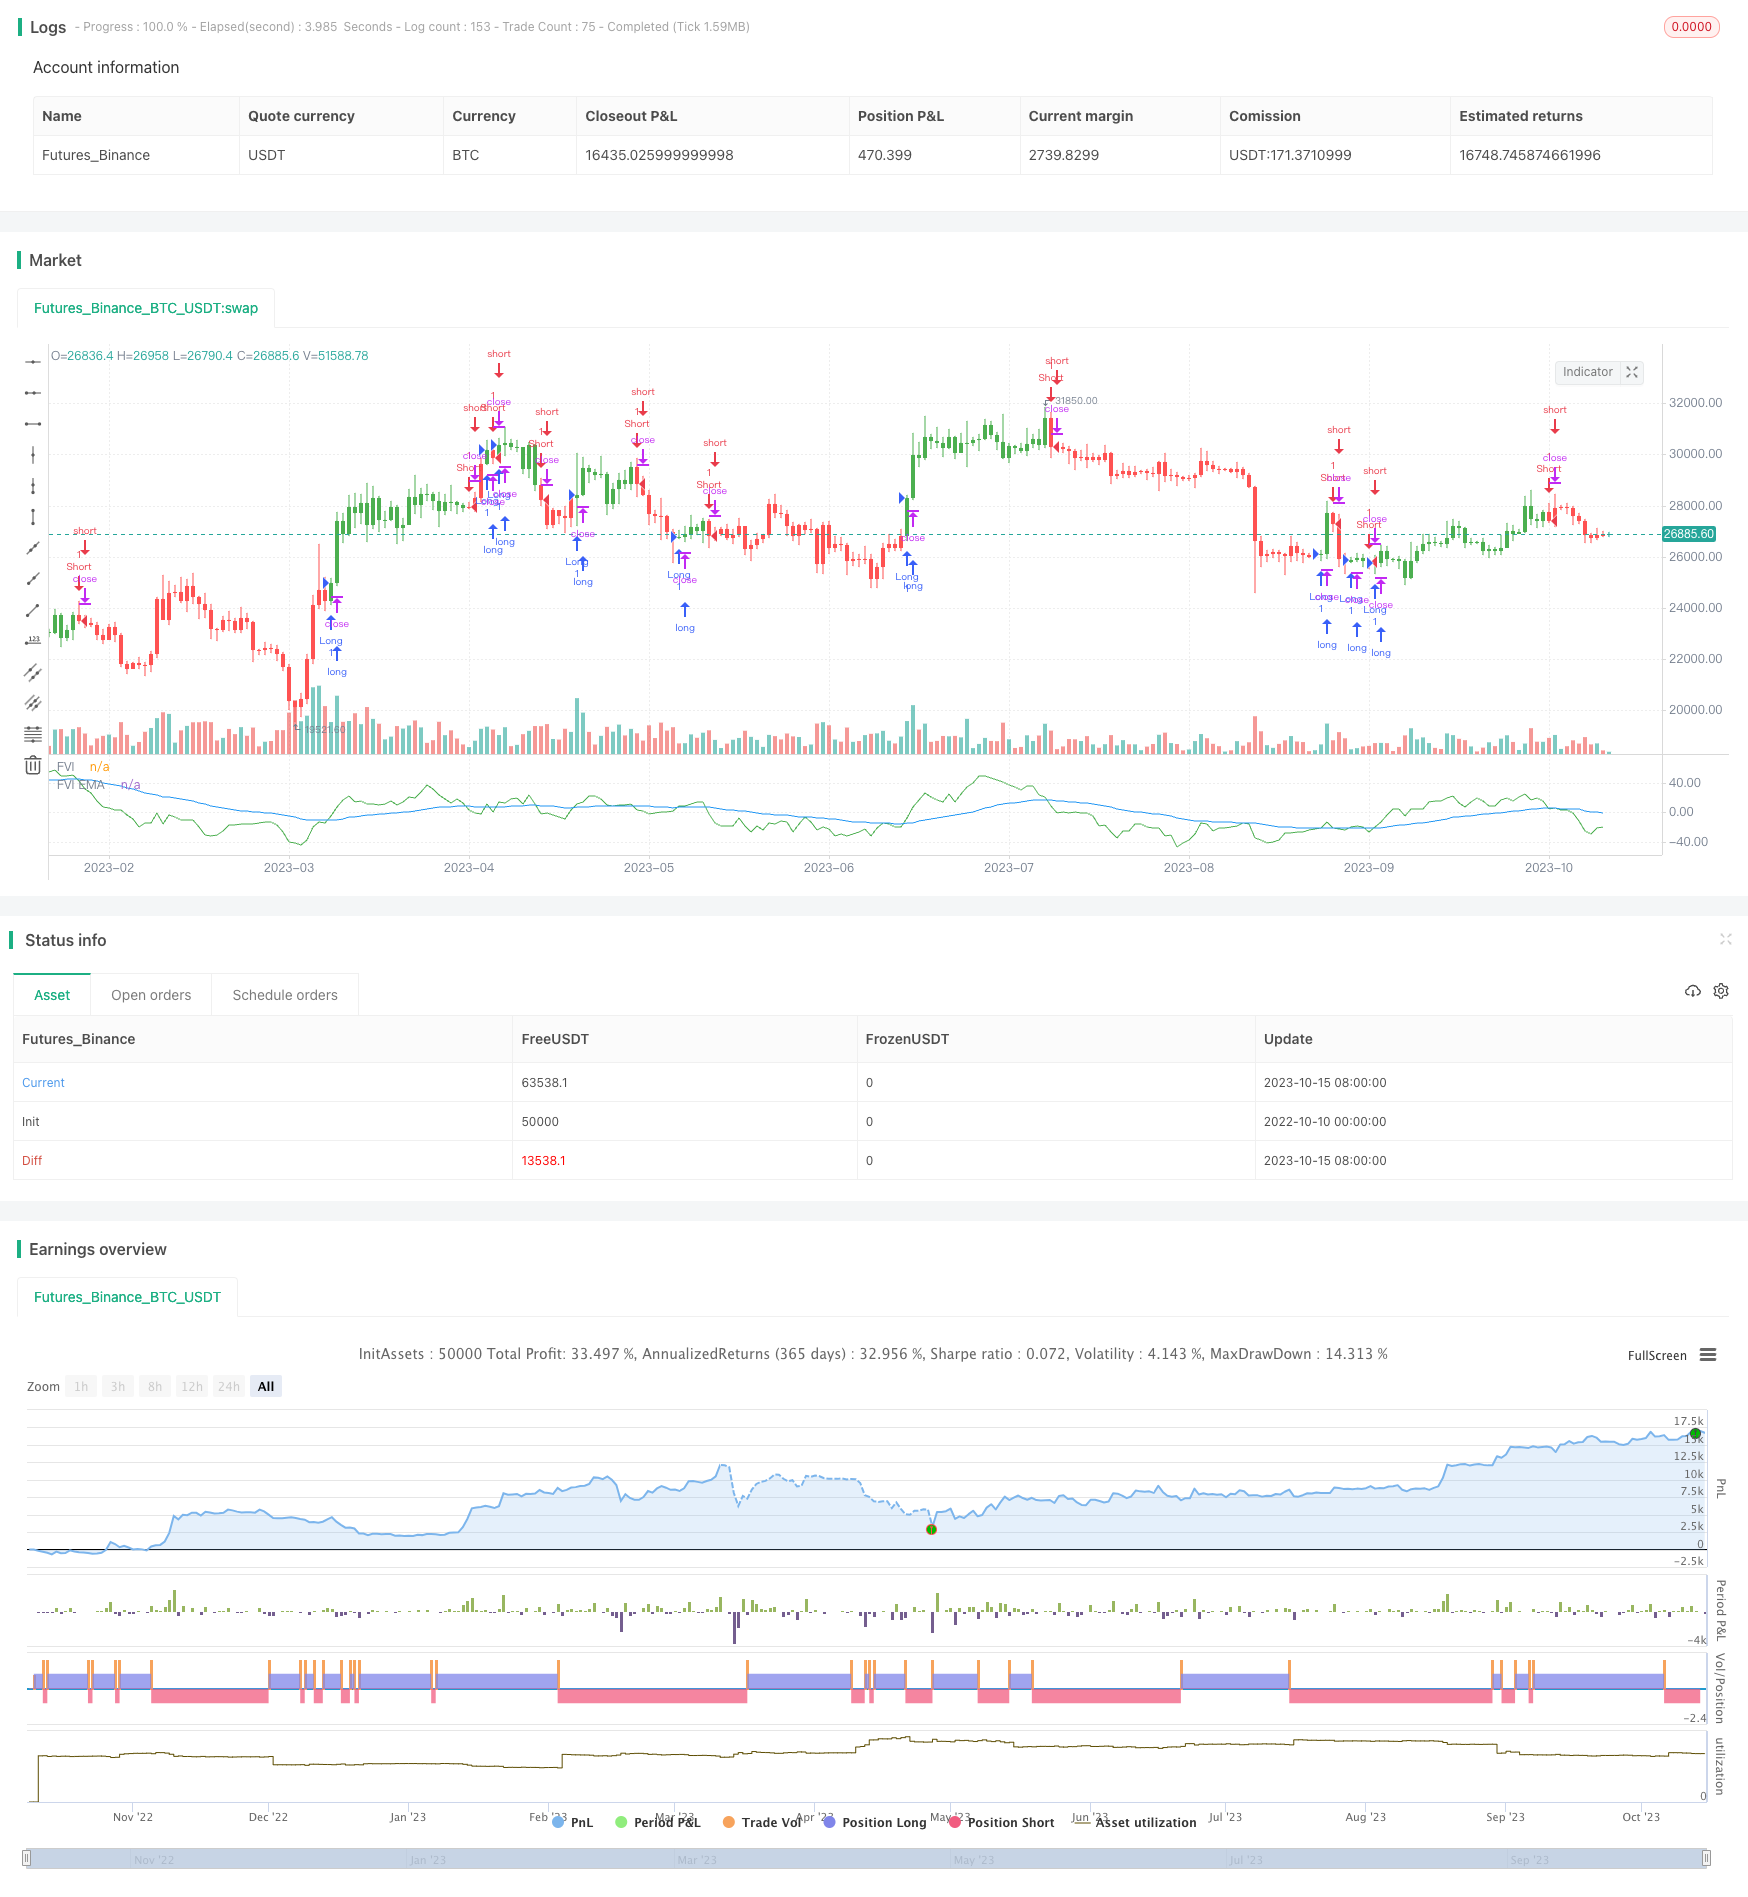
本策略利用有限体积要素方法,结合自适应波动性计量,对价格变化进行多空判断,属于趋势跟踪类策略。策略适用于各个时间周期,能够自动调整参数,适应不同波动性水平。
原理
策略先计算最近N根K线的高低平均价、收盘价平均价,以及前一根K线的高低收盘价平均价。然后计算当前K线和前一K线的对数收益率 Intra 和 Inter。同时计算 Intra 和 Inter 的波动性 Vintra 和 Vinter。
根据波动性水平和可调参数,计算自适应截断系数 CutOff。当价格变化超过 CutOff 时,给出多空信号。具体来说,计算当前K线收盘价与高低平均价的差值 MF,当 MF 大于 CutOff 时为多头信号,当 MF 小于负的 CutOff 时为空头信号。
最后根据信号计算资金流向, outputs 信号 pos,并画出有限体积要素曲线 FVE。
优势
- 自适应参数,适用于不同周期和波动性水平,无需人为调整。
- 准确捕捉价格趋势变化。
- 有限体积要素曲线清晰反映多空力量对比。
- 资金流理论基础稳固,信号比较可靠。
风险
- 市场剧烈震荡时,可能出现较多错误信号。可以适当调整 N 参数。
- 无法处理价格跳空。可以考虑补充其他指标进行组合。
- 资金流理论与技术分析信号可能存在背离。可以考虑多种信号综合判断。
优化方向
- 可以测试不同 N 参数对结果的影响。一般 N 取较大值,能够过滤掉过多噪声。
- 可以测试 Cintra 和 Cinter 的不同取值,找到最佳参数组合。也可以考虑动态调整这两个参数。
- 可以考虑与其他指标如 MACD 等组合,提高策略稳定性。
- 可以建立止损机制,以控制单笔损失。
总结
本策略整体来说较为可靠,原理优良,可以作为趋势跟踪策略的组成部分,与其他策略适当组合后效果会更好。关键是找到最佳参数,并建立良好的风控措施。如果后期能够继续优化,会成为非常强大的趋势跟踪策略。
||
Overview
This strategy utilizes the finite volume element method combined with adaptive volatility metrics to determine long and short signals, belonging to the trend following strategies. It is applicable to all timeframes and can automatically adjust parameters to adapt to different volatility levels.
Principles
The strategy first calculates the average of high and low prices, average of close prices of recent N bars, and average high, low and close prices of the previous bar. Then it computes the logarithmic returns Intra and Inter for the current and previous bar. Meanwhile, it calculates the volatilities Vintra and Vinter of Intra and Inter.
Based on the volatility levels and adjustable parameters, the adaptive cutoff coefficient CutOff is determined. When price change exceeds the CutOff, long or short signals are generated. Specifically, it calculates the difference MF between current close price and average of high & low prices. When MF is greater than CutOff, it's a long signal. When MF is less than negative CutOff, it's a short signal.
Finally according to the signals, fund flows are calculated, outputting the position signal pos, and plotting the Finite Volume Element curve FVE.
Advantages
-
Adaptive parameters, applicable to different timeframes and volatility levels without manual adjustment.
-
Accurately captures trend changes of the prices.
-
The FVE curve clearly reflects the comparison of long and short forces.
-
Solid theoretical basis of fund flow analysis, relatively reliable signals.
Risks
-
May generate more false signals during violent market fluctuation. Can adjust N accordingly.
-
Unable to handle price gaps. Can consider combining other indicators.
-
Fund flow signals may diverge from technical analysis sometimes. Can combine multiple signals.
Optimization
-
Can test the impact of different N values. Generally larger N can filter out noise.
-
Can test different combinations of Cintra and Cinter to find optimal parameters. Or consider adapting them dynamically.
-
Can combine with other indicators like MACD to improve robustness.
-
Can build in stop loss mechanisms to control single trade loss.
Conclusion
Overall this strategy is quite reliable with solid principles. It can serve as a component of trend following strategies, and work even better when combined properly with others. The key is to find optimal parameters and establish sound risk management. If further optimized, it can become a very powerful trend following system.
[/trans]
Strategy Arguments
| Argument | Default | Description |
|---|---|---|
| v_input_1 | 22 | Samples |
| v_input_2 | 40 | Perma |
| v_input_3 | 0.1 | Cintra |
| v_input_4 | 0.1 | Cinter |
| v_input_5 | false | Trade reverse |
Source (PineScript)
/*backtest
start: 2022-10-10 00:00:00
end: 2023-10-16 00:00:00
period: 1d
basePeriod: 1h
exchanges: [{"eid":"Futures_Binance","currency":"BTC_USDT"}]
*/

//@version=2
////////////////////////////////////////////////////////////
//  Copyright by HPotter v1.0 18/08/2017
// This is another version of FVE indicator that we have posted earlier
// in this forum.
// This version has an important enhancement to the previous one that`s
// especially useful with intraday minute charts.
// Due to the volatility had not been taken into account to avoid the extra
// complication in the formula, the previous formula has some drawbacks:
// The main drawback is that the constant cutoff coefficient will overestimate
// price changes in minute charts and underestimate corresponding changes in
// weekly or monthly charts.
// And now the indicator uses adaptive cutoff coefficient which will adjust to
// all time frames automatically.
//
// You can change long to short in the Input Settings
// Please, use it only for learning or paper trading. Do not for real trading.
////////////////////////////////////////////////////////////
strategy(title="Volatility Finite Volume Elements", shorttitle="FVI")
Samples = input(22, minval=1)
Perma = input(40, minval=1)
Cintra = input(0.1, step=0.1)
Cinter = input(0.1, step=0.1)
reverse = input(false, title="Trade reverse")
xhl2 = hl2
xhlc3 = hlc3
xClose = close
xIntra = log(high) - log(low)
xInter = log(xhlc3) - log(xhlc3[1])
xStDevIntra = stdev(sma(xIntra, Samples) , Samples)
xStDevInter = stdev(sma(xInter, Samples) , Samples)
xVolume = volume
TP = xhlc3
TP1 = xhlc3[1]
Intra = xIntra
Vintra = xStDevIntra
Inter = xInter
Vinter = xStDevInter
CutOff = Cintra * Vintra + Cinter * Vinter
MF = xClose - xhl2 + TP - TP1
FveFactor = iff(MF > CutOff * xClose, 1,
             iff(MF < -1 * CutOff * xClose, -1,  0))
xVolumePlusMinus = xVolume * FveFactor
Fvesum = sum(xVolumePlusMinus, Samples)
VolSum = sum(xVolume, Samples)
xFVE = (Fvesum / VolSum) * 100
xEMAFVE = ema(xFVE, Perma)
pos = iff(xFVE > xEMAFVE, 1,
	   iff(xFVE < xEMAFVE, -1, nz(pos[1], 0)))
possig = iff(reverse and pos == 1, -1,
          iff(reverse and pos == -1, 1, pos))
if (possig == 1)
    strategy.entry("Long", strategy.long)
if (possig == -1)
    strategy.entry("Short", strategy.short)
barcolor(possig == -1 ? red: possig == 1 ? green : blue )
plot(xFVE, color=green, title="FVI")
plot(xEMAFVE, color=blue, title="FVI EMA")
Detail
https://www.fmz.com/strategy/429476
Last Modified
2023-10-17 14:50:13