
6.5 KiB
Name
基于相对强弱指标动量轮回策略RSI-Crossover-Momentum-Cyclical-Strategy
Author
ChaoZhang
Strategy Description
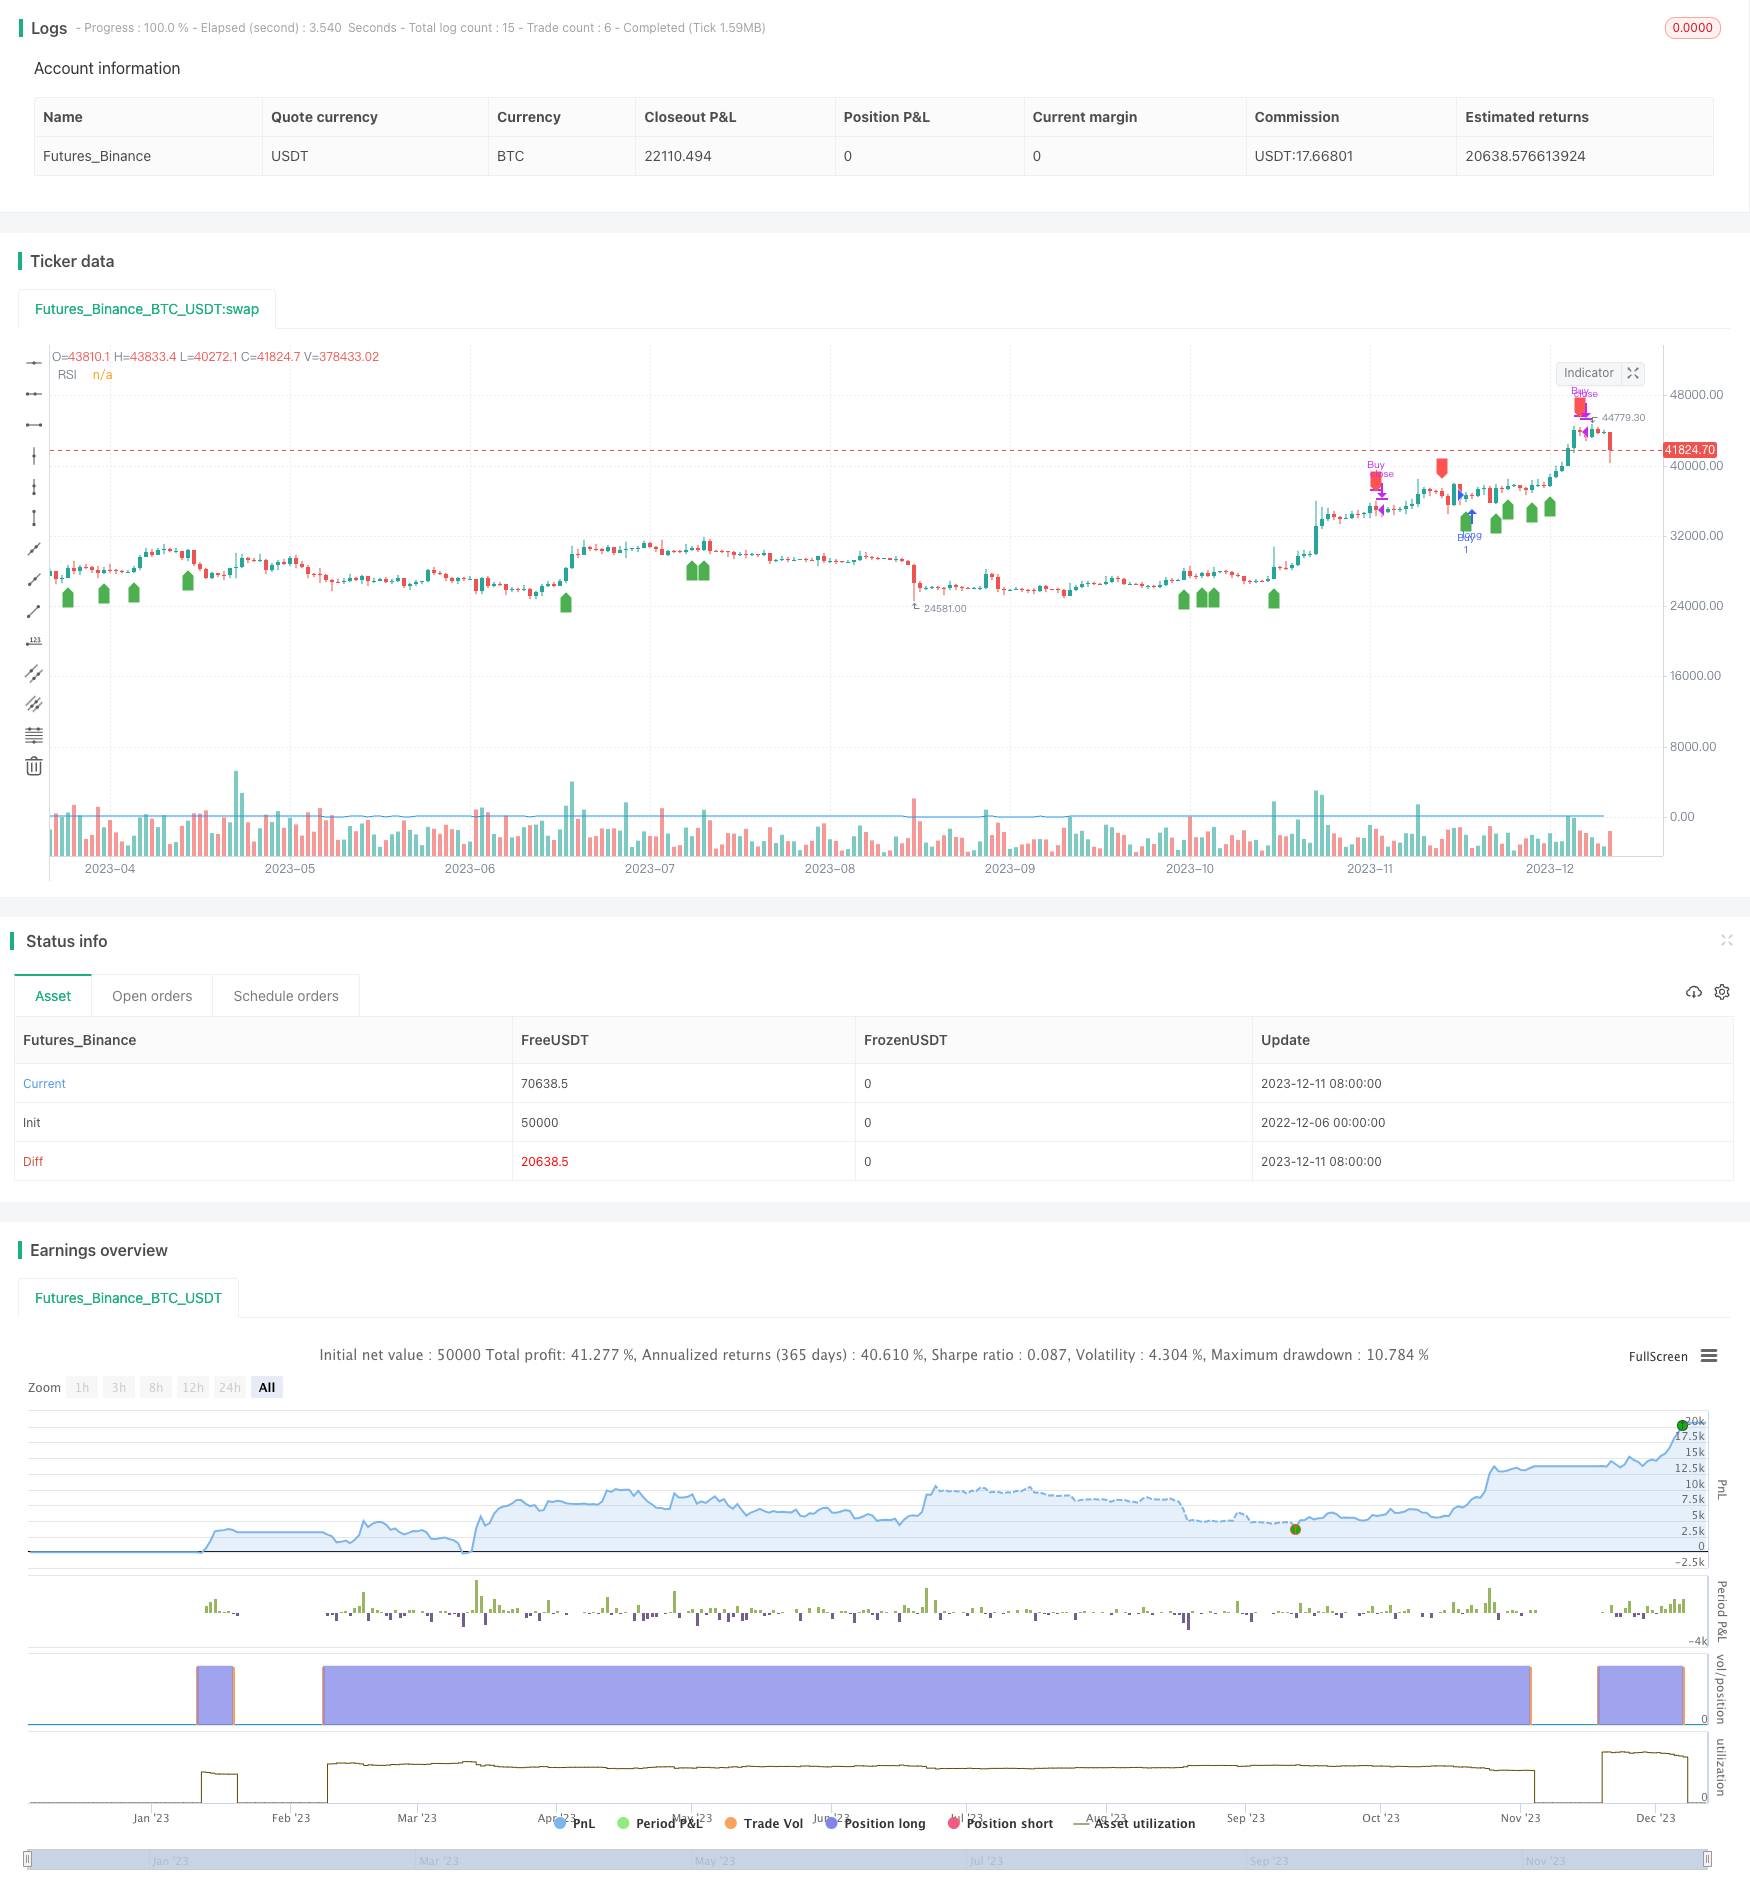 [trans]
概述
动量轮回策略是一种基于相对强弱指标(RSI)的量化交易策略。该策略通过RSI指标交叉发出买卖信号,实现获利。当RSI上穿用户设定的阈值时产生买入信号; 当RSI下穿阈值时产生卖出信号,实施逐步获利。
策略原理
该策略基于RSI指标定制。RSI指标反映股票的市场动量和超买超卖情况。该策略首先计算RSI值,然后根据RSI与设定买入阈值和卖出阈值的关系进行交易。
具体来说,如果RSI上穿设定的买入阈值(默认60),则产生买入信号。策略此时会开仓买入股票。如果之后RSI下穿设定的卖出阈值(默认80),则产生卖出信号。策略此时会平掉之前的多仓。如此,通过RSI阈值之间的交叉运行,实现获利回撤的动量轮回。
该策略使用Pine Script语言编写,代码结构清晰。使用现代化的条件判断结构实现策略入场和出场逻辑。同时绘制RSI指标曲线,并在买卖点标记信号。
策略优势
- 利用股票价格动量特征,能够有效捕捉市场短期趋势
- RSI指标参数可调,对市场变化敏感
- 采用现代编程风格,代码清晰简洁
- 直观显示RSI曲线和买卖点,便于查看策略运行情况
- 可自定义RSI参数及买入卖出阈值,适应个性化需求
策略风险
- 短期操作风险大,需要密切关注市场变化
- 可能出现虚假信号,RSI指标发出错误信号的概率存在
- 匆忙入场有追高杀跌风险,应审慎操作
- 未考虑止损机制,无法有效控制单笔损失
针对上述风险,我们可以设置止损线,优化RSI参数,结合其他指标进行滤波等方法进行改进。
策略优化方向
我们可以从以下几个方面继续优化该策略:
- 结合移动平均线等指标构建过滤机制,减少虚假信号
- 添加止损逻辑,控制单笔损失
- 优化RSI参数,identifying适合的股票和市场环境
- 开发能够动态调整参数的自适应交易系统
- 测试不同的持仓时间,寻找最优策略参数组合
总结
本策略作为一个基础示例,展示了如何利用RSI指标进行量化交易。我们可以在此基础上进行扩展,结合更多指标和风控手段来建立交易体系。在实际运用时,需要对参数进行反复优化测试,并结合个人风险偏好进行调整。采用严谨的方法论和风控体系,本策略可以成为有效的量化投资工具。
||
Overview
The RSI Crossover Momentum Cyclical strategy is a quantitative trading strategy based on the Relative Strength Index (RSI) indicator. It generates buy and sell signals through RSI crossovers to achieve profitable trades. Buy signals are triggered when the RSI crosses above a user-defined threshold, while sell signals are triggered when the RSI falls below the threshold, closing positions gradually at a profit.
Strategy Logic
The strategy is built upon the RSI indicator, which gauges a stock's momentum and overbought/oversold levels. It first calculates RSI values, then trades based on the relationship between the RSI and preset buy/sell thresholds.
Specifically, when the RSI crosses above the buy threshold (default 60), a buy signal is generated. The strategy would then open a long position. Later when the RSI falls below the sell threshold (default 80), a sell signal occurs. The strategy would close the existing long position accordingly. By oscillating between the two thresholds, the momentum cycles back and forth to book profits.
The strategy is written in Pine Script using clear conditional logic for entries and exits. The RSI line is plotted with markers for buy/sell signals.
Advantages
- Captures short-term trends effectively using price momentum
- Customizable RSI parameters adaptive to market changes
- Clean modern code style, easy to understand
- Intuitive visualization of RSI curve and trade signals
- Customizable thresholds catering to personal needs
Risks
- Higher risks in short-term trading, needing close monitoring
- Potential false signals and RSI divergence
- Overeager entries risking chase trades
- No stop loss mechanism to limit losses
We can set stop loss, optimize RSI parameters, or add filters to improve it.
Enhancement Opportunities
There are a few ways we can further optimize the strategy:
- Add filters like moving averages to reduce false signals
- Incorporate stop loss logic to control losses
- Optimize RSI parameters for different stocks and markets
- Develop adaptive systems that auto-adjust parameters
- Test different holding periods to find optimal combinations
Conclusion
This basic example demonstrates using RSI for quant trading. We can build on it with more indicators and risk management techniques. In practice, rigorous optimization and customization based on personal risk tolerance is needed before application. With sound methodology, this strategy can become an effective quantitative investment tool.
[/trans]
Strategy Arguments
| Argument | Default | Description |
|---|---|---|
| v_input_int_1 | 14 | RSI Period |
| v_input_1 | 60 | RSI Threshold for Buy |
| v_input_2 | 80 | RSI Threshold for Sell |
Source (PineScript)
/*backtest
start: 2022-12-06 00:00:00
end: 2023-12-12 00:00:00
period: 1d
basePeriod: 1h
exchanges: [{"eid":"Futures_Binance","currency":"BTC_USDT"}]
*/

//@version=5
strategy("RSI Cross 60/80 Strategy", overlay=true)

// Input for RSI period
rsiPeriod = input.int(14, title="RSI Period", minval=1)

// Calculate RSI
rsiValue = ta.rsi(close, rsiPeriod)

// Input for RSI thresholds
rsiBuyThreshold = input(60, title="RSI Threshold for Buy")
rsiSellThreshold = input(80, title="RSI Threshold for Sell")

// Conditions for Buy and Sell signals
buySignal = ta.crossover(rsiValue, rsiBuyThreshold)
sellSignal = ta.crossunder(rsiValue, rsiSellThreshold)

// Plot RSI on the chart
plot(rsiValue, title="RSI", color=color.blue)

// Strategy entry and exit
if (buySignal)
    strategy.entry("Buy", strategy.long)

if (sellSignal)
    strategy.close("Buy")

// Plot Buy and Sell signals on the chart
plotshape(series=buySignal, title="Buy Signal", color=color.green, style=shape.labelup, location=location.belowbar)
plotshape(series=sellSignal, title="Sell Signal", color=color.red, style=shape.labeldown, location=location.abovebar)
Detail
https://www.fmz.com/strategy/435251
Last Modified
2023-12-13 15:41:33