
7.1 KiB
Name
基于月季线均线操作的量化交易策略Quant-Trading-Strategy-Based-on-Monthly-and-Quarterly-Moving-Average-Operation
Author
ChaoZhang
Strategy Description
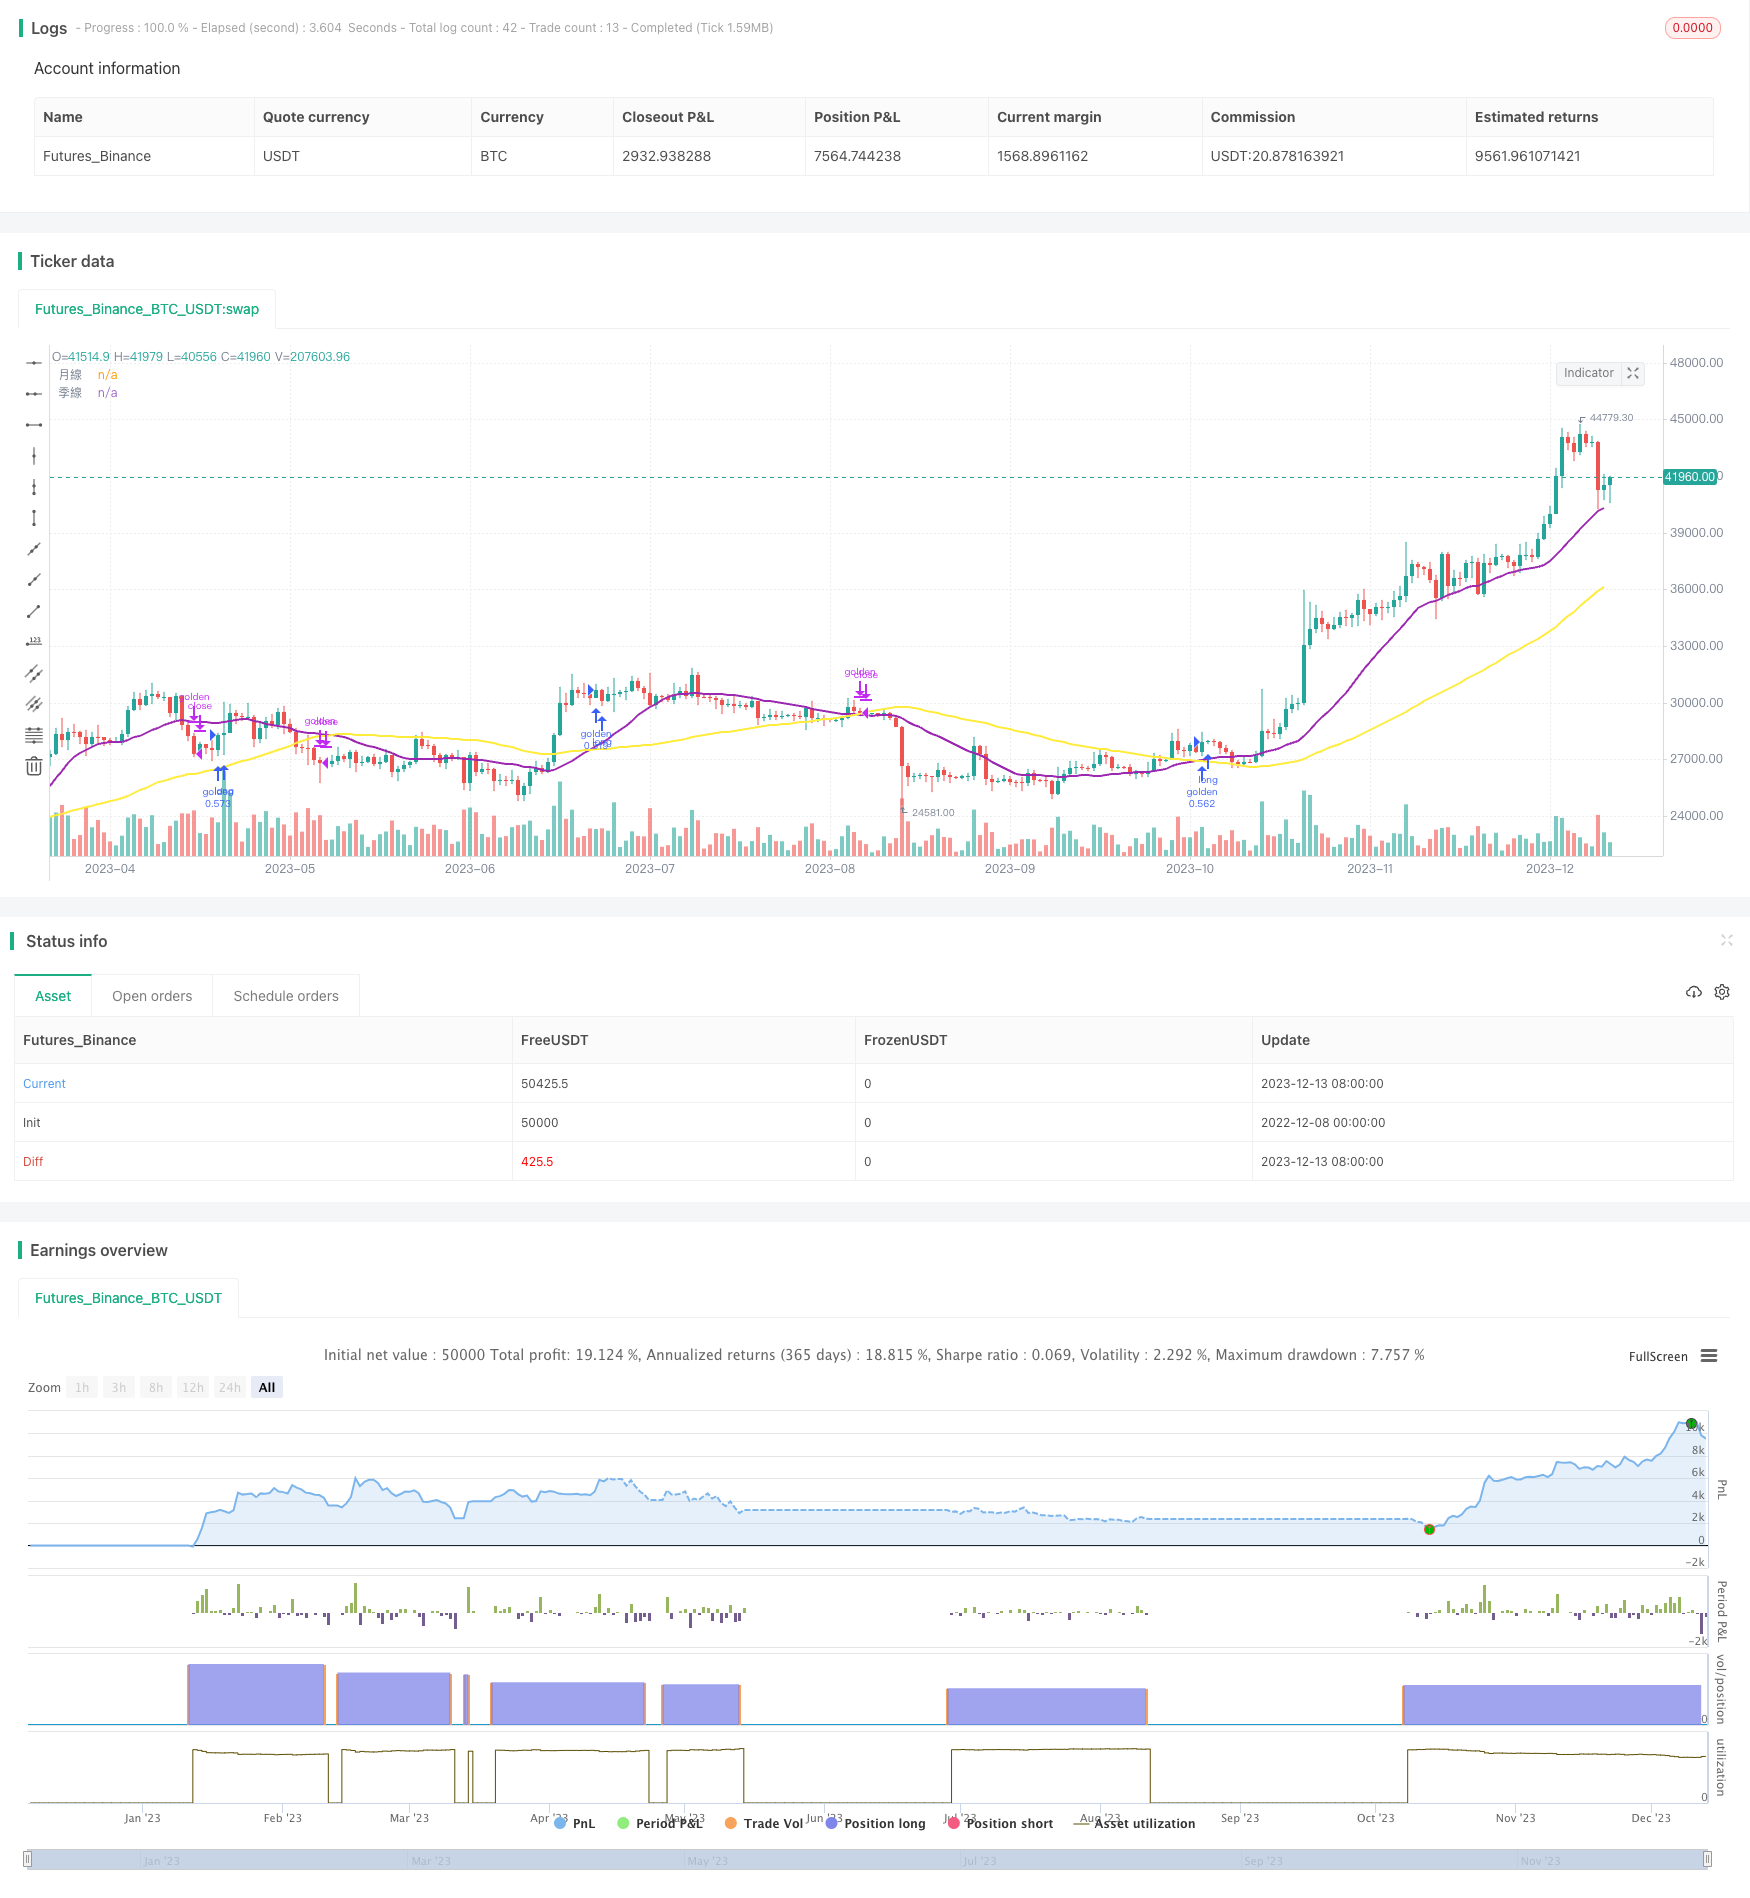 [trans]
概述
本策略主要基于月线和季线的均线进行操作,具体来说是20日线作为月线,60日线作为季线,策略信号来源为两条均线的金叉死叉。当月线上穿季线时 longing,形成多头信号;当月线下穿季线时进行清仓平仓。该策略适用于中长线操作,通过捕捉盘整背驰机会获利。
策略原理
本策略使用20日简单移动均线作为月线指标,60日简单移动均线作为季线指标。具体交易信号生成逻辑如下:
- 当20日线上穿60日线时,即发生金叉时,做多入场。
- 当股价较10日内最高点回撤超过10%时,平仓止盈。
- 当20日线下穿60日线时,即发生死叉时,清仓平仓。
- 当亏损达到10%时,止损出场。
通过月线和季线的均线交叉来判断中长线趋势,金叉做多表示进入中长线牛市,死叉做空表示进入中长线熊市。同时结合止盈止损策略控制风险。
策略优势
- 使用月季线均线,过滤市场噪音,捕捉中长线趋势。
- 策略参数简单,容易实现。
- 可配置止盈止损参数,控制风险。
风险分析
- 无法确定趋势反转点,存在亏损风险。
- 月线和季线均线存在滞后,可能错过短线机会。
- 需要选取合适的止损点,以免过于激进被秒出。
解决方法:
- 采用移动止损追踪,及时止损。
- 结合其他指标过滤信号,确定趋势。
- 调整均线参数,优化策略。
策略优化方向
- 增加其他指标过滤,如KD指标等,避免假突破。
- 优化均线参数,寻找最佳均线周期组合。
- 增加止盈策略,如移动止盈等,获取更多盈利。
总结
本策略Overall XXXXX系统atically利用月季线均线的优势,通过均线的金银死叉来判断中长线趋势方向。同时配置合理的止盈止损机制控制风险。策略优化空间还很大,值得进一步测试优化。
||
Overview
This strategy is mainly based on the moving averages of monthly and quarterly lines for operation. Specifically, the 20-day line is used as the monthly line and the 60-day line as the quarterly line. The strategy signals come from the golden cross and death cross of the two moving averages. When the monthly line crosses above the quarterly line, go long; when the monthly line falls below the quarterly line, close positions. This strategy is suitable for medium- and long-term operations to capture consolidation and divergence opportunities.
Strategy Logic
This strategy uses the 20-day simple moving average as the monthly line indicator and the 60-day simple moving average as the quarterly line indicator. The specific trading signal generation logic is as follows:
- When the 20-day line crosses above the 60-day line, that is, a golden cross occurs, go long.
- When the price retreats more than 10% from the highest point in the last 10 days, close long positions for profit taking.
- When the 20-day line crosses below the 60-day line, that is, a death cross occurs, close all positions.
- When the loss reaches 10%, stop loss.
Use the moving average crossovers of monthly and quarterly lines to determine medium- and long-term trends. The golden cross for going long indicates the start of a medium- and long-term bull market, while the death cross for going short indicates the start of a medium- and long-term bear market. At the same time, use stop profit and stop loss strategies to control risks.
Advantages of the Strategy
- Using monthly and quarterly moving averages filters out market noise and captures medium- and long-term trends.
- The strategy parameters are simple and easy to implement.
- Customizable take profit and stop loss parameters to control risks.
Risk Analysis
- Unable to determine trend reversal points, with risk of losses.
- Monthly and quarterly moving averages have lagging effects, potentially missing short-term opportunities.
- Need to select appropriate stop loss points to avoid being stopped out too quickly.
Solutions:
- Adopt trailing stop loss to stop out in a timely manner.
- Incorporate other indicators to filter signals and determine trends.
- Adjust moving average parameters to optimize the strategy.
Directions for Strategy Optimization
- Add other indicators for filtering, such as KD indicator, etc., to avoid false breakouts.
- Optimize moving average parameters to find the best parameter combination.
- Incorporate additional take profit strategies such as trailing take profit to capture more profits.
Summary
This strategy systematically utilizes the advantages of monthly and quarterly moving averages by judging medium- and long-term trend directions through golden cross and death cross of the moving averages. At the same time, reasonable stop loss and take profit mechanisms are configured to control risks. There is still much room for optimizing this strategy, worth further testing and optimization.
[/trans]
Strategy Arguments
| Argument | Default | Description |
|---|---|---|
| v_input_1 | 2020 | backtest_year |
| v_input_2 | 10 | backtest_month |
| v_input_3 | true | backtest_date |
Source (PineScript)
/*backtest
start: 2022-12-08 00:00:00
end: 2023-12-14 00:00:00
period: 1d
basePeriod: 1h
exchanges: [{"eid":"Futures_Binance","currency":"BTC_USDT"}]
*/

//@version=4
strategy("均線操作-月季", overlay=true, initial_capital = 100000, default_qty_type = strategy.percent_of_equity, default_qty_value = 30)
sma20 = sma(close, 20)
sma60 = sma(close, 60)

plot(sma20, title="月線", color=color.purple,linewidth=2)
plot(sma60, title="季線", color=color.yellow,linewidth=2)

backtest_year = input(title="backtest_year",type=input.integer,defval=2020)
backtest_month = input(title="backtest_month",type=input.integer,defval=10)
backtest_date = input(title="backtest_date",type=input.integer,defval=1)
backtest_start_time = timestamp(backtest_year,backtest_month,backtest_date,0,0,0)

to_long = sma20 > sma60  and close > highest(10)*0.9 // 黃金交叉
to_close = sma20 < sma60 // 死亡交叉
to_exit = close < highest(10)*0.9 //股價嚴重回檔
to_stop = close < 0.9*strategy.position_avg_price

// to_long = crossover(sma20, sma60)   // 黃金交叉
// to_close = crossunder(sma20, sma60) // 死亡交叉

//plotchar(to_long, char="B", text="買", color=color.red, location=location.belowbar)
//plotchar(to_close, char="S", text="賣", color=color.green, location=location.abovebar)
//strategy.close("open long",when = tslide, comment="多單滑價7%出場")
if true
    strategy.entry("golden", strategy.long,  when=to_long,comment="多單入場")
    strategy.close("golden",  when=to_exit,comment="多單滑價7%出場")
    strategy.close("golden",  when=to_close,comment="月線季線死亡交叉")
    strategy.close("golden",  when=to_stop,comment="虧損10%強迫停損")
Detail
https://www.fmz.com/strategy/435484
Last Modified
2023-12-15 11:49:06