
20 KiB
Name
基于支点反转的量化交易策略Pivot-Reversal-Based-Quantitative-Trading-Strategy
Author
ChaoZhang
Strategy Description
 [trans]
概述
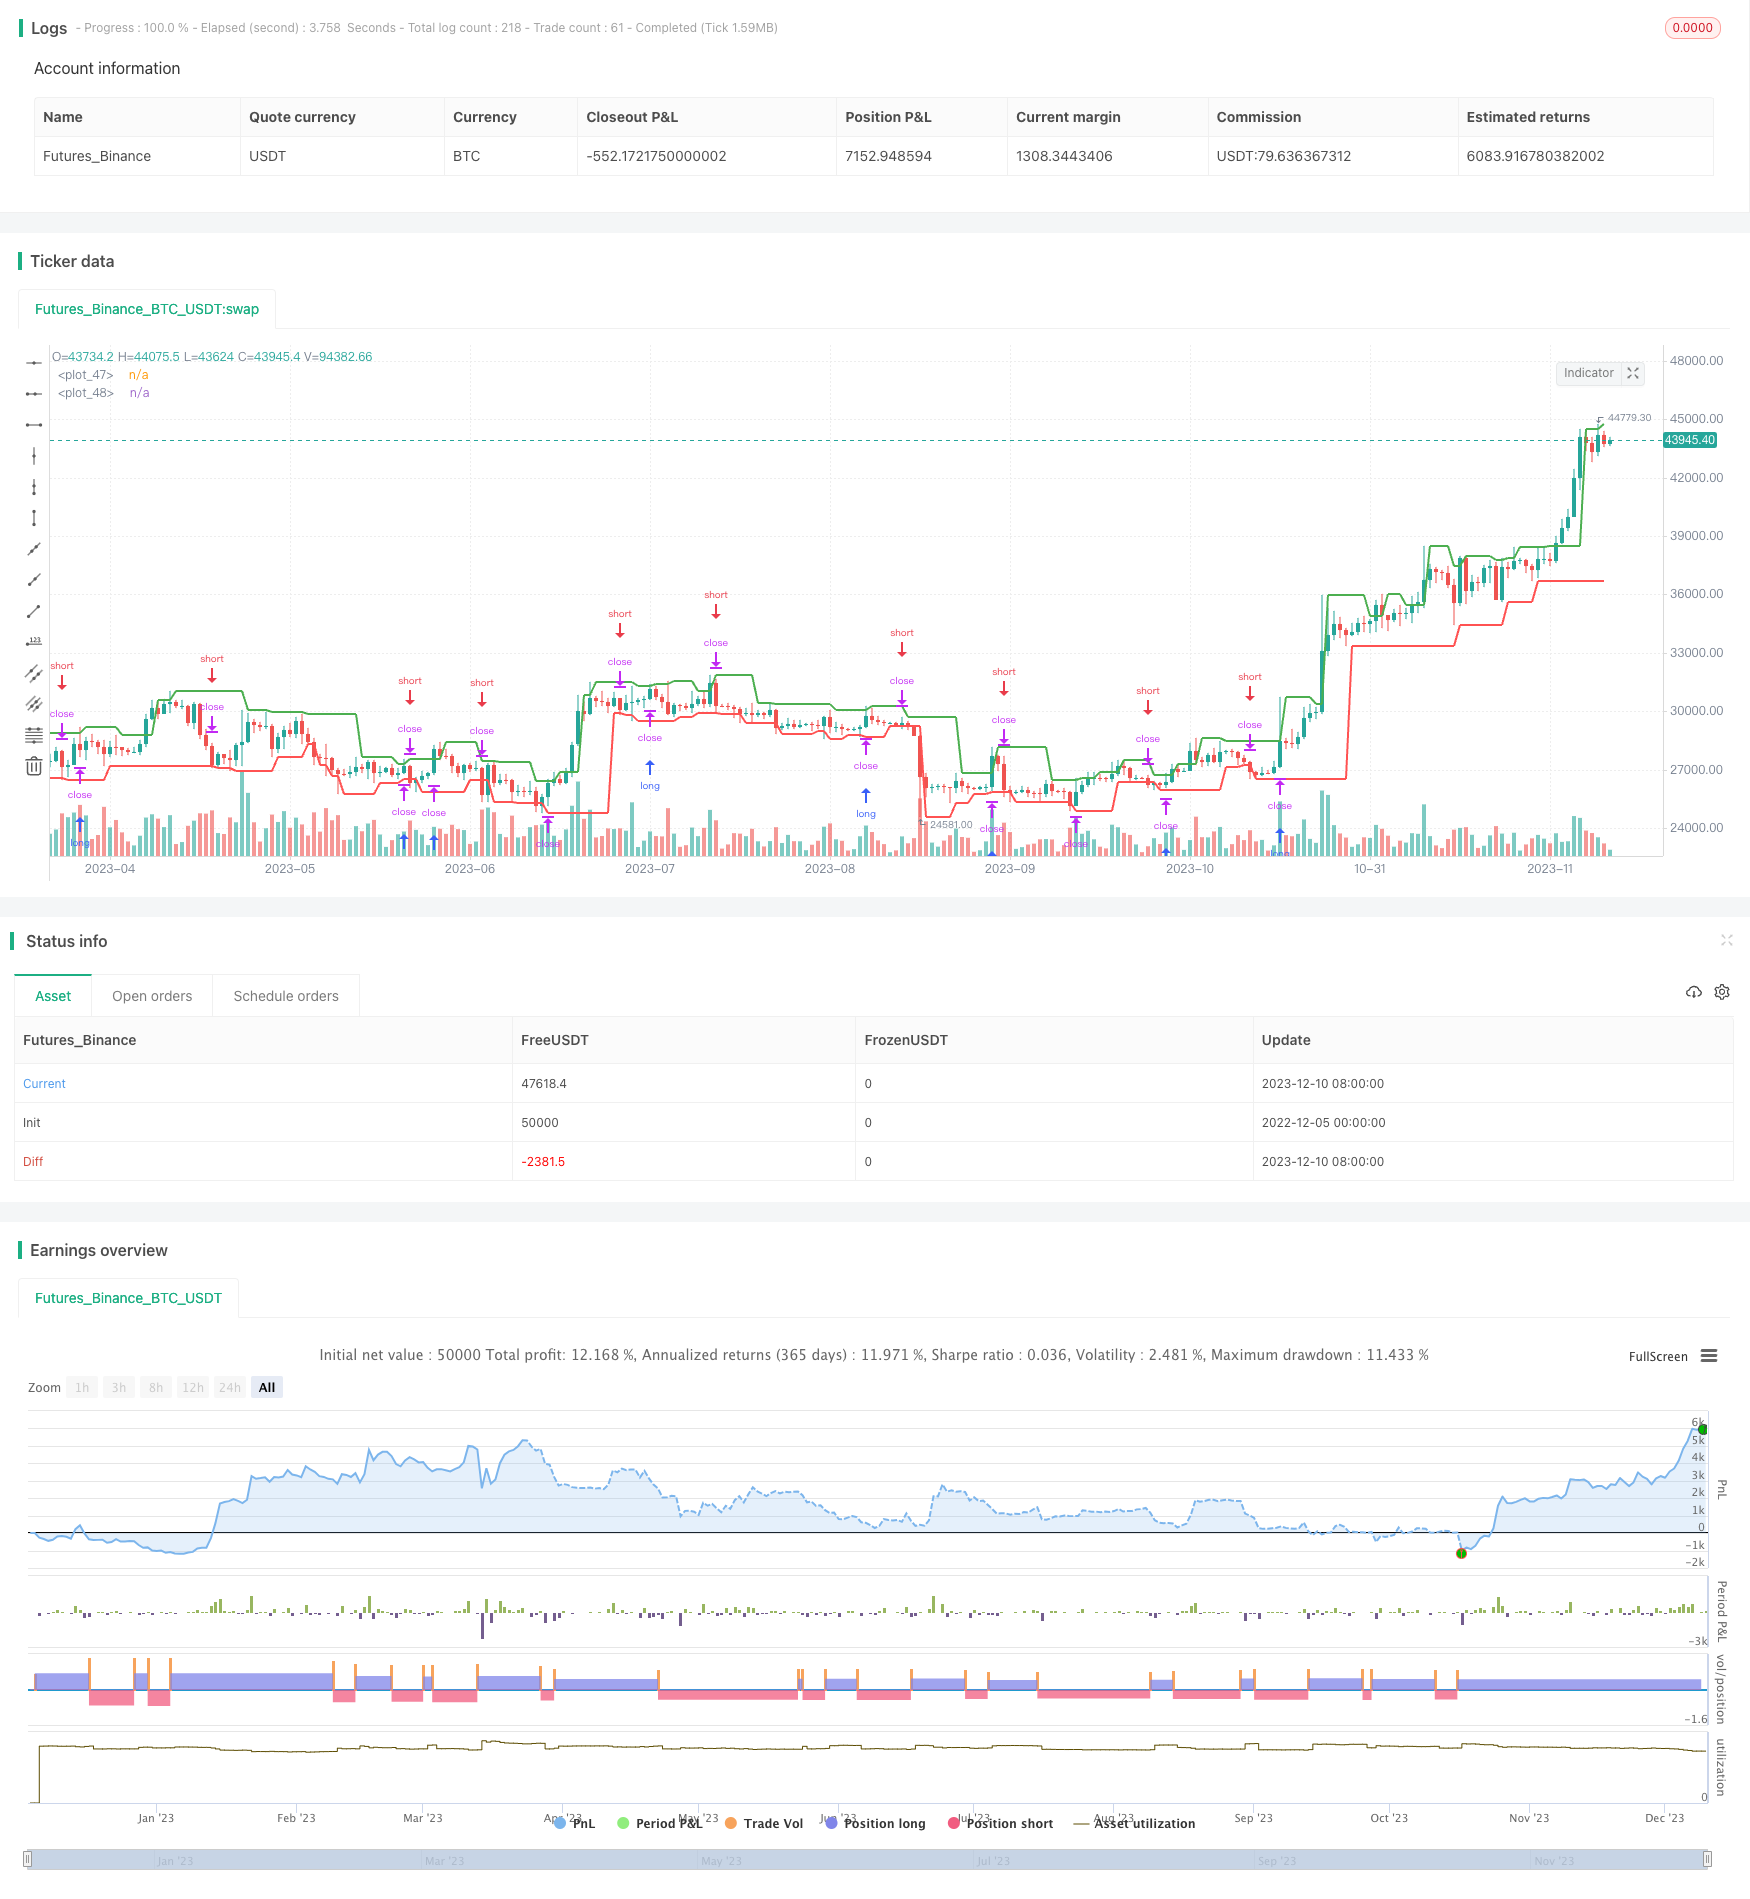
这是一个利用支点作为入场信号的量化交易策略。它会计算出上升支点和下降支点,一旦价格突破这些支点,就会启动长仓或短仓。
策略原理
该策略主要基于支点反转理论。它会首先计算出左侧N根K线和右侧M根K线的支点。然后实时监控价格是否突破这些支点。
当价格突破上升支点时,说明ranchang力量已经不足以继续推高价格,这时做空可以获得较好收益。当价格突破下降支点时,说明空头力量已耗尽,此时做多可以获得较好收益。
具体来说,该策略通过ta.pivothigh和ta.pivotlow函数计算出上升支点和下降支点。然后比较当前最高价是否突破上升支点,最低价是否突破下降支点。如果突破,则启动相应的做多做空策略。
此外,该策略还使用止损来控制风险。具体做法是,当价格突破支点后,立即下单,同时设置止损位于支点另一侧,这样可以最大程度避免失败的single导致亏损扩大。
优势分析
这种基于支点反转的策略具有以下几个优势:
- 支点反转信号较为可靠,胜率较高
- 风险控制到位,止损设置合理
- 易于实现,代码简洁
- 适用于不同品种,灵活性较好
风险分析
该策略也存在一些风险需要注意:
- 支点可能发生失效,导致错误信号
- 突破支点后可能出现回调,造成止损被触发
- 交易频率可能较高,交易费用是一种隐性成本
- 效果与品种、参数设置有关,需要调优
为了降低风险,可以考虑以下几点:
- 优化左右侧K线数量,确保支点计算更加可靠
- 适当放宽止损范围,避免止损过密
- 设置最小盈利目标,减少频繁反复交易
- 测试不同品种和参数,找到最佳配置
优化方向
该策略还有进一步优化的空间:
- 结合其他指标判断支点突破的可靠性
- 增加机器学习模型判断价格趋势
- 利用高频数据提升交易信号灵敏度
- 增加仓位管理模块,根据条件动态调整仓位
- 接入详细账户模块,计算真实交易费用
这些优化可以提高策略的胜率、盈利水平、稳定性。
总结
综上所述,这是一个基于支点反转理论的量化交易策略。它利用价格突破支点作为交易信号,同时使用止损机制控制风险。该策略易于实现,适用面广,是一种实用的量化交易策略。但也存在一定的风险,需要进一步测试和优化,在实际使用中找到最佳配置。
||
Overview
This is a quantitative trading strategy that utilizes pivot points as entry signals. It calculates rising pivot points and falling pivot points. Once the price breaks through these pivot points, it will initiate long or short positions.
Strategy Principle
This strategy is mainly based on the pivot reversal theory. It first calculates the pivot points based on the left N bars and right M bars. Then it monitors in real time whether the price breaks through these pivot points.
When the price breaks through the rising pivot point, it means the upward momentum is no longer enough to continue pushing up the price. At this time, going short can yield good returns. When the price breaks through the falling pivot point, it means that the downward momentum has been exhausted. At this time, going long can obtain good returns.
Specifically, this strategy calculates the rising pivot points and falling pivot points through the ta.pivothigh and ta.pivotlow functions. Then it compares whether the current highest price breaks through the rising pivot point and whether the lowest price breaks through the falling pivot point. If there is a breakthrough, the corresponding long or short strategy will be initiated.
In addition, this strategy also uses stop loss to control risks. Specifically, when the price breaks through the pivot point, it immediately places an order while setting the stop loss at the other side of the pivot point. This can minimize the loss caused by a failed signal.
Advantage Analysis
This pivot reversal based strategy has the following advantages:
- The pivot reversal signal is quite reliable with a high winning rate
- The risk is well controlled with reasonable stop loss setting
- It's easy to implement with concise code
- It is applicable to different products with good flexibility
Risk Analysis
This strategy also has some risks to note:
- The pivot points may fail, resulting in incorrect signals
- There could be pullback after breaking the pivot point, causing stop loss triggering
- The trading frequency may be high, incurring implicit trading cost
- The performance relies on product selection and parameter tuning
To reduce risks, the following aspects can be considered:
- Optimize the number of left and right bars to ensure reliable pivot point calculation
- Loose the stop loss to some extent to avoid over-tightness
- Set minimum profit target to reduce frequent round-trip trading
- Test on different products and parameters to find the optimal configuration
Optimization Directions
There is room for further optimization of this strategy:
- Incorporate other indicators to judge the reliability of pivot breakthroughs
- Add machine learning models to determine price trends
- Use high-frequency data to improve signal sensitivity
- Introduce position sizing module to dynamically adjust positions
- Connect detailed account module to calculate real trading cost
These optimizations could improve the win rate, profitability, and stability of the strategy.
Conclusion
In summary, this is a quantitative trading strategy based on the pivot reversal theory. It uses price breakthrough pivot points as trading signals while adopting stop loss to control risks. This strategy is easy to implement and widely applicable, making it a practical quantitative trading strategy. But it also bears some risks and needs further testing and optimization to find the optimal configuration in real trading.
[/trans]
Strategy Arguments
| Argument | Default | Description |
|---|---|---|
| v_input_1 | 2 | (?Pivot Points)leftBars |
| v_input_2 | true | rightBars |
| v_input_3 | true | (?Weekly Table)Return Precision |
| v_input_4 | timestamp(01 Jan 3000 00:00 +0000) | (?Weekhly Table)From Date |
| v_input_color_1 | green | (?Weeky Table)Gradient Colors |
| v_input_color_2 | red | loss_color |
| v_input_bool_1 | true | (?Benchmark)Use current Symbol for Benchmark |
| v_input_5 | BTC_USDT:swap | Benchmark |
| v_input_bool_2 | false | Display Benchmark? |
| v_input_bool_3 | false | Display Alpha? |
Source (PineScript)
/*backtest
start: 2022-12-05 00:00:00
end: 2023-12-11 00:00:00
period: 1d
basePeriod: 1h
exchanges: [{"eid":"Futures_Binance","currency":"BTC_USDT"}]
*/

//@version=5
strategy('Weekly Returns with Benchmark', overlay=true,
     default_qty_type=strategy.percent_of_equity, default_qty_value=25,
     commission_type=strategy.commission.percent, commission_value=0.1)

////////////
// Inputs //

// Pivot points inputs
leftBars   = input(2, group = "Pivot Points")
rightBars  = input(1, group = "Pivot Points")

// Styling inputs
prec       = input(1, title='Return Precision',                            group = "Weekly Table")
from_date  = input(timestamp("01 Jan 3000 00:00 +0000"), "From Date", group = "Weekhly Table")
prof_color = input.color(color.green, title = "Gradient Colors", group = "Weeky Table", inline = "colors")
loss_color = input.color(color.red,   title = "",                group = "Weeky Table", inline = "colors")

// Benchmark inputs
use_cur    = input.bool(true,        title = "Use current Symbol for Benchmark", group = "Benchmark")
symb_bench = input('BTC_USDT:swap', title = "Benchmark",                        group = "Benchmark")
disp_bench = input.bool(false,       title = "Display Benchmark?",               group = "Benchmark")
disp_alpha = input.bool(false,       title = "Display Alpha?",                   group = "Benchmark")

// Pivot Points Strategy
swh = ta.pivothigh(leftBars, rightBars)
swl = ta.pivotlow (leftBars, rightBars)

hprice = 0.0
hprice := not na(swh) ? swh : hprice[1]

lprice = 0.0
lprice := not na(swl) ? swl : lprice[1]

le = false
le := not na(swh) ? true : le[1] and high > hprice ? false : le[1]

se = false
se := not na(swl) ? true : se[1] and low < lprice ? false : se[1]

if le
    strategy.entry('PivRevLE', strategy.long, comment='PivRevLE', stop=hprice + syminfo.mintick)

if se
    strategy.entry('PivRevSE', strategy.short, comment='PivRevSE', stop=lprice - syminfo.mintick)

plot(hprice, color=color.new(color.green, 0), linewidth=2)
plot(lprice, color=color.new(color.red, 0), linewidth=2)


///////////////////
// WEEKLY TABLE //

new_week = weekofyear(time[1]) != weekofyear(time)
new_year = year(time) != year(time[1])

eq       = strategy.equity
bench_eq = close

// benchmark eq
bench_eq_htf = request.security(symb_bench, timeframe.period, close)

if (not use_cur)
    bench_eq := bench_eq_htf

bar_pnl   = eq / eq[1] - 1
bench_pnl = bench_eq / bench_eq[1] - 1


// Current Weekly P&L
cur_week_pnl  = 0.0
cur_week_pnl := bar_index == 0 ? 0 :
                 time >= from_date and (time[1] < from_date or new_week) ? bar_pnl :
                 (1 + cur_week_pnl[1]) * (1 + bar_pnl) - 1

// Current Yearly P&L
cur_year_pnl  = 0.0
cur_year_pnl := bar_index == 0 ? 0 :
                 time >= from_date and (time[1] < from_date or new_year) ? bar_pnl :
                 (1 + cur_year_pnl[1]) * (1 + bar_pnl) - 1


// Current Weekly P&L - Bench
bench_cur_week_pnl  = 0.0
bench_cur_week_pnl := bar_index == 0 or (time[1] < from_date and time >= from_date) ? 0 :
                       time >= from_date and new_week ? bench_pnl :
                       (1 + bench_cur_week_pnl[1]) * (1 + bench_pnl) - 1

// Current Yearly P&L - Bench
bench_cur_year_pnl  = 0.0
bench_cur_year_pnl := bar_index == 0 ? 0 :
                       time >= from_date and (time[1] < from_date  or new_year) ? bench_pnl :
                       (1 + bench_cur_year_pnl[1]) * (1 + bench_pnl) - 1


var week_time = array.new_int(0)
var year_time = array.new_int(0)

var week_pnl = array.new_float(0)
var year_pnl = array.new_float(0)

var bench_week_pnl = array.new_float(0)
var bench_year_pnl = array.new_float(0)


// Filling weekly / yearly pnl arrays
if array.size(week_time) > 0
    if weekofyear(time) == weekofyear(array.get(week_time, array.size(week_time) - 1))
        array.pop(week_pnl)
        array.pop(bench_week_pnl)
        array.pop(week_time)


if array.size(year_time) > 0
    if year(time) == year(array.get(year_time, array.size(year_time) - 1))
        array.pop(year_pnl)
        array.pop(bench_year_pnl)
        array.pop(year_time)


if (time >= from_date)
    array.push(week_time, time)
    array.push(year_time, time)

    array.push(week_pnl, cur_week_pnl)
    array.push(year_pnl, cur_year_pnl)

    array.push(bench_year_pnl, bench_cur_year_pnl)
    array.push(bench_week_pnl, bench_cur_week_pnl)


// Weekly P&L Table

table_size = size.tiny
var weekly_table = table(na)

if array.size(year_pnl) > 0 and barstate.islastconfirmedhistory

    weekly_table := table.new(position.bottom_right,
                 columns=56, rows=array.size(year_pnl) * 3 + 5, border_width=1)

// Fill weekly performance
    table.cell(weekly_table, 0, 0,  'Perf',
                 bgcolor = #999999, text_size= table_size)


    for numW = 1 to 53 by 1
        table.cell(weekly_table, numW, 0,  str.tostring(numW),
                 bgcolor= #999999, text_size= table_size)


    table.cell(weekly_table, 54, 0, ' ',
                 bgcolor = #999999, text_size= table_size)
    table.cell(weekly_table, 55, 0, 'Year',
                 bgcolor = #999999, text_size= table_size)

    max_abs_y = math.max(math.abs(array.max(year_pnl)), math.abs(array.min(year_pnl)))
    max_abs_m = math.max(math.abs(array.max(week_pnl)), math.abs(array.min(week_pnl)))


    for yi = 0 to array.size(year_pnl) - 1 by 1
        table.cell(weekly_table, 0,  yi + 1,
                 str.tostring(year(array.get(year_time, yi))),
                 bgcolor=#cccccc, text_size=table_size)

        table.cell(weekly_table, 53, yi + 1, ' ',
                 bgcolor=#999999, text_size=table_size)

        table.cell(weekly_table, 54, yi + 1, ' ',
                 bgcolor=#999999, text_size=table_size)

        y_color = color.from_gradient(array.get(year_pnl, yi), -max_abs_y, max_abs_y, loss_color, prof_color)

        table.cell(weekly_table, 55, yi + 1,
                 str.tostring(math.round(array.get(year_pnl, yi) * 100, prec)),
                 bgcolor=y_color, text_size=table_size)

    int iw_row= na
    int iw_col= na

    for wi = 0 to array.size(week_time) - 2 by 1
        w_row   = year(array.get(week_time, wi)) - year(array.get(year_time, 0)) + 1
        w_col   = weekofyear(array.get(week_time, wi))

        w_color = color.from_gradient(array.get(week_pnl, wi), -max_abs_m, max_abs_m, loss_color, prof_color)

        if iw_row + 1 == w_row and iw_col + 1 == w_col
            table.cell(weekly_table, w_col, w_row-1,
                 str.tostring(math.round(array.get(week_pnl, wi) * 100, prec)),
                 bgcolor=w_color, text_size=table_size)
        else
            table.cell(weekly_table, w_col, w_row,
                 str.tostring(math.round(array.get(week_pnl, wi) * 100, prec)),
                 bgcolor=w_color, text_size=table_size)


        iw_row:= w_row
        iw_col:= w_col


    // Fill benchmark performance
    next_row =  array.size(year_pnl) + 1

    if (disp_bench)

        table.cell(weekly_table, 0,  next_row, 'Bench',
                 bgcolor=#999999, text_size=table_size)

        for numW = 1 to 53 by 1
            table.cell(weekly_table, numW, next_row,  str.tostring(numW),
                 bgcolor= #999999, text_size= table_size)

        table.cell(weekly_table, 54, next_row, ' '   ,
                 bgcolor = #999999, text_size=table_size)
        table.cell(weekly_table, 55, next_row, 'Year',
                 bgcolor = #999999, text_size=table_size)

        max_bench_abs_y = math.max(math.abs(array.max(bench_year_pnl)), math.abs(array.min(bench_year_pnl)))
        max_bench_abs_w = math.max(math.abs(array.max(bench_week_pnl)), math.abs(array.min(bench_week_pnl)))

        for yi = 0 to array.size(year_time) - 1 by 1
            table.cell(weekly_table, 0,  yi + 1 + next_row + 1,
                 str.tostring(year(array.get(year_time, yi))),
                 bgcolor=#cccccc, text_size=table_size)

            table.cell(weekly_table, 53, yi + 1 + next_row + 1, ' ',
                 bgcolor=#999999, text_size=table_size)

            table.cell(weekly_table, 54, yi + 1 + next_row + 1, ' ',
                 bgcolor=#999999, text_size=table_size)

            y_color = color.from_gradient(array.get(bench_year_pnl, yi), -max_bench_abs_y, max_bench_abs_y, loss_color, prof_color)
            table.cell(weekly_table, 55, yi + 1 + next_row + 1,
                 str.tostring(math.round(array.get(bench_year_pnl, yi) * 100, prec)),
                 bgcolor=y_color, text_size=table_size)


        int iw_row1= na
        int iw_col1= na

        for wi = 0 to array.size(week_time) - 1 by 1
            w_row   = year(array.get(week_time, wi)) - year(array.get(year_time, 0)) + 1
            w_col   = weekofyear(array.get(week_time, wi))

            w_color = color.from_gradient(array.get(bench_week_pnl, wi), -max_bench_abs_w, max_bench_abs_w, loss_color, prof_color)

            if iw_row1 + 1 == w_row and iw_col1 + 1 == w_col
                table.cell(weekly_table, w_col, w_row  + next_row    ,
                 str.tostring(math.round(array.get(bench_week_pnl, wi) * 100, prec)),
                 bgcolor=w_color, text_size=table_size)
            else
                table.cell(weekly_table, w_col, w_row  + next_row + 1,
                 str.tostring(math.round(array.get(bench_week_pnl, wi) * 100, prec)),
                 bgcolor=w_color, text_size=table_size)

            iw_row1:= w_row
            iw_col1:= w_col


// Fill Alpha
    if (disp_alpha)

        // columns
        next_row :=  array.size(year_pnl) * 2 + 3
        table.cell(weekly_table, 0,  next_row, 'Alpha',
                 bgcolor=#999999, text_size= table_size)


        for numW = 1 to 53 by 1
            table.cell(weekly_table, numW, next_row,  str.tostring(numW),
                 bgcolor= #999999, text_size= table_size)


        table.cell(weekly_table, 54, next_row, ' '   ,
                 bgcolor=#999999, text_size= table_size)
        table.cell(weekly_table, 55, next_row, 'Year',
                 bgcolor=#999999, text_size= table_size)


        max_alpha_abs_y = 0.0
        for yi = 0 to array.size(year_time) - 1 by 1
            if (math.abs(array.get(year_pnl, yi)  - array.get(bench_year_pnl, yi)) > max_alpha_abs_y)
                max_alpha_abs_y := math.abs(array.get(year_pnl, yi)  - array.get(bench_year_pnl, yi))

        max_alpha_abs_w = 0.0
        for wi = 0 to array.size(week_pnl) - 1 by 1
            if (math.abs(array.get(week_pnl, wi) - array.get(bench_week_pnl, wi)) > max_alpha_abs_w)
                max_alpha_abs_w := math.abs(array.get(week_pnl, wi) - array.get(bench_week_pnl, wi))


        for yi = 0 to array.size(year_time) - 1 by 1
            table.cell(weekly_table, 0,  yi + 1 + next_row + 1,
                 str.tostring(year(array.get(year_time, yi))),
                 bgcolor=#cccccc, text_size= table_size)

            table.cell(weekly_table, 53, yi + 1 + next_row + 1, ' ',
                 bgcolor=#999999, text_size= table_size)

            table.cell(weekly_table, 54, yi + 1 + next_row + 1, ' ',
                 bgcolor=#999999, text_size= table_size)

            y_color = color.from_gradient(array.get(year_pnl, yi)  - array.get(bench_year_pnl, yi), -max_alpha_abs_y, max_alpha_abs_y, loss_color, prof_color)
            table.cell(weekly_table, 55, yi + 1 + next_row + 1,
                 str.tostring(math.round((array.get(year_pnl, yi)  - array.get(bench_year_pnl, yi)) * 100, prec)),
                 bgcolor=y_color, text_size= table_size)


        int iw_row2= na
        int iw_col2= na

        for wi = 0 to array.size(week_time) - 1 by 1
            w_row   = year(array.get(week_time, wi)) - year(array.get(year_time, 0)) + 1
            w_col   = weekofyear(array.get(week_time, wi))
            w_color = color.from_gradient(array.get(week_pnl, wi) - array.get(bench_week_pnl, wi), -max_alpha_abs_w, max_alpha_abs_w, loss_color, prof_color)

            if iw_row2 + 1 == w_row and iw_col2 + 1 == w_col
                table.cell(weekly_table, w_col, w_row  + next_row ,
                     str.tostring(math.round((array.get(week_pnl, wi) - array.get(bench_week_pnl, wi)) * 100, prec)),
                     bgcolor=w_color, text_size= table_size)
            else
                table.cell(weekly_table, w_col, w_row  + next_row + 1 ,
                     str.tostring(math.round((array.get(week_pnl, wi) - array.get(bench_week_pnl, wi)) * 100, prec)),
                     bgcolor=w_color, text_size= table_size)

            iw_row2:= w_row
            iw_col2:= w_col
Detail
https://www.fmz.com/strategy/435089
Last Modified
2023-12-12 11:07:46