
10 KiB
Name
基于多重移动平均线的趋势交易策略Trend-Trading-Strategy-Based-on-Multiple-Moving-Averages
Author
ChaoZhang
Strategy Description
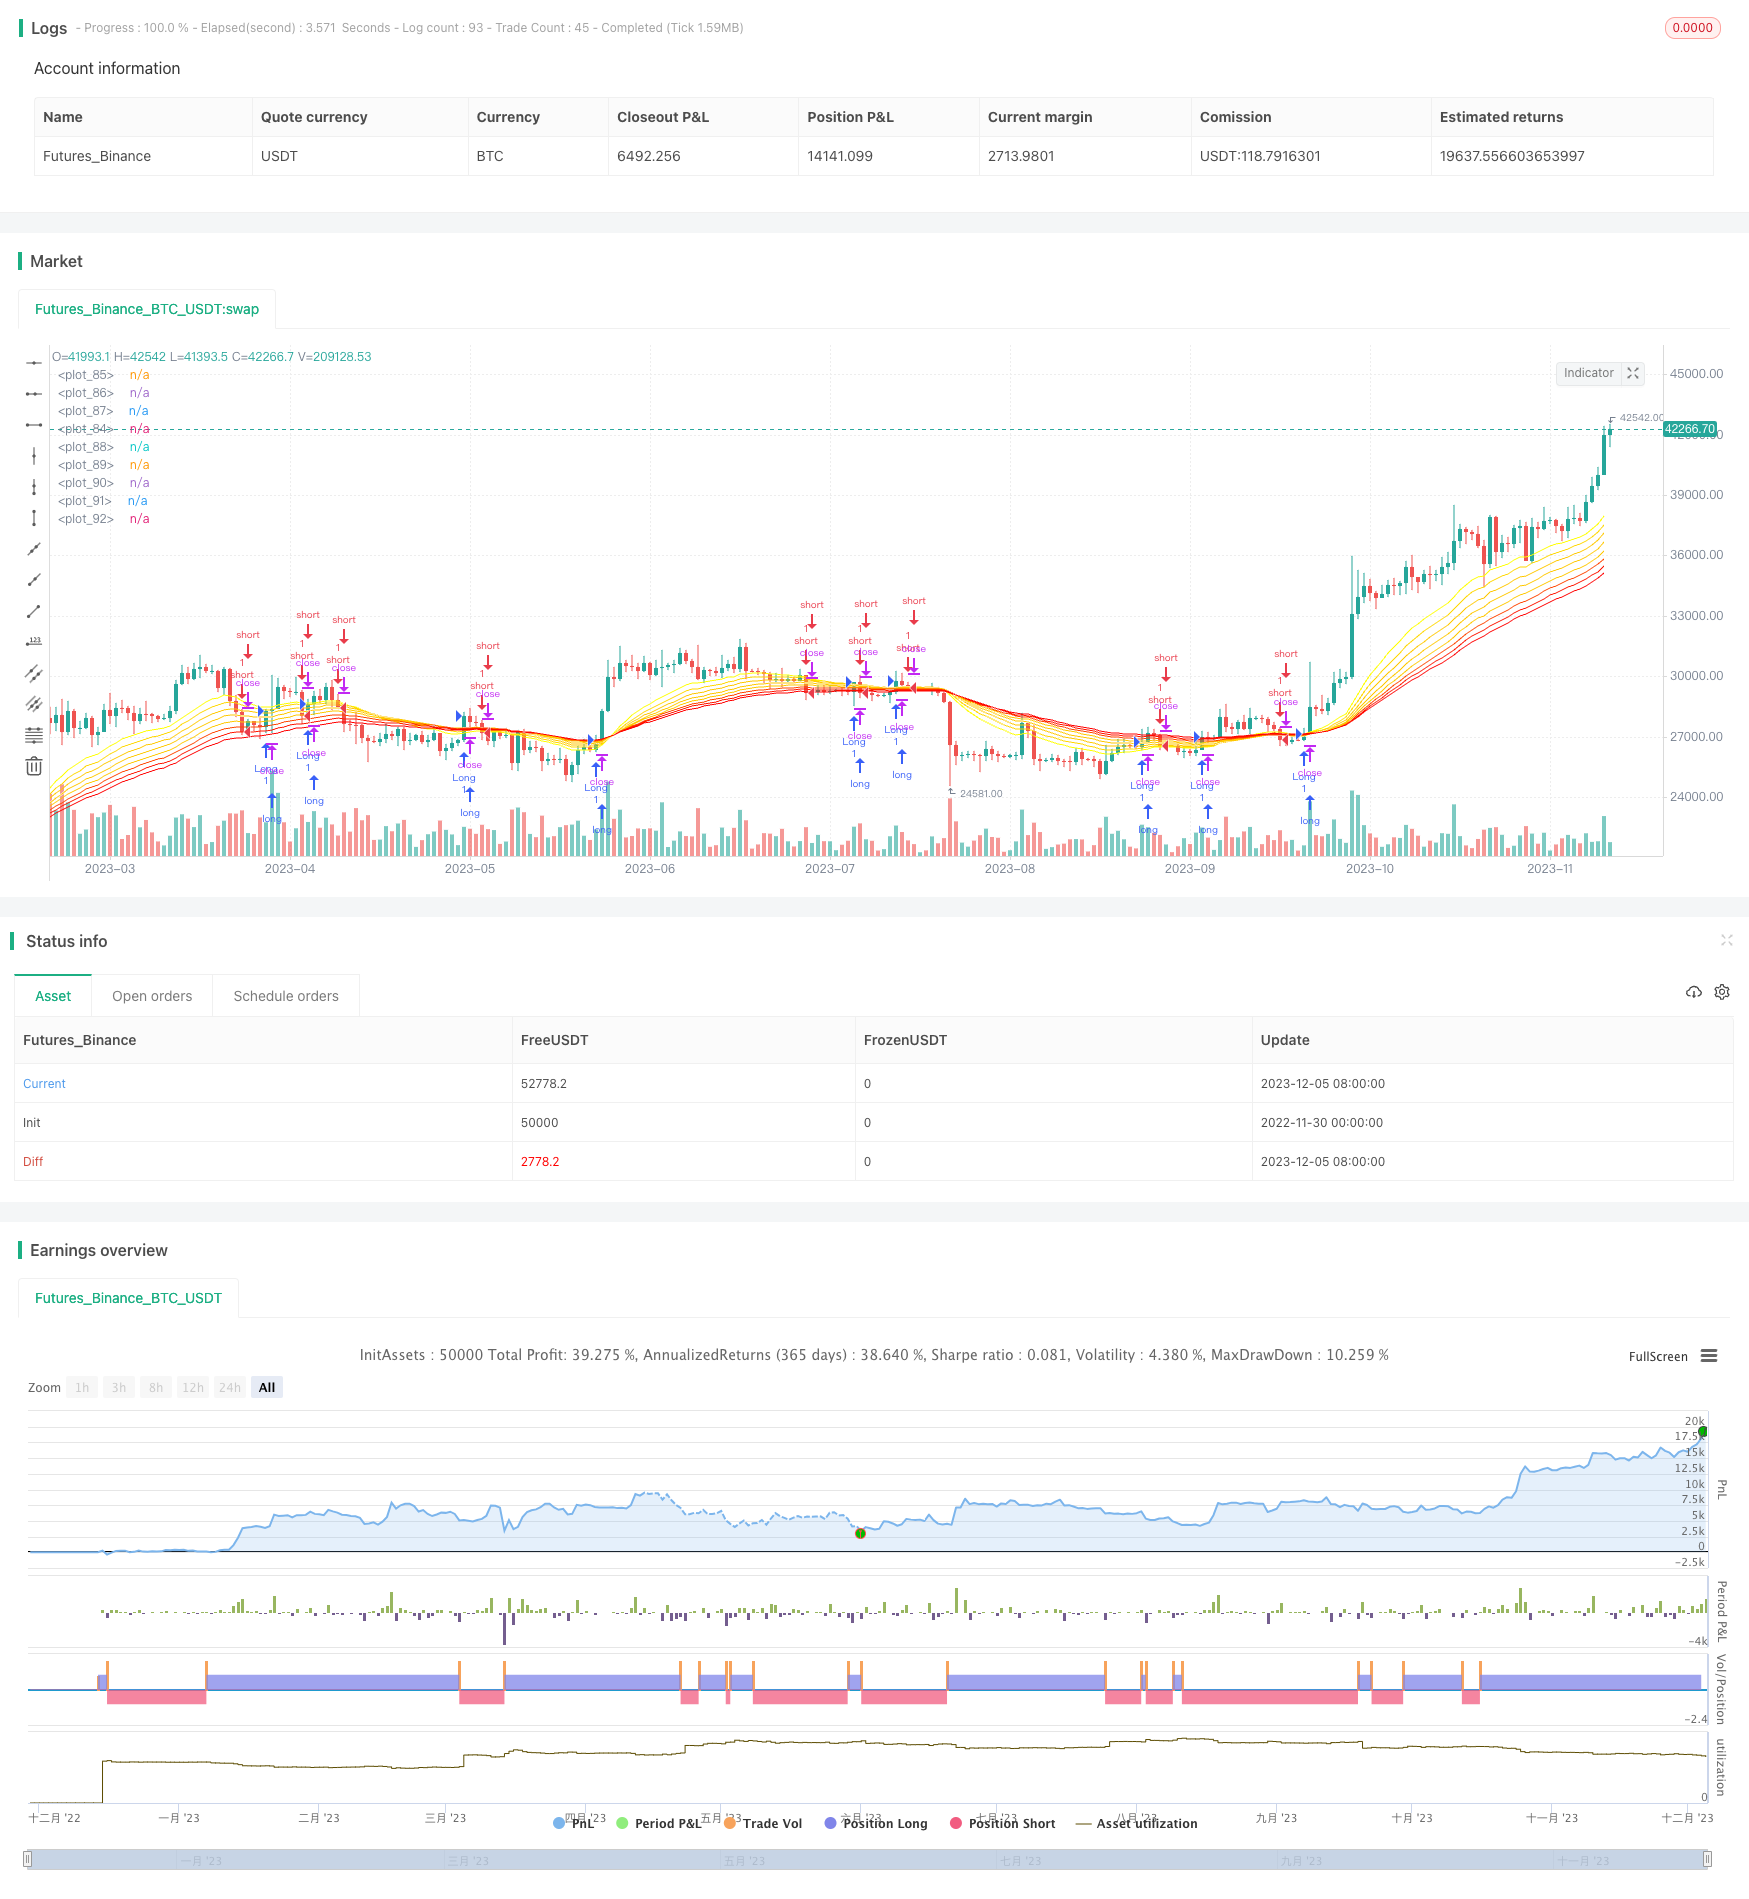 [trans]
概述
本策略通过计算多个不同周期的移动平均线,结合黄金交叉形态来判断趋势方向,实现趋势跟踪交易。主要功能是发现价格趋势转折点,发出买入和卖出信号。
策略原理
该策略基于35周期的EMA作为主要判断买入卖出的指标。当价格上穿35EMA时,产生买入信号;当价格下破35EMA时,产生卖出信号。此外,该策略同时绘制了8条不同周期的EMA组成的EMA带,辅助判断趋势方向。越低周期的EMA离价格越近,能更快捕捉价格变化;越高周期的EMA跟随价格变化越缓慢,能过滤掉部分噪音。EMA带能清楚描绘出价格的主要趋势方向。
该策略主要依赖35EMA判断价格主要趋势。当价格上穿或下穴35EMA时就产生交易信号。EMA带则主要起到辅助判断和优化入场timing的作用。
优势分析
该策略结合趋势判断和频繁交易之间的平衡。35EMA既能基本判断主要趋势方向变换,也不会太滞后,基本能在价格转折点附近产生交易信号。而EMA带形成的趋势通道,能辅助判断买入卖出的机会,优化入场的时机。
相比单一EMA指标判断,该策略能提供更全面和清晰的趋势判断。不同周期EMA的组合既保证了对大周期趋势方向的判断,又通过高低频EMA结合平滑了部分短周期市场噪音的影响。
用户可以自行调整参数,改变主要交易指标35EMA的周期,或EMA带中的EMA周期,优化自身的交易风格。整体来说,该策略提供了相对精准和全面的趋势交易方案。
风险分析
该策略主要风险在于用户的参数选择。如果选择的EMA周期太短,则会增加交易频率和交易风险。如果EMA周期太长,则会错过价格转折点,不能及时入场。
另一个主要风险是在盘整行情中,EMA指标会产生多次错误信号。这时用户需要辅助判断趋势方向,避免盲目入场。
最后一个风险点是在剧烈行情中,指标会发生滞后,不能及时发出买入卖出信号。这时用户需要提前判断,不能完全依赖指标信号。
优化方向
该策略主要优化方向是调整EMA参数,适配不同市场和交易者风格。具体来说,可以从以下几个方面入手:
- 调整主要交易指标35EMA的周期参数,优化获取交易信号的时机
- 调整EMA带中的各EMA周期参数,优化对趋势的判断
- 添加其他辅助指标结合判断,如BOLL通道、KDJ指标等
- 结合交易量指标,避免在价格剧烈波动但交易量不增长的情况下入场
通过参数调整和多个指标结合,可以进一步提高策略的稳定性和获取信号的准确性。从而降低交易风险,获得更好的回报。
总结
该策略通过计算多条不同周期的EMA并辅以EMA带判断,实现了相对准确和全面的趋势跟踪交易方案。它既考虑了捕捉价格转折的及时性,也综合判断了不同级别的趋势走向,在追求交易频率与系统稳定性之间取得了平衡。通过参数调整与优化,该策略可以适应不同市场环境、资产类型以及交易者风格。它为用户量化交易提供了一个相对成熟和强大的基础解决方案。
||
Overview
This strategy calculates multiple moving averages of different periods and combines golden cross patterns to determine trend direction for trend following trading. The main functionality is to identify price trend reversal points and generate buy and sell signals.
Strategy Principle
The core of this strategy is the 35-period EMA which serves as the primary indicator for buy and sell signals. When price crosses above the 35EMA, a buy signal is generated. When price crosses below the 35EMA, a sell signal is generated. In addition, the strategy plots an EMA ribbon consisting of 8 EMAs of different periods to aid in determining trend direction. Shorter period EMAs stay closer to price for detecting changes more rapidly, while longer period EMAs lag price changes more slowly to filter some noise. The EMA ribbon clearly depicts the major trend direction of price.
This strategy mainly relies on the 35EMA to determine the major trend. Trading signals are generated when price crosses above or below the 35EMA. The EMA ribbon plays an auxiliary role in confirming the trend and optimizing entry timing.
Advantage Analysis
This strategy strikes a balance between trend following and frequent trading. The 35EMA can basically judge changes in the major trend direction without too much lag, and generates trading signals around significant turning points. The EMA ribbon forms a trend channel for confirming opportunities to enter long or short positions with better timing.
Compared to using a single EMA indicator, this multi-EMA approach provides more comprehensive and clearer trend determination. The combination of different period EMAs ensures judging the longer-term trend direction while smoothing some short-term market noise through integrating high and low frequency EMAs.
Users can tweak parameters on their own to change the main 35EMA period or the EMAs in the ribbon to optimize for their own trading style. Overall, this strategy offers a relatively accurate and versatile solution for trend trading.
Risk Analysis
The main risk lies in the user's choice of parameters. Using EMA periods that are too short increases trade frequency and risk. Periods that are too long may cause missing major turning points and lag entries.
Another key risk is during range-bound markets, the EMA indicator can generate multiple false signals. Users need to apply additional trend analysis to avoid blind entries.
Finally, during strong trending markets, indicator lag may delay buy and sell signals. Users should anticipate turning points instead of purely relying on signals.
Optimization Directions
The main ways to optimize this strategy focus on adjusting EMA parameters to suit different markets and trading styles:
- Fine tune the 35EMA period for better timing of trade signals
- Adjust EMA ribbon periods for better trend judgment
- Incorporate other supporting indicators like BOLL bands and KDJ for confirmation
- Add volume measures to avoid acting in volatile markets with no volume increase
Through parameter tuning and combining signals from multiple indicators, further improvements in stability and signal accuracy can be achieved. This reduces trading risks and achieves better returns.
Conclusion
This strategy provides a relatively accurate and versatile trend following solution through calculating multiple EMAs and using the EMA ribbon. It balances capturing turning points promptly and judging multi-timeframe trends holistically for a good mix of trade frequency and system stability. Through optimization it adapts across market environments, asset types and trading styles. It offers users a sophisticated and robust foundation for quantitative trading.
[/trans]
Strategy Arguments
| Argument | Default | Description |
|---|---|---|
| v_input_1 | true | Show Buy & Sell Strategy |
| v_input_2 | true | Show EMA Cross - need to active B&S Strategy |
| v_input_3 | 35 | Length EMA Cross - need to active B&S Strategy |
| v_input_4_close | 0 | Source: close |
Source (PineScript)
/*backtest
start: 2022-11-30 00:00:00
end: 2023-12-06 00:00:00
period: 1d
basePeriod: 1h
exchanges: [{"eid":"Futures_Binance","currency":"BTC_USDT"}]
*/

//
// @author d3nv3r
// @inspiration [LazyBear]
// List of all my indicators: https://github.com/d3nv3r0ne/tradingview
//
// Inputs : Show Buy&Sell Signals
// Inputs : Show EMA in White for the Buy&Sell Signals
// Inputs : Choose the length of the EMA for the B&S signals
//
// How to use it :
// Any chart
// copy all and paste the content into the Pine Editor Tab at the bottom of the tradingview pannel
// [Save As...] and [Add to Chart] in top-right of the Pine Editor
//
//@version=4
strategy(shorttitle = "35EMA_X_B/S_RIBBON", title="35EMA Cross BuyAndSell Strategy + RIBBON [d3nv3r]", overlay=true)

//
// Variables inputs
//
useBSstrategy = input(true, title="Show Buy & Sell Strategy")
showMABS = input(true, title="Show EMA Cross - need to active B&S Strategy")
lengthBS = input(title="Length EMA Cross - need to active B&S Strategy", type=input.integer, defval=35, minval=1)
src = input(close, title="Source")

//
// Variables
// Ribbon EMA + EMA B/S
//
lenRib1 = 20
lenRib2 = 25
lenRib3 = 30
lenRib4 = 35
lenRib5 = 40
lenRib6 = 45
lenRib7 = 50
lenRib8 = 55

//
// Variables
// Quadruple SMA + SMA B/S
//
maBS = ema(src, lengthBS)
rib1 = ema(src, lenRib1)
rib2 = ema(src, lenRib2)
rib3 = ema(src, lenRib3)
rib4 = ema(src, lenRib4)
rib5 = ema(src, lenRib5)
rib6 = ema(src, lenRib6)
rib7 = ema(src, lenRib7)
rib8 = ema(src, lenRib8)

//
// Variables color
//
colorEMAX = #FFFFFF
colorRib1 = #FFFF00
colorRib2 = #FFD700
colorRib3 = #FFC800
colorRib4 = #FFC800
colorRib5 = #FFC800
colorRib6 = #FF4500
colorRib7 = #FF1500
colorRib8 = #FF0000

//
// Variables Buy/Sell
//
longCondition = crossover(close,maBS)
shortCondition = crossunder(close,maBS)

//
// Logic Buy/Sell
//
if (useBSstrategy)
    if (longCondition)
        strategy.entry("Long", strategy.long)
    if (shortCondition)
        strategy.entry("short", strategy.short)

//
// Plot Quadruple SMA + SMA B/S
//
plot(showMABS and maBS ? maBS : na, color=colorEMAX, transp=0, linewidth=2)
plot(rib1, color=colorRib1, transp=15, linewidth=1)
plot(rib2, color=colorRib2, transp=15, linewidth=1)
plot(rib3, color=colorRib3, transp=15, linewidth=1)
plot(rib4, color=colorRib4, transp=15, linewidth=1)
plot(rib5, color=colorRib5, transp=15, linewidth=1)
plot(rib6, color=colorRib6, transp=15, linewidth=1)
plot(rib7, color=colorRib7, transp=15, linewidth=1)
plot(rib8, color=colorRib8, transp=15, linewidth=1)
Detail
https://www.fmz.com/strategy/434525
Last Modified
2023-12-07 10:50:37