
11 KiB
Name
基于多重指标的比特币日线交易策略Multi-Indicator-Bitcoin-Daily-Trading-Strategy
Author
ChaoZhang
Strategy Description
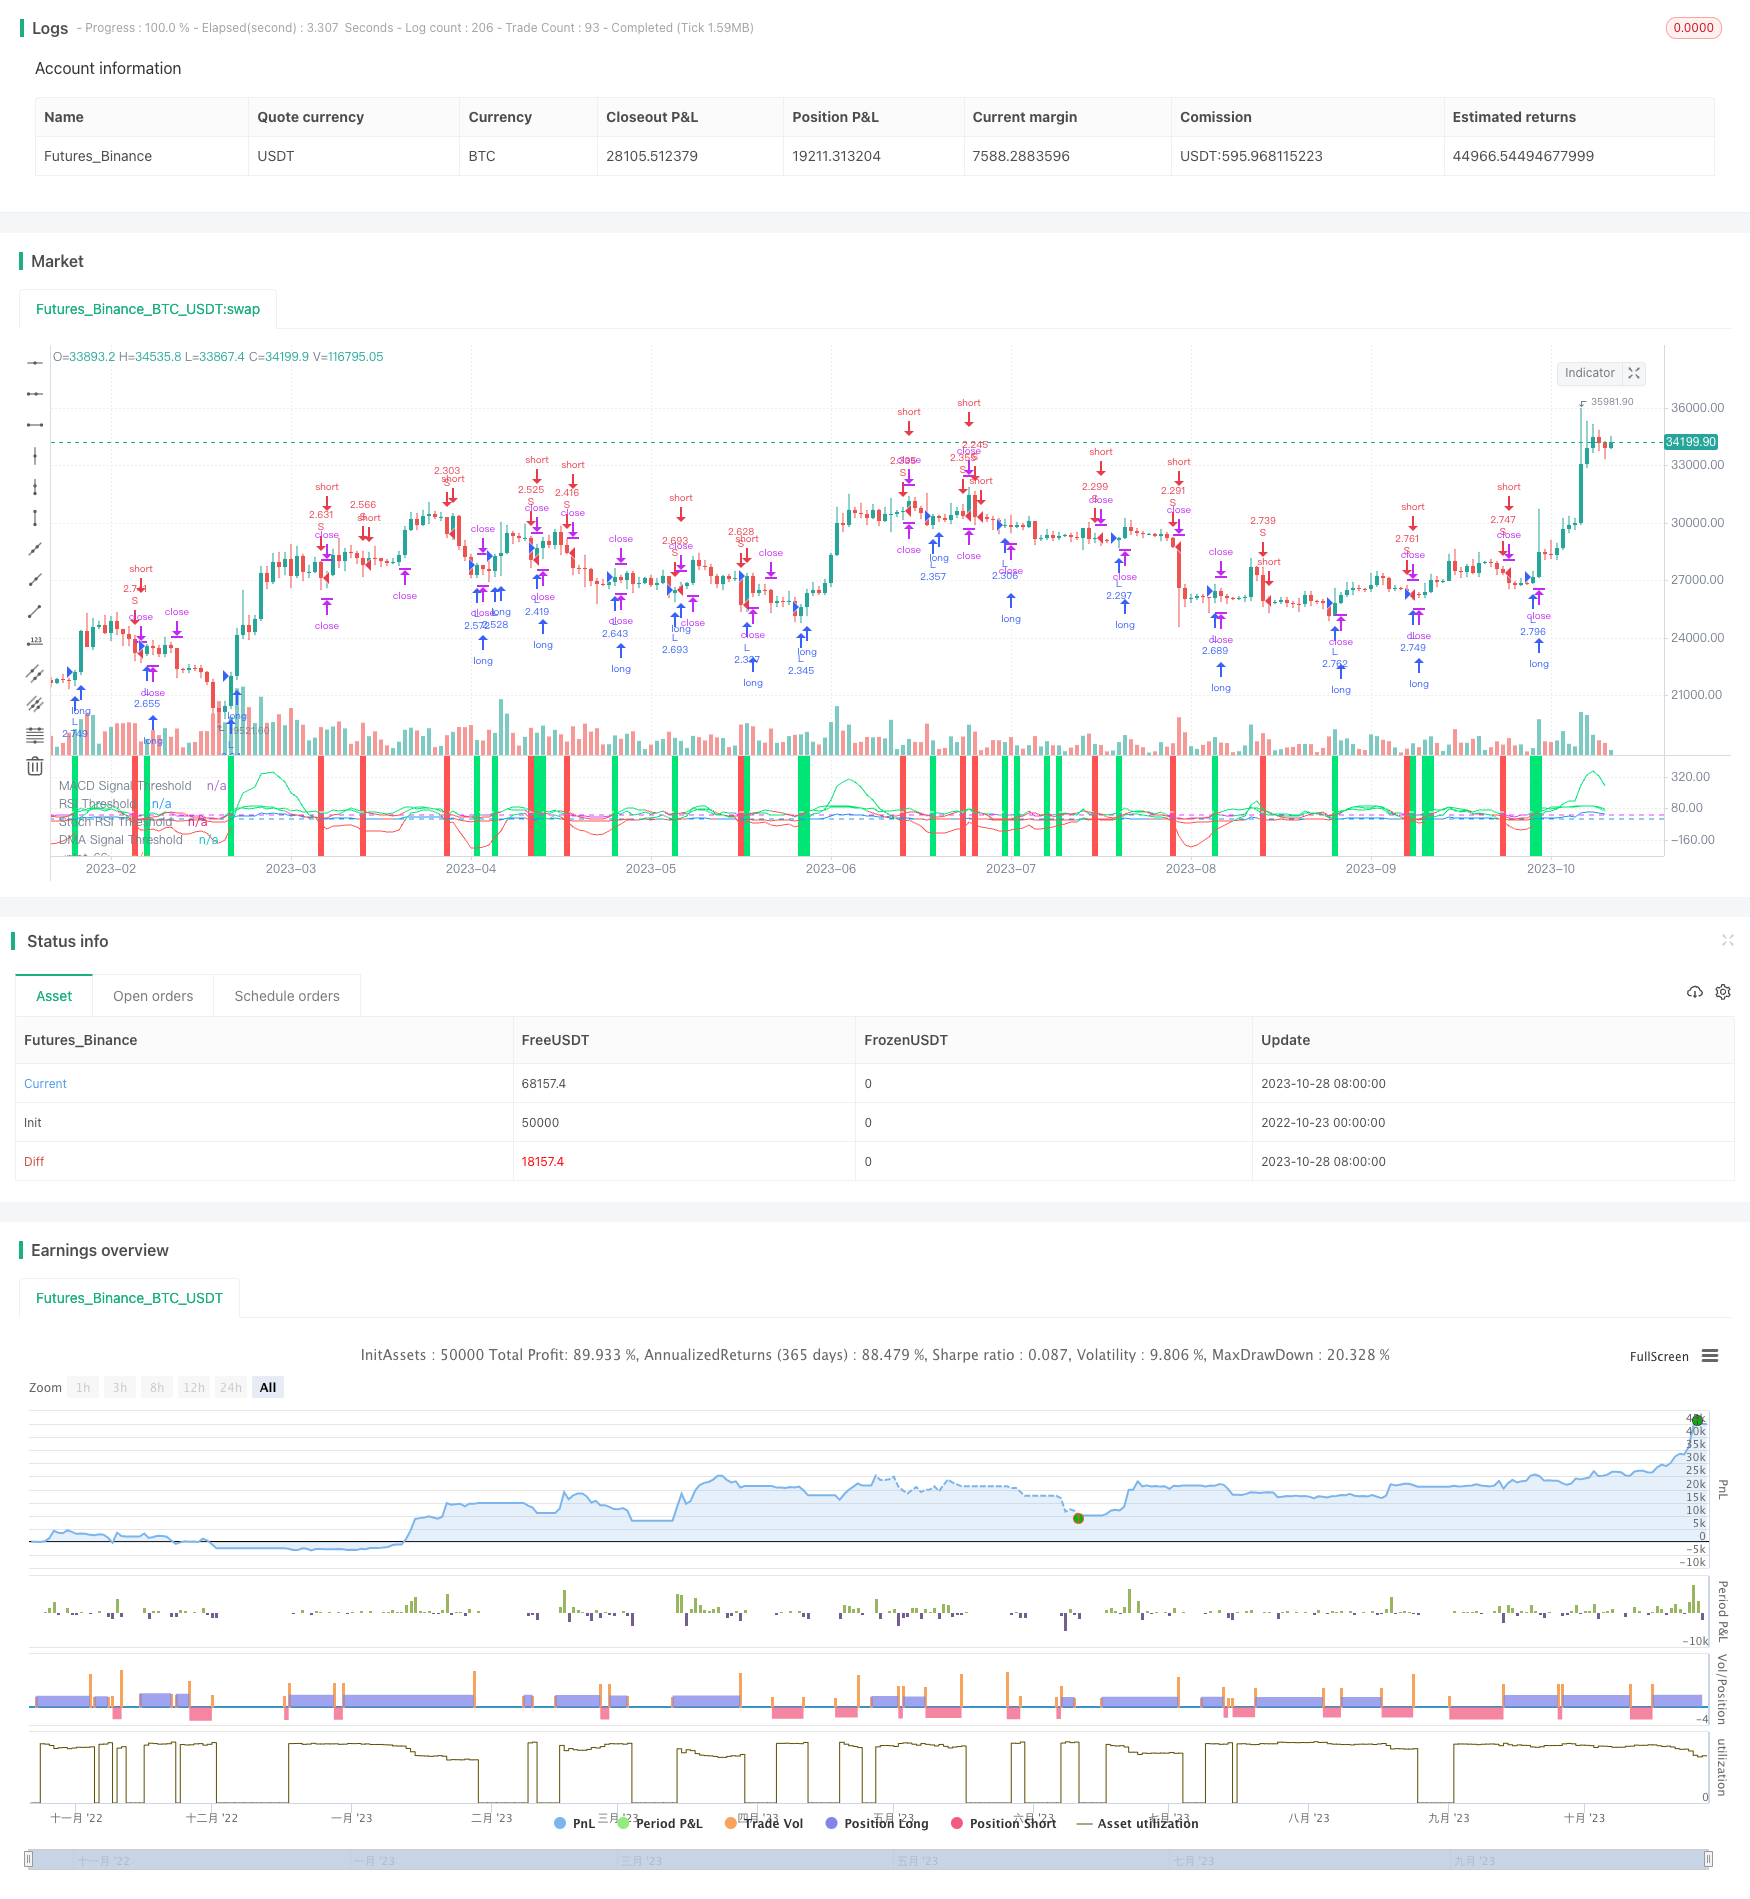
[trans]
概述
本策略基于多重指标组合,在比特币的日线时间范围内寻找交易机会。主要使用MACD、RSI、Stoch RSI等指标,结合均线的方向,判断目前的趋势方向,以发出买入和卖出信号。
策略原理
本策略主要利用了以下几个指标:
-
MACD
(快线-慢线)及其信号线。当MACD上穿信号线时为买入信号,下穿0时为卖出信号。 -
RSI相对强弱指数。当RSI上穿设定阈值时为买入信号。
-
Stoch RSI。Stoch RSI指标反映RSI的超买超卖情况。当Stoch RSI低于设定阈值时为买入信号,高于设定阈值时为卖出信号。
-
均线方向。当收盘价下穿均线时为卖出信号。
根据这些指标,本策略的交易信号如下:
买入信号:当(Stoch RSI < 设定阈值) 且 (MACD上穿阈值 或 RSI上穿阈值)时
卖出信号:当(MACD下穿0) 且 (收盘价下穿均线 或 Stoch RSI > 设定阈值)时
通过组合使用多个指标,可以比较准确地判断目前的趋势方向,并在趋势转折点发出交易信号。
策略优势
-
组合使用多个指标,可以提高判断准确性,避免因单一指标带来的错误信号。
-
MACD指标可以判断目前的趋势方向和力度。RSI指标反映超买超卖情况。Stoch RSI判断RSI的超买超卖情况。均线判断目前的趋势方向。这些指标互为验证,提高了效果。
-
买入和卖出信号设置了多个指标的组合条件,可以过滤掉一些假信号,避免不必要的交易。
-
本策略回测起始时间为2017年1月1日,包含了2017年底比特币涨幅巨大的行情,可以检验策略在行情中的表现。
-
策略包含止损设置,可以控制单笔交易的损失。
策略风险
-
多指标组合虽然可以提高准确性,但指标之间也可能会产生分歧,导致一定的误判 risk。
-
策略优化的止损水平,可能需要根据不同行情调整。止损过宽会增加单笔损失,止损过窄会被止损摘出。
-
日线级别策略,无法在更短时间范围内进行细节操作。在突发事件造成短期大幅波动时,无法起到应对作用。
-
策略仅回测了部分历史行情,可能存在过拟合风险。需要在更长的时间范围和更多市场中测试,才能验证策略效果。
优化方向
-
测试更多指标的组合,寻找更好的多指标组合策略。
-
对指标参数进行优化,找到更合适的参数数值。
-
测试不同的止损水平,寻找止损和止盈比例的最佳组合。
-
在更长的历史行情中进行回测,避免过拟合。
-
尝试在更高频的时间范围运用该策略思路,进行较为频繁的交易。
总结
本策略通过组合MACD、RSI、Stoch RSI等多个指标,判断目前比特币日线级别的趋势方向,在趋势转折点发出交易信号。同时设置止损来控制交易风险。该策略回测结果表现出色,但仍需在更长时间和更多市场中进行验证,以避免过拟合风险。通过进一步优化指标参数以及止损、止盈设置,可以获得更好的效果。本策略为多指标组合策略提供了一个初步思路,值得进一步探索和改进。
||
Overview
This strategy combines multiple indicators to identify trading opportunities within the daily time frame for Bitcoin. It mainly uses indicators like MACD, RSI, Stoch RSI, together with the direction of moving average to determine the current trend direction for generating buy and sell signals.
Strategy Logic
The strategy utilizes the following key indicators:
-
MACD (Fast MA - Slow MA) and its signal line. MACD crossing above signal line gives buy signal, and crossing below 0 gives sell signal.
-
RSI (Relative Strength Index). RSI crossing above a threshold gives buy signal.
-
Stoch RSI. Stoch RSI shows overbought/oversold levels of RSI. Stoch RSI below threshold gives buy signal, while above threshold gives sell signal.
-
Moving average direction. Close price crossing below MA gives sell signal.
According to these indicators, the trading signals are:
Buy Signal: When (Stoch RSI < Threshold) AND (MACD crossing above threshold OR RSI crossing above threshold)
Sell Signal: When (MACD crossing below 0) AND (Close below MA OR Stoch RSI > Threshold)
Using multiple indicators together can better determine the current trend direction and identify trend reversal points for entering trades.
Advantages
-
Combining multiple indicators improves accuracy and avoids false signals from a single indicator.
-
MACD shows trend direction and strength. RSI reflects overbought/oversold levels. Stoch RSI determines overbought/oversold of RSI. MA shows trend direction. These indicators verify each other.
-
The buy/sell signals require a combination of multiple indicators, filtering out some false signals and avoiding unnecessary trades.
-
Backtest starts from 2017/1/1, covering the huge bull run of Bitcoin at 2017 year end. Tests strategy performance in a real bull market.
-
Stop loss is set to control loss in single trades.
Risks
-
Although using multiple indicators improves accuracy, discrepancy between them can still lead to some wrong signals.
-
The optimized stop loss level may need adjustments for different market situations. Stop loss too wide increases loss in single trades, while too tight may get stopped out prematurely.
-
Daily timeframe prevents detailed operations in shorter time ranges. Unable to respond to sudden short-term big moves.
-
Strategy is only backtested on limited historical data. Overfit risk exists. Requires further testing across longer timeframe and more markets.
Enhancement Opportunities
-
Test more indicator combinations to find optimal multi-indicator strategies.
-
Optimize parameters of the indicators for better values.
-
Test different stop loss levels to find optimal risk/reward ratio.
-
Conduct backtests across longer historical data to avoid overfitting.
-
Explore applying strategy logic in higher frequency timeframes for more frequent trading.
Conclusion
This strategy combines MACD, RSI, Stoch RSI and other indicators to determine the bitcoin daily trend direction and identify trend reversals for trade entry. Stop loss is set to control trade risk. Backtest shows positive results but still requires further verification across longer timeframe and more markets to avoid overfit risks. Further optimizations on indicator parameters and stop loss/take profit levels can improve results. The strategy provides an initial idea of multi-indicator combination approach which is worth deeper exploration and enhancement.
[/trans]
Strategy Arguments
| Argument | Default | Description |
|---|---|---|
| v_input_1 | 2017 | Backtest Start Year |
| v_input_2 | true | Backtest Start Month |
| v_input_3 | true | Backtest Start Day |
| v_input_4 | 2019 | Backtest Stop Year |
| v_input_5 | 12 | Backtest Stop Month |
| v_input_6 | 31 | Backtest Stop Day |
| v_input_7 | 30 | rsi_threshold |
| v_input_8 | 4 | rsi_length |
| v_input_9 | 8 | srsi_length |
| v_input_10 | 4 | srsi_smooth |
| v_input_11 | 57 | srsi_sell_threshold |
| v_input_12 | 14 | length |
| v_input_13 | -1 | dma_signal_threshold |
| v_input_14 | 11 | fastLength |
| v_input_15 | 18 | slowlength |
| v_input_16 | 6 | MACDLength |
| v_input_17 | -2 | MACD_signal_threshold |
| v_input_18 | 5 | short_loss_tol |
| v_input_19 | 5 | long_loss_tol |
Source (PineScript)
/*backtest
start: 2022-10-23 00:00:00
end: 2023-10-29 00:00:00
period: 1d
basePeriod: 1h
exchanges: [{"eid":"Futures_Binance","currency":"BTC_USDT"}]
*/

//@version=4
// Original code is from CredibleHulk and modified by bennef
strategy("BTC Daily Strategy BF", overlay=false, initial_capital=10000, default_qty_type=strategy.percent_of_equity, default_qty_value=100, commission_type=strategy.commission.percent, commission_value=0.075)

/////////////// Time Frame ///////////////
testStartYear = input(2017, "Backtest Start Year")
testStartMonth = input(1, "Backtest Start Month")
testStartDay = input(1, "Backtest Start Day")
testPeriodStart = timestamp(testStartYear,testStartMonth,testStartDay, 0, 0)

testStopYear = input(2019, "Backtest Stop Year")
testStopMonth = input(12, "Backtest Stop Month")
testStopDay = input(31, "Backtest Stop Day")
testPeriodStop = timestamp(testStopYear,testStopMonth,testStopDay, 0, 0)

testPeriod() => true

/////////////// Input Params ///////////////
rsi_threshold = input(30)
rsi_length = input(4)
srsi_length = input(8)
srsi_smooth = input(4)
srsi_sell_threshold = input(57)
length = input(14)
dma_signal_threshold = input(-1)
fastLength = input(11)
slowlength = input(18)
MACDLength = input(6)
MACD_signal_threshold = input(-2)
short_loss_tol = input(5)
long_loss_tol = input(5)

stop_level_long = strategy.position_avg_price * (1 - long_loss_tol / 100.0)
stop_level_short = strategy.position_avg_price * (1 + short_loss_tol / 100.0)

///////////////  Signal generation ///////////////
// MACD
MACD = ema(close, fastLength) - ema(close, slowlength)
aMACD = ema(MACD, MACDLength)
delta = MACD - aMACD

// RSI and Stochastic RSI
rs = rsi(close, rsi_length)
k = sma(stoch(rs, rs, rs, srsi_length), srsi_smooth)

// SMA
norm = sma(ohlc4, length)
threshold = close - norm

/////////////// Strategy ///////////////
long = ((crossover(delta, MACD_signal_threshold) or crossover(rs, rsi_threshold)) and k < srsi_sell_threshold)
short = (crossunder(delta, 0) or (crossunder(threshold, dma_signal_threshold) and k > srsi_sell_threshold))

if testPeriod()
    strategy.entry("L", strategy.long, when = long)
    strategy.entry("S", strategy.short, when = short)
    strategy.exit("stop loss L", from_entry = "L", stop = stop_level_long)
    strategy.exit("stop loss S", from_entry = "S", stop = stop_level_short)

/////////////// Plotting ///////////////
// MACD
plot(delta, color = delta > MACD_signal_threshold ? color.lime : delta < 0 ? color.red : color.yellow)
MACD_signal_threshold_line = hline(MACD_signal_threshold, color = color.yellow, title = "MACD Signal Threshold")

// RSI
plot(rs, color = rs > rsi_threshold ? color.lime : color.fuchsia)
rsi_threshold_line = hline(rsi_threshold, color = color.fuchsia, title = "RSI Threshold")

// Stochastic RSI
plot(k, color = k > srsi_sell_threshold ? color.lime : color.red)
srsi_sell_threshold_line = hline(srsi_sell_threshold, color = color.white, title = "Stoch RSI Threshold")

// SMA
plot(threshold / 100, color = threshold < dma_signal_threshold ? color.red : color.blue)
dma_signal_threshold_line = hline (dma_signal_threshold, color = color.blue, title = "DMA Signal Threshold")

bgcolor(long ? color.lime : short ? color.red : na, transp=50)
Detail
https://www.fmz.com/strategy/430544
Last Modified
2023-10-30 10:37:58