
9.1 KiB
Name
基于价格行动的黄金交易算法Gold-Price-Action-Trading-Algorithm
Author
ChaoZhang
Strategy Description
 [trans]
概述
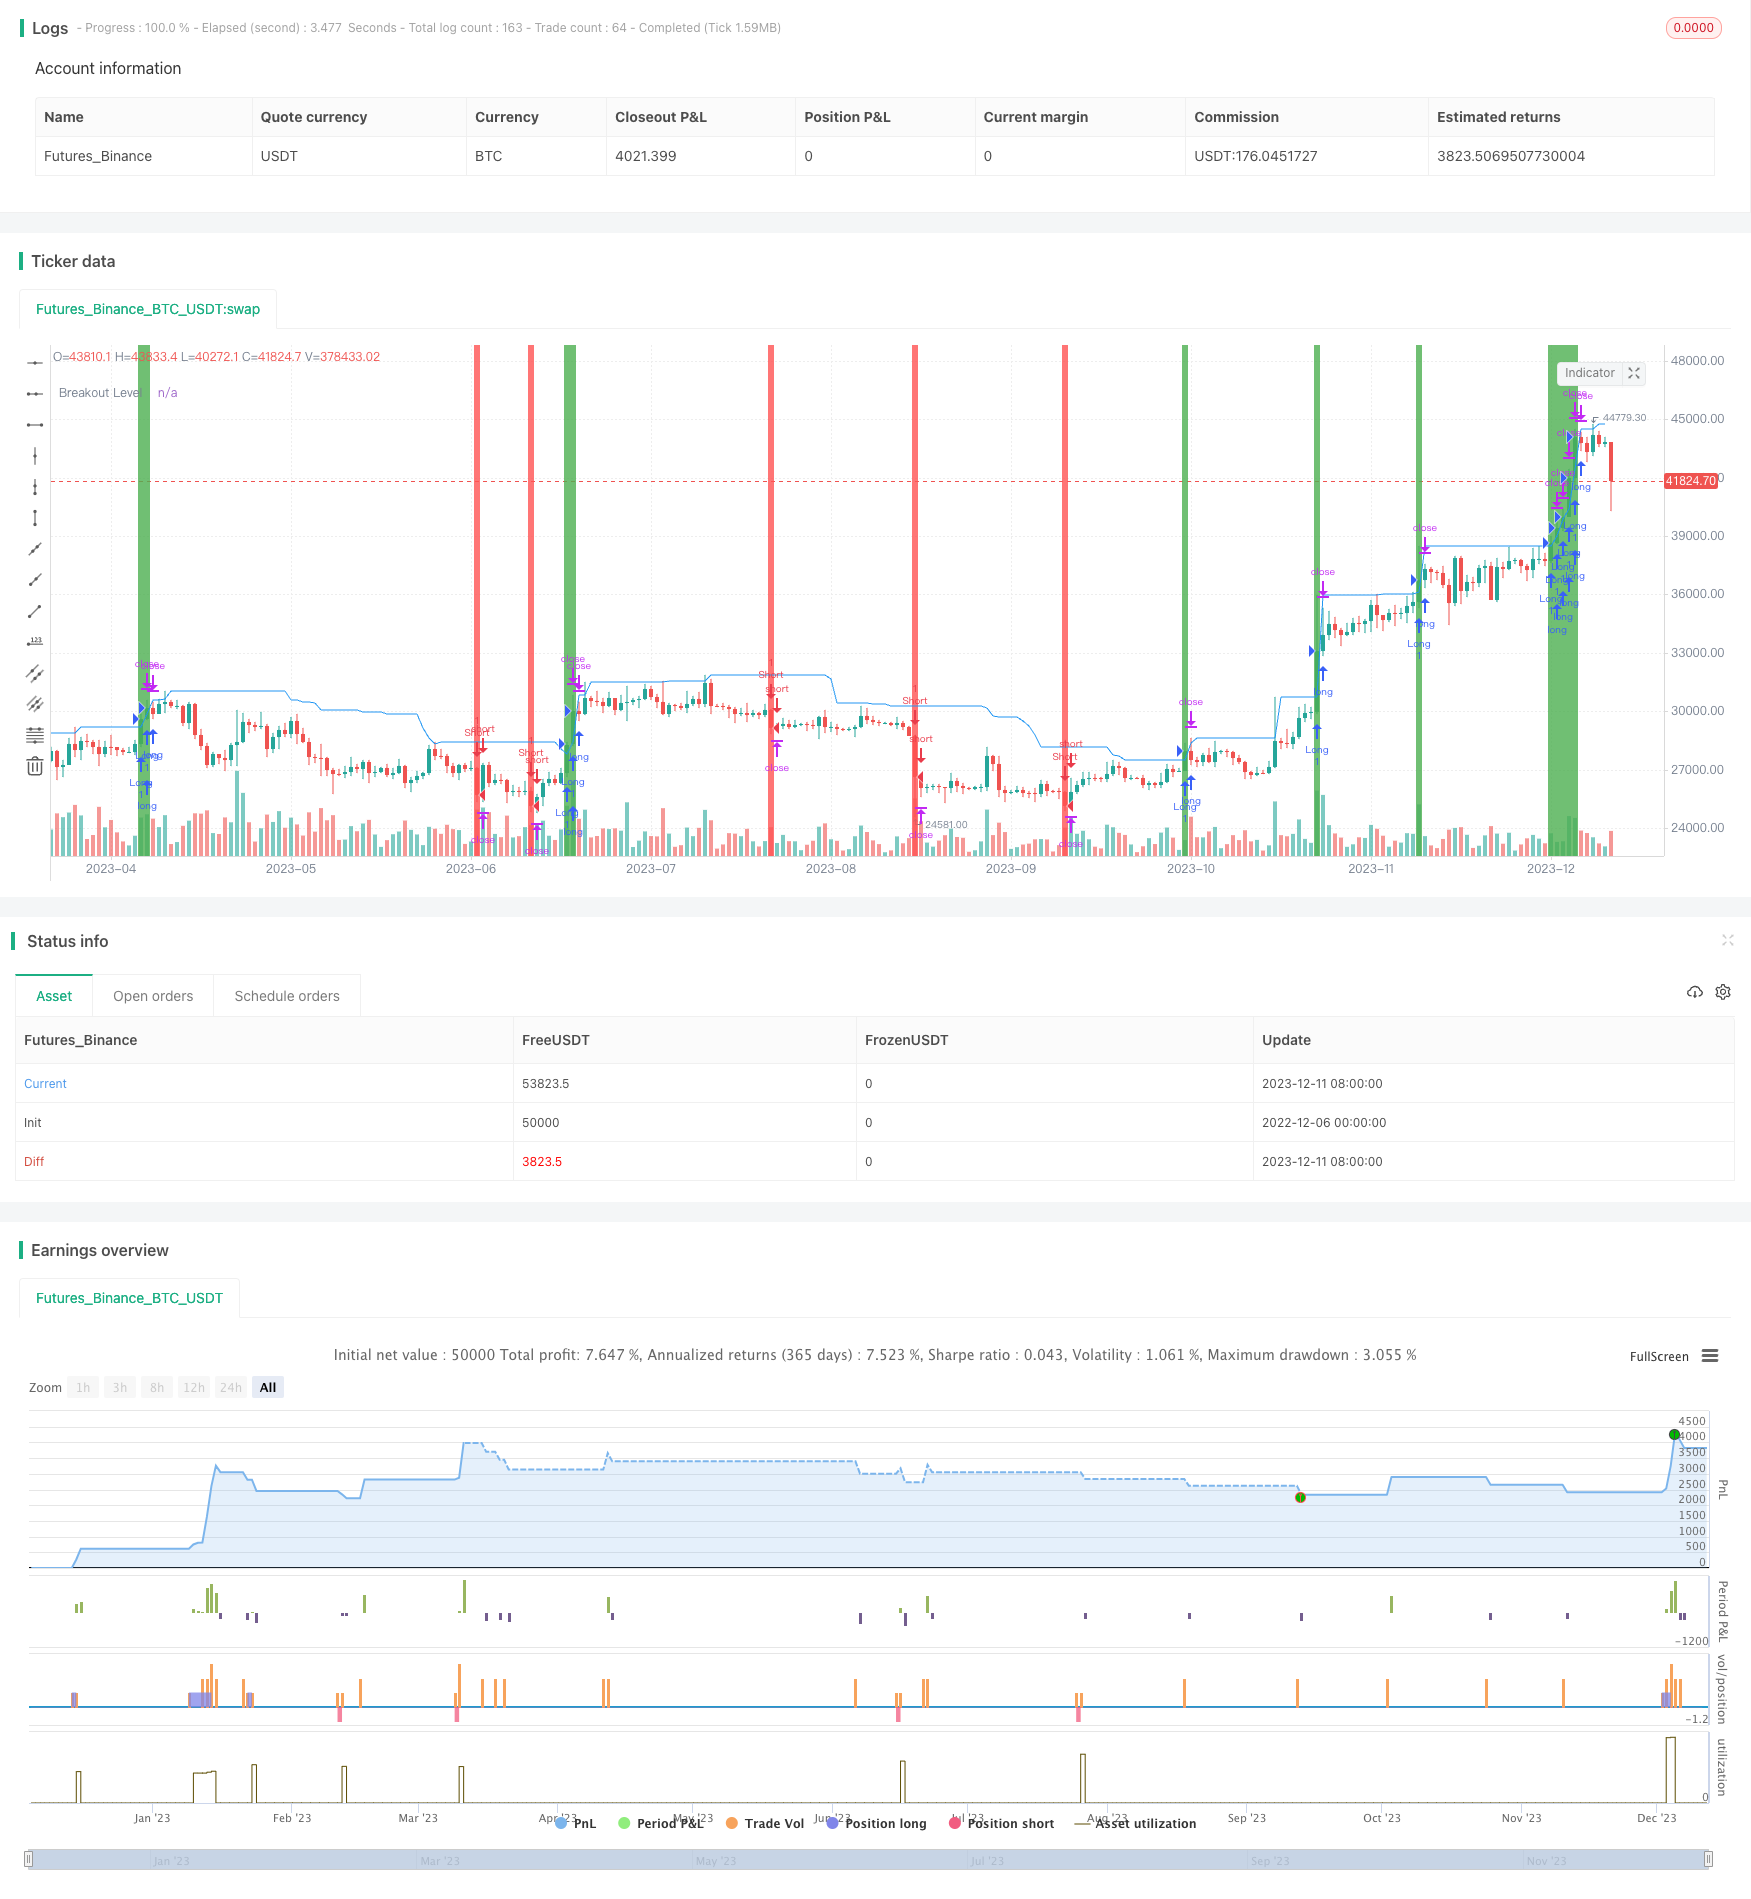
这个算法是基于黄金的价格行动来进行交易的。它会计算出最近20根K线的最高价和最低价,以判断价格的波动范围。当价格突破最近一根K线的最高价时,会做多;当价格跌破最近一根K线的最低价时,会做空。做多做空后会设置止盈和止损价格。
算法原理
这个算法的核心逻辑是基于突破理论。它会记录下最近20根K线的最高价和最低价,以判断价格波动的范围。当价格超过这个范围时,认为是突破,因此可以进行交易。具体来说,算法流程是:
- 计算最近20根K线的最高价(highs)和最低价(lows)
- 得到价格波动的范围(priceRange)
- 记录下最新一根K线的最高价,作为突破水平(breakoutLevel)
- 当最新K线的高点超过了突破水平,并且收盘价也超过了突破水平时,做多
- 当最新K线的低点跌破了突破水平,并且收盘价也跌破了突破水平时,做空
- 做多做空后设置止盈止损价格
可以看出,该算法的交易信号是价格突破判断而来的,核心就是识别价格突破的时机。
优势分析
该算法具有以下几个优势:
- 简单明了,容易理解和实现
- 基于价格行动判断,不受其他指标影响
- 突破信号清晰,容易掌握 entry timing
- 可显著过滤市场噪音,避免被套
- 有止盈止损设置,可以控制单笔损失
总的来说,该算法核心思路清晰,逻辑合理,实现简单,容易掌握entry timing,且可控单笔损失,是一种实用性较强的量化交易策略。
风险分析
该算法也存在一些风险:
- 突破失败的概率较大,存在错失利润的风险
- 突破时间掌握不当,可能入场过早或过晚
- 回撤可能较大,需要有一定的心理承受能力
- 止盈止损设置不合理,可能错过更大利润或承受更大损失
针对这些风险,可以采取以下措施加以控制和优化:
- 结合其他指标确认突破增强可靠性
- 优化参数,提高 entry timing 的准确性
- 调整仓位管理,降低单笔损失风险
- 动态调整止盈止损价格
优化方向
该算法可以从以下几个方面进行优化:
-
结合其他指标。可以引入移动平均线、布林线等指标,对突破进行二次确认,提高信号的可靠性。
-
参数优化。可以测试不同的参数组合,优化突破判断的周期长度,找到让交易信号更加可靠的参数设定。
-
止盈止损优化。可以结合波动率等指标,实时动态调整止盈止损距离。
-
仓位管理优化。优化仓位算法,降低单笔损失的影响。
-
机器学习。使用机器学习算法学习大量历史数据,自动寻找更优的参数组合。
通过以上优化,可以进一步提升该算法的稳定性、胜率和盈利能力。
总结
该黄金交易算法基于价格行动判断,利用突破理论产生交易信号。思路简单清晰,易于实现,实用性强。同时,也具有一定的风险,需要进一步优化以提高稳定性和盈利水平。总体来说,该算法适合黄金交易,是一种高效实用的量化策略。通过进一步结合其他指标、参数优化、止盈止损优化等手段,可以获得更好的策略效果。
||
Overview
This algorithm trades gold based on its price action. It calculates the highest and lowest prices of the recent 20 candlesticks to determine the price fluctuation range. It goes long when the price breaks through the highest price of the latest candlestick and goes short when the price breaks through the lowest price of the latest candlestick. After opening long or short positions, it sets take profit and stop loss prices.
Principles
The core logic of this algorithm is based on the breakout theory. It records the highest and lowest prices of the most recent 20 candlesticks to determine the price fluctuation range. When the price exceeds this range, it is considered a breakout and thus a trading signal is triggered. Specifically, the algorithm flow is:
- Calculate the highest prices (highs) and lowest prices (lows) of the most recent 20 candlesticks
- Get the price fluctuation range (priceRange)
- Record the highest price of the latest candlestick as the breakout level (breakoutLevel)
- When the high of the latest candlestick breaks through the breakout level and the close also breaks through the breakout level, go long
- When the low of the latest candlestick drops below the breakout level and the close also drops below the breakout level, go short
- Set take profit and stop loss prices after opening long or short positions
As can be seen, the trading signals of this algorithm come from price breakout judgements. The key is to identify the timing of price breakouts.
Advantages Analysis
The algorithm has the following advantages:
- Simple and clear, easy to understand and implement
- Based on price action, not affected by other indicators
- Clear breakout signals, easy to grasp entry timing
- Can significantly filter market noise and avoid being trapped
- Take profit and stop loss in place to control single trade loss
In general, the core idea of this algorithm is clear and logical. It is simple to implement and easy to grasp entry timing. It also allows controlling single trade loss. Thus it is a quantitative trading strategy with strong practicality.
Risk Analysis
The algorithm also has some risks:
- High probability of failed breakout, risk of missing profits
- Improper grasp of breakout timing, may enter too early or too late
- Relatively large drawdowns, need certain psychological endurance
- Unreasonable take profit and stop loss settings, may miss larger profits or take higher losses
To control and optimize against these risks, the following measures can be taken:
- Confirm breakout with other indicators to increase reliability
- Optimize parameters to improve entry timing accuracy
- Adjust position sizing to reduce single trade loss risk
- Dynamically adjust take profit and stop loss prices
Optimization Directions
The algorithm can be optimized in the following aspects:
-
Combine with other indicators. Moving averages, Bollinger Bands etc can be introduced to double confirm the breakout signals and increase reliability.
-
Parameter optimization. Different parameter combinations can be tested to optimize the breakout period length and find more reliable parameter settings.
-
Take profit and stop loss optimization. Dynamically adjust take profit and stop loss distance based on volatility etc.
-
Position sizing optimization. Optimize position sizing algorithm to reduce single trade loss impact.
-
Machine learning. Learn from large amount of historical data to automatically find better parameter combinations.
The above optimizations can further enhance the stability, win rate and profitability of the algorithm.
Conclusion
The gold trading algorithm generates trading signals based on price action and the breakout theory. The idea is simple and clear, easy to implement, and highly practical. Meanwhile, it also has some risks and needs further optimization to improve stability and profitability. Overall speaking, it is suitable for gold trading and an efficient quantitative strategy. By combining other indicators, parameter optimization, take profit/stop loss optimization etc, better strategy performance can be achieved.
[/trans]
Strategy Arguments
| Argument | Default | Description |
|---|---|---|
| v_input_1 | 500 | Take Profit |
| v_input_2 | 200 | Stop Loss |
Source (PineScript)
/*backtest
start: 2022-12-06 00:00:00
end: 2023-12-12 00:00:00
period: 1d
basePeriod: 1h
exchanges: [{"eid":"Futures_Binance","currency":"BTC_USDT"}]
*/

//@version=5
strategy("XAUUSD Price Action Strategy", overlay=true)

// Define input parameters
takeProfit = input(500, "Take Profit")
stopLoss = input(200, "Stop Loss")

// Calculate price action
highs = ta.highest(high, 20)
lows = ta.lowest(low, 20)
priceRange = highs - lows
breakoutLevel = highs[1]

// Define conditions for long and short trades
longCondition = high > breakoutLevel and close > highs[1]
shortCondition = low < breakoutLevel and close < lows[1]

// Execute long and short trades with take profit and stop loss
if longCondition
    strategy.entry("Long", strategy.long)
    strategy.exit("Long Exit", "Long", limit = close + takeProfit, stop = close - stopLoss)

if shortCondition
    strategy.entry("Short", strategy.short)
    strategy.exit("Short Exit", "Short", limit = close - takeProfit, stop = close + stopLoss)

// Plot breakout level
plot(breakoutLevel, color=color.blue, title="Breakout Level")

// Highlight long and short trade signals on the chart
bgcolor(longCondition ? color.green : na, transp=80)
bgcolor(shortCondition ? color.red : na, transp=80)
Detail
https://www.fmz.com/strategy/435260
Last Modified
2023-12-13 16:08:12