
12 KiB
Name
基于价格突破的自适应波动交易策略Adaptive-Volatility-Breakout-Trading-Strategy
Author
ChaoZhang
Strategy Description
 [trans]
概述
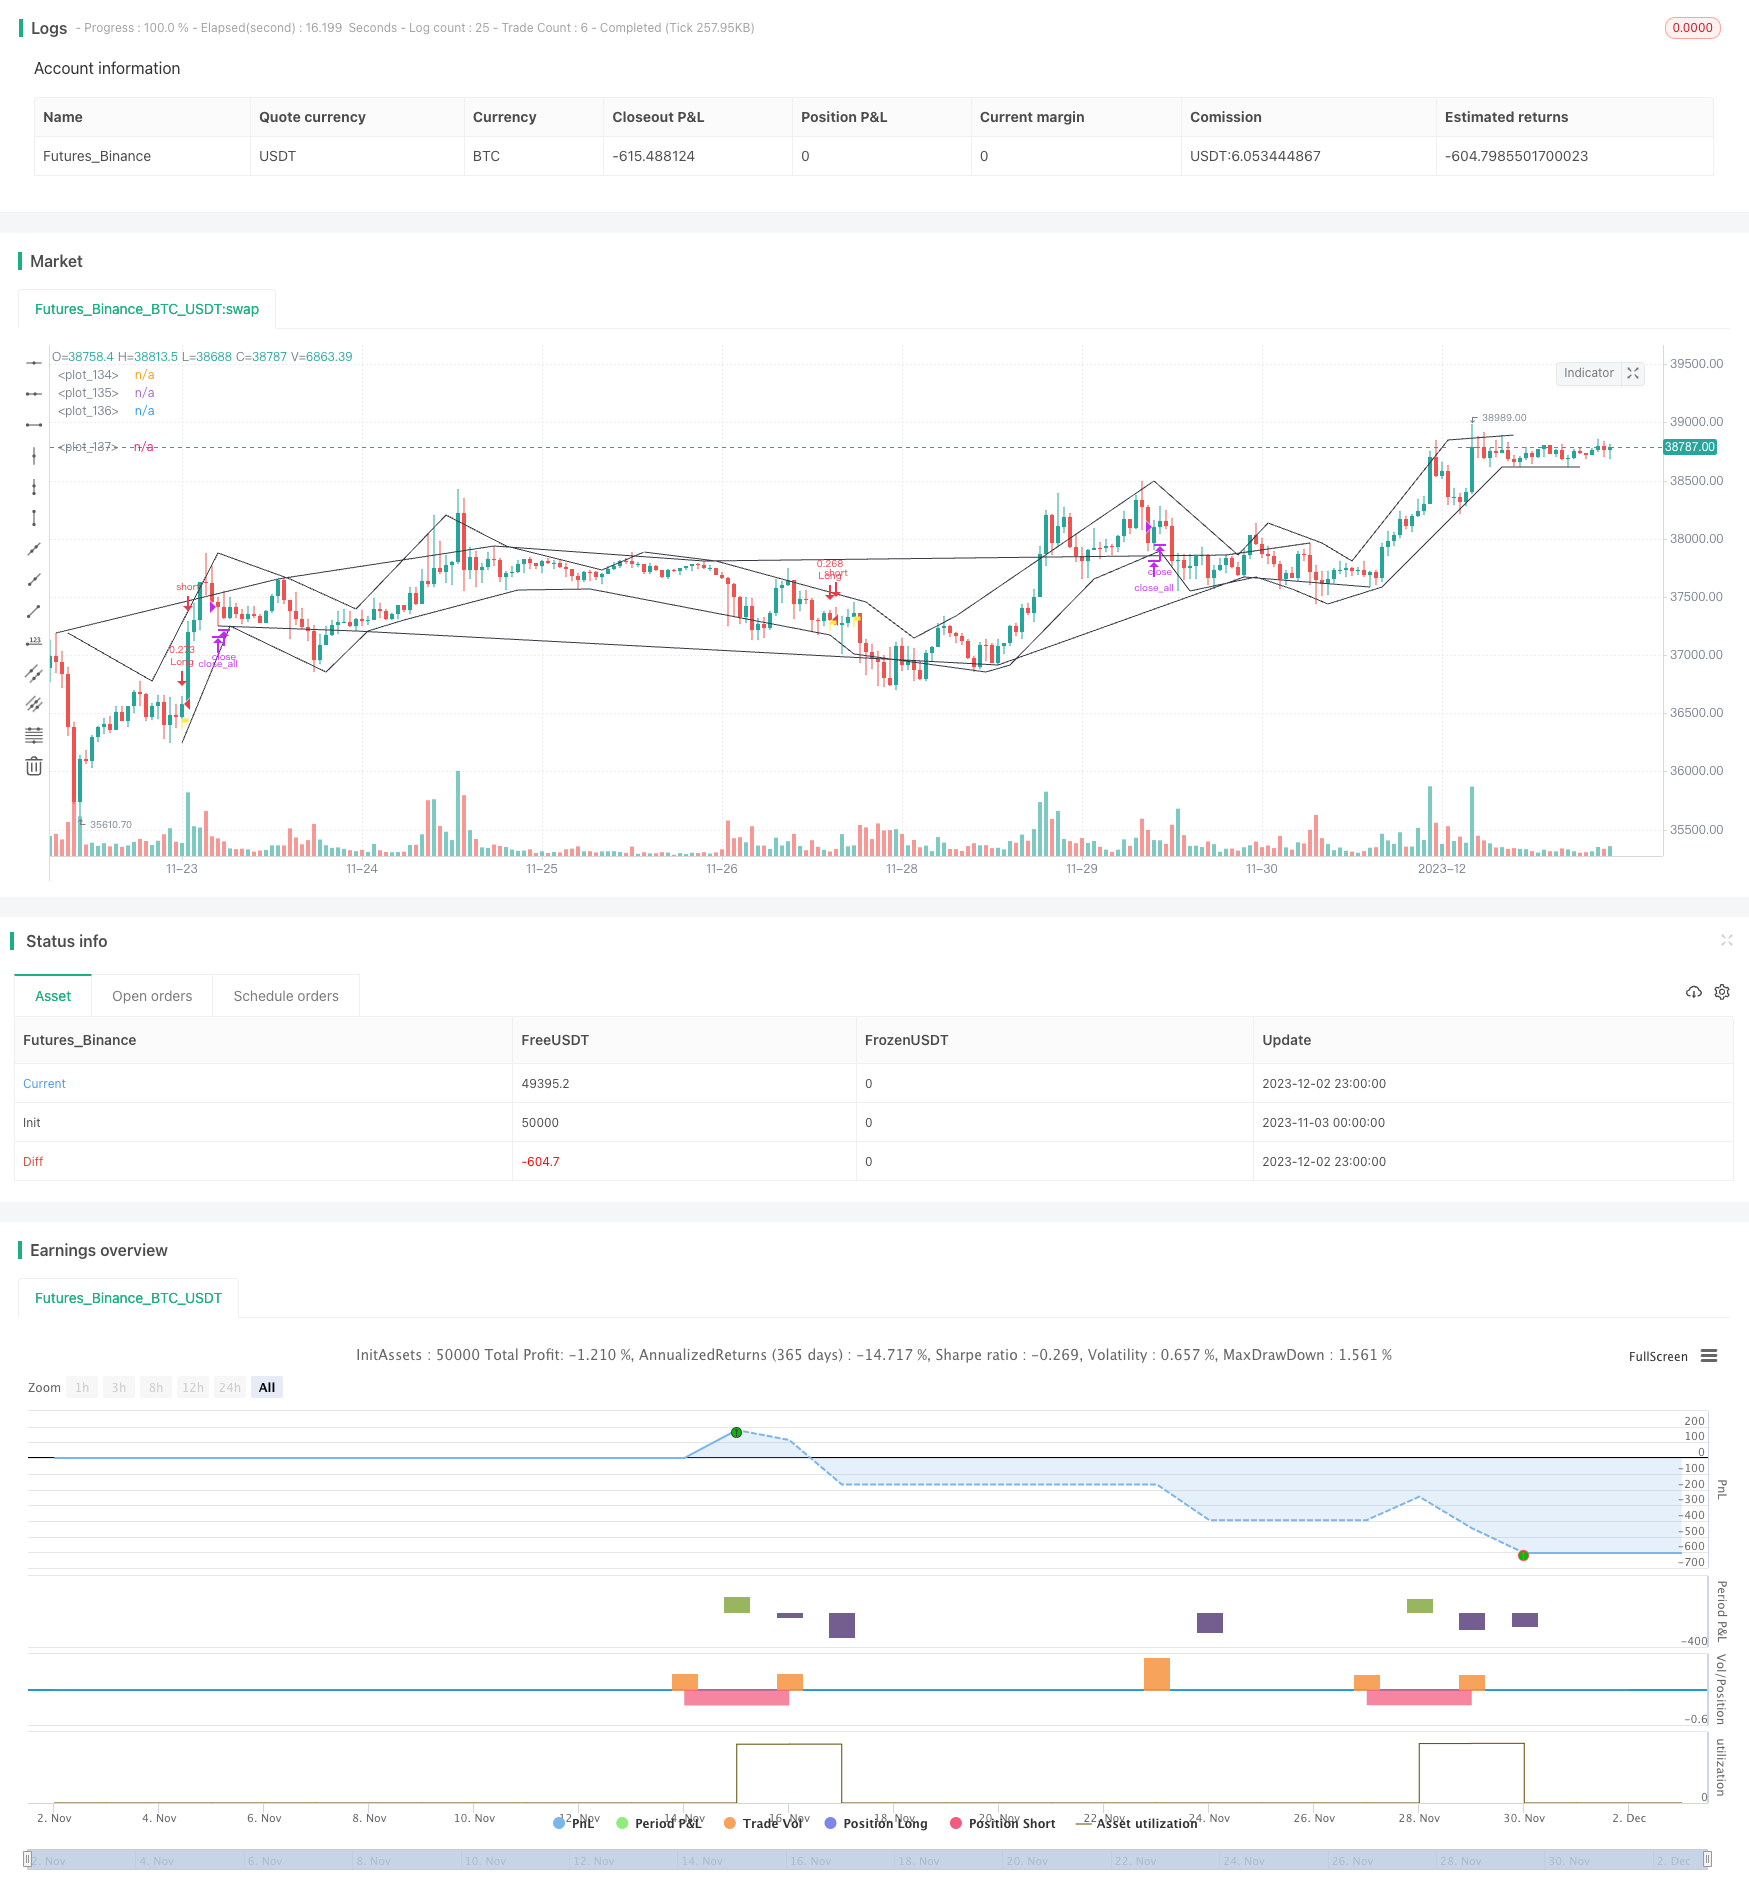
该策略基于价格突破点来识别市场趋势,并结合自适应指标对大趋势进行判断,以捕捉短期价格反转机会。当价格从基准突破通道突破时产生买入/卖出信号。该策略适合于高波动率的数字货币交易。
策略原理
- 识别价格极值点作为通道边界。当价格创出新高或新低时,把该点作为通道边界。
- 计算自适应波动指标MA,判断整体趋势方向。MA值越大表示目前处于震荡阶段。
- 当价格向上突破通道上沿时,产生买入信号;当价格向下突破通道下沿时,产生卖出信号。
- 设置止损点。长仓头寸止损点设置为入场价格的1%。
优势分析
- 价格通道具有自适应性,能准确判断趋势转折点。
- 波动指标判断大趋势,避免在震荡趋势中错过大方向。
- 反转策略,适合捕捉价格短期反弹。
风险分析
- 大幅度持续下跌行情中,容易触发多个止损点,造成较大亏损。
- 震荡盘整中,频繁买入卖出交易增加交易费用。
- 需要人工确定入场时间,全自动交易有过拟合风险。
优化方向
- 优化MA的参数,使其更好地判断整体走势。
- 增加量能指标,避免量能衰竭的反转信号。
- 增加机器学习模型,实现参数的动态优化。
总结
该策略整体思路清晰,具有一定的实用价值。但仍需注意控制交易风险,防止在特定行情下造成较大损失。下一步可从整体框架、指标参数、风险控制等多个维度进行优化,使策略参数和交易信号更加可靠。
||
Overview
This strategy identifies market trends based on price breakthrough points and uses adaptive indicators to determine the overall trend in order to capture short-term price reversal opportunities. It generates buy/sell signals when prices break out of the baseline channel. The strategy is suitable for trading highly volatile cryptocurrencies.
Strategy Logic
- Identify extreme price points as channel boundaries. When prices hit new highs or lows, set those points as channel boundaries.
- Calculate the adaptive volatility MA indicator to determine the overall trend direction. Larger MA values indicate the market is currently in a volatile stage.
- Generate buy signals when prices break above the channel top, and sell signals when prices break below the channel bottom.
- Set stop loss points. Long position stop loss points are set at 1% below the entry price.
Advantage Analysis
- The price channel is adaptive and can accurately determine trend reversal points.
- The volatility indicator judges the overall trend and avoids missing the big picture in volatile markets.
- As a reversal strategy, it is suitable to capture short-term price bounces.
Risk Analysis
- In a sustained downtrend, multiple stop loss points may be triggered resulting in large losses.
- Frequent buy and sell trades in ranging markets increase transaction costs.
- Requires manual determination of entry times. Fully automated trading has overfitting risks.
Optimization Directions
- Optimize MA parameters to better determine overall trends.
- Incorporate volume indicators to avoid reversal signals in volume exhaustion scenarios.
- Add machine learning models to enable dynamic parameter optimization.
Summary
The overall logic of this strategy is clear and has some practical value. However, trading risks should still be controlled to prevent large losses in certain market conditions. Next steps include optimizing multiple dimensions such as the overall framework, indicator parameters, and risk control to make the strategy parameters and trading signals more reliable.
[/trans]
Strategy Arguments
| Argument | Default | Description |
|---|---|---|
| v_input_1 | 13 | Start Date |
| v_input_2 | 9 | Start Month |
| v_input_3 | 2021 | Start Year |
| v_input_4 | true | filter Bill Williams Fractals: |
| v_input_5 | true | Filter fractals using extreme method: |
| v_input_6 | 2 | Extreme Window: |
| v_input_7 | true | ShowSwingsHL |
| v_input_8 | true | showchannel |
| v_input_9 | true | showZigZag |
| v_input_10 | 2 | VolumeMA |
| v_input_11 | 0.01 | Long Stop Loss (%) |
Source (PineScript)
/*backtest
start: 2023-11-03 00:00:00
end: 2023-12-03 00:00:00
period: 1h
basePeriod: 15m
exchanges: [{"eid":"Futures_Binance","currency":"BTC_USDT"}]
*/

// @version = 4
// This source code is subject to the terms of the Mozilla Public License 2.0 at https://mozilla.org/MPL/2.0/
// © TradingGroundhog


//  ||---   Cash & Date:
cash_amout = 10000
pyramid_val = 1
cash_given_per_lot = cash_amout/pyramid_val
startDate = input(title="Start Date",defval=13)
startMonth = input(title="Start Month",defval=9)
startYear = input(title="Start Year",defval=2021)
afterStartDate = (time >= timestamp(syminfo.timezone,startYear, startMonth, startDate, 0, 0))
//  ||------------------------------------------------------------------------------------------------------


//  ||---   Strategy:
strategy(title="TradingGroundhog - Strategy & Fractal V1 - Short term", overlay=true, max_bars_back = 4000, max_labels_count=500, commission_type=strategy.commission.percent, commission_value=0.00,default_qty_type=strategy.cash, default_qty_value= cash_given_per_lot, pyramiding=pyramid_val)
//  ||------------------------------------------------------------------------------------------------------


//  ||---   Fractal Recognition:
filterBW = input(true, title="filter Bill Williams Fractals:")
filterFractals = input(true, title="Filter fractals using extreme method:")
length = input(2, title="Extreme Window:")
regulartopfractal = high[4] < high[3] and high[3] < high[2] and high[2] > high[1] and high[1] > high[0]
regularbotfractal = low[4] > low[3] and low[3] > low[2] and low[2] < low[1] and low[1] < low[0]
billwtopfractal = filterBW ? false : (high[4] < high[2] and high[3] < high[2] and high[2] > high[1] and high[2] > high[0] ? true : false)
billwbotfractal = filterBW ? false : (low[4] > low[2] and low[3] > low[2] and low[2] < low[1] and low[2] < low[0] ? true : false)
ftop = filterBW ? regulartopfractal : regulartopfractal or billwtopfractal
fbot = filterBW ? regularbotfractal : regularbotfractal or billwbotfractal
topf = ftop ? high[2] >= highest(high, length) ? true : false : false
botf = fbot ? low[2] <= lowest(low, length) ? true : false : false
filteredtopf = filterFractals ? topf : ftop
filteredbotf = filterFractals ? botf : fbot
//  ||------------------------------------------------------------------------------------------------------


//  ||---   V1 : Added Swing High/Low Option
ShowSwingsHL = input(true)
highswings = filteredtopf == false ? na : valuewhen(filteredtopf == true, high[2], 2) < valuewhen(filteredtopf == true, high[2], 1) and valuewhen(filteredtopf == true, high[2], 1) > valuewhen(filteredtopf == true, high[2], 0)
lowswings = filteredbotf == false ? na : valuewhen(filteredbotf == true, low[2], 2) > valuewhen(filteredbotf == true, low[2], 1) and valuewhen(filteredbotf == true, low[2], 1) < valuewhen(filteredbotf == true, low[2], 0)
//---------------------------------------------------------------------------------------------------------


//  ||---   V2 : Plot Lines based on the fractals.
showchannel = input(true)
//---------------------------------------------------------------------------------------------------------


//  ||---   ZigZag:
showZigZag = input(true)
//----------------------------------------------------------------------------------------------------------


//  ||---   Fractal computation:
istop = filteredtopf ? true : false
isbot = filteredbotf ? true : false
topcount = barssince(istop)
botcount = barssince(isbot)
vamp = input(title="VolumeMA",  defval=2)
vam = sma(volume, vamp)
fractalup = 0.0
fractaldown = 0.0
up = high[3]>high[4] and high[4]>high[5] and high[2]<high[3] and high[1]<high[2] and volume[3]>vam[3]
down = low[3]<low[4] and low[4]<low[5] and low[2]>low[3] and low[1]>low[2] and volume[3]>vam[3]
fractalup :=  up ? high[3] : fractalup[1]
fractaldown := down ? low[3] : fractaldown[1]
//----------------------------------------------------------------------------------------------------------


//  ||---   Fractal save:
fractaldown_save = array.new_float(0)
for i = 0 to 4000
    if array.size(fractaldown_save) < 3
        if array.size(fractaldown_save) == 0
            array.push(fractaldown_save, fractaldown[i])
        else
            if fractaldown[i] != array.get(fractaldown_save, array.size(fractaldown_save)-1)
                array.push(fractaldown_save, fractaldown[i])
if array.size(fractaldown_save) < 3
    array.push(fractaldown_save, fractaldown)
    array.push(fractaldown_save, fractaldown)
fractalup_save = array.new_float(0)
for i = 0 to 4000
    if array.size(fractalup_save) < 3
        if array.size(fractalup_save) == 0
            array.push(fractalup_save, fractalup[i])
        else
            if fractalup[i] != array.get(fractalup_save, array.size(fractalup_save)-1)
                array.push(fractalup_save, fractalup[i])
if array.size(fractalup_save) < 3
    array.push(fractalup_save, fractalup)
    array.push(fractalup_save, fractalup)
Bottom_1 = array.get(fractaldown_save,  0)
Bottom_2 = array.get(fractaldown_save,  1)
Bottom_3 = array.get(fractaldown_save,  2)
Top_1 = array.get(fractalup_save, 0)
Top_2 = array.get(fractalup_save, 1)
Top_3 = array.get(fractalup_save, 2)
//----------------------------------------------------------------------------------------------------------


//  ||---   Fractal Buy Sell Signal:
bool Signal_Test = false
bool Signal_Test_OUT_TEMP = false
var Signal_Test_TEMP = false
longLossPerc = input(title="Long Stop Loss (%)", minval=0.0, step=0.1, defval=0.01) * 0.01
if filteredbotf and open < Bottom_1 and (Bottom_1 - open) / Bottom_1 >= longLossPerc
    Signal_Test := true
if filteredtopf and open > Top_1
    Signal_Test_TEMP := true
if filteredtopf and Signal_Test_TEMP
    Signal_Test_TEMP := false
    Signal_Test_OUT_TEMP := true
//----------------------------------------------------------------------------------------------------------


//  ||---   Plotting:
//plotshape(filteredtopf, style=shape.triangledown, location=location.abovebar, color=color.red, text="•", offset=0)
//plotshape(filteredbotf, style=shape.triangleup, location=location.belowbar, color=color.lime, text="•", offset=0)
//plotshape(ShowSwingsHL ? highswings : na, style=shape.triangledown, location=location.abovebar, color=color.maroon, text="H", offset=0)
//plotshape(ShowSwingsHL ? lowswings : na, style=shape.triangleup, location=location.belowbar, color=color.green, text="L", offset=0)
plot(showchannel ? (filteredtopf ? high[2] : na) : na, color=color.black, offset=0)
plot(showchannel ? (filteredbotf ? low[2] : na) : na, color=color.black, offset=0)
plot(showchannel ? (highswings ? high[2] : na) : na, color=color.black, offset=-2)
plot(showchannel ? (lowswings ? low[2] : na) : na, color=color.black, offset=-2)
plotshape(Signal_Test, style=shape.flag, location=location.belowbar, color=color.yellow, offset=0)
plotshape(Signal_Test_OUT_TEMP, style=shape.flag, location=location.abovebar, color=color.white, offset=0)
//----------------------------------------------------------------------------------------------------------


//  ||---   Buy And Sell:
strategy.entry(id="Long", long=true, when = Signal_Test and afterStartDate)
strategy.close_all(when = Signal_Test_OUT_TEMP and afterStartDate)
//----------------------------------------------------------------------------------------------------------
Detail
https://www.fmz.com/strategy/434177
Last Modified
2023-12-04 14:34:13