
10 KiB
Name
基于价格反转的TTM银隼震荡策略TTM-Falcon-Oscillator-Reversal-Strategy-Based-on-Price-Reversion
Author
ChaoZhang
Strategy Description
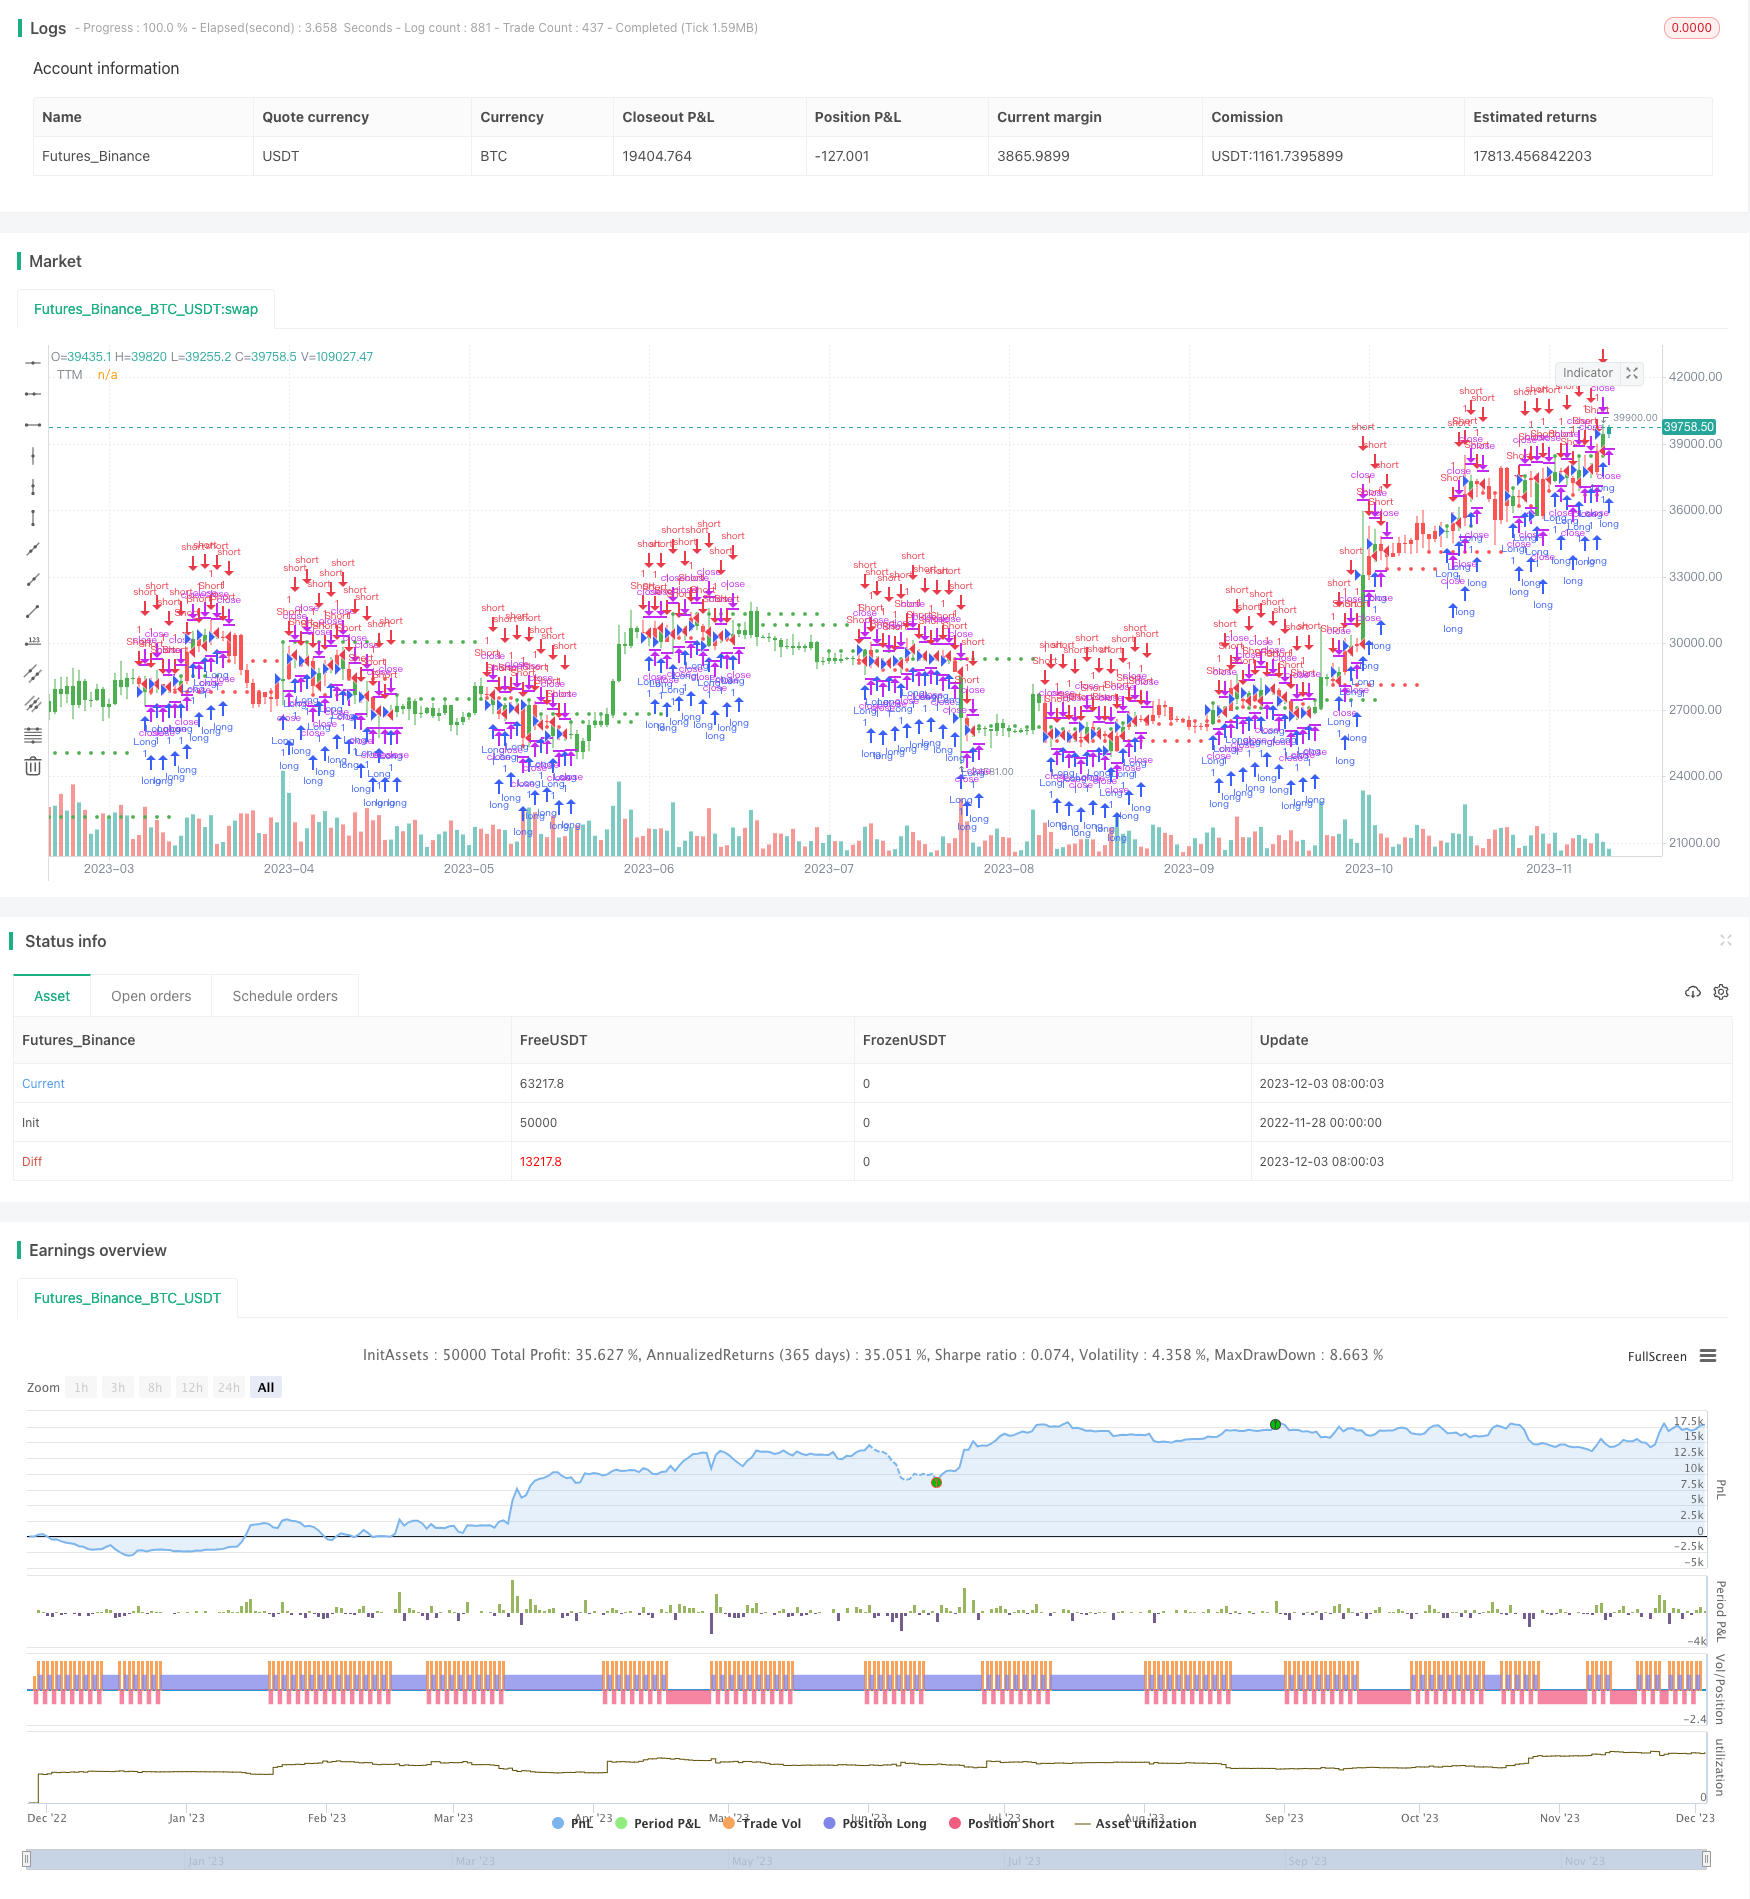 [trans]
概述
该策略名称为“基于价格反转的TTM银隼震荡策略”(TTM Falcon Oscillator Reversal Strategy)。它是一个利用价格反转信号来寻找买卖点的震荡指标。
该策略的主要思想是利用价格形态判断趋势反转,当价格出现三根K线形成新的高点或低点时,判断为价格反转信号,采取相应的做多做空操作。
策略原理
该策略通过观察K线的收盘价变化判断价格反转。具体逻辑是:
- 当第一根K线的收盘价低于第二根K线的收盘价时,记录信号为1;当第一根K线的收盘价高于第二根K线的收盘价时,记录信号为0。
- 如果上一个信号为1(代表价格下跌),同时第二根K线和第三根K线中有任意一根K线的收盘价低于第一根K线的收盘价,则判断为价格反转信号,发出卖出信号。
- 如果上一个信号为0(代表价格上涨),同时第二根K线和第三根K线中有任意一根K线的收盘价高于第一根K线的收盘价,则判断为价格反转信号,发出买入信号。
通过这个方法,该策略能快速判断价格反转,在反转点前后及时入场。
策略优势
该策略主要有以下优势:
-
反应迅速。通过仅比较三根K线的大小关系来判断价格反转,能够快速判断市场反转点,及时入场。
-
减少交易频率。相比其他震荡策略,该策略只在价格明确反转时才发出信号,可以有效减少不必要的交易次数。
-
parameter优化空间大。策略优化潜力大,可调整K线周期参数以适应不同市场环境。
-
可量化回测。该策略可直接在量化平台中实现自动回测,大幅提高测试效率。
-
逻辑简单易理解。新手交易者也易于理解和掌握该策略的核心逻辑。
策略风险
该策略也存在一定的风险,主要体现在:
-
价格震荡范围大。当价格波动过于剧烈时,反转信号可能不准确,容易追高杀低。
-
参数优化难度大。K线周期参数的选择对策略表现有很大影响,需要大量优化找到最佳参数组合。
-
交易次数过于频繁。在某些市场环境下,反转信号可能过于频繁,造成交易次数过多。
-
反转时间无法确定。该策略无法判断价格反转后新的趋势会持续多久,存在无法持有趋势的风险。
对应解决方法是:适当调整参数缩小价格波动范围,在多种市场环境中充分优化测试,并设置止损以控制单笔损失。
策略优化方向
该策略主要可从以下几个方向进行优化:
-
K线周期优化。适当调整K线的时间周期参数,找到最佳的参数组合。
-
增加过滤条件。在发出信号前增加其他辅助条件判断,避免错误信号。
-
增加止损机制。设置合理的止损点,控制单笔损失。
-
结合其他指标。融合均线、波动率等其他指标信号,提高决策准确性。
-
参数自适应优化。让参数能根据市场环境变化而动态调整,使策略更具鲁棒性。
通过这些优化,可以大幅提升策略的稳定性、胜率和盈利能力。
总结
总的来说,该策略利用价格形态判断反转点的思路非常简单直接,逻辑清晰易于理解,且参数优化空间较大,可按照个人偏好进行调整。但也存在一定概率上signal过于频繁和持仓时间控制不当的风险。通过严格的回测和稳健的参数优化,该策略可以成为高效盈利的震荡类交易策略之一。 ||
Overview
The strategy is named "TTM Falcon Oscillator Reversal Strategy Based on Price Reversion". It is an oscillator indicator that searches for trading signals based on price reversal signals.
The main idea of the strategy is to judge trend reversals by using price patterns. When the price forms three new highs or lows K-line bars, it is judged as a price reversal signal to take corresponding long or short positions.
Strategy Logic
The strategy judges price reversals by observing the closing price changes of K-line bars. The specific logic is:
-
When the closing price of the first K-line bar is lower than the second one, the signal is recorded as 1; when higher, the signal is recorded as 0.
-
If the previous signal was 1 (representing a price decline), and the closing price of either the second or the third K-line bar is lower than the first one, it is judged as a price reversal signal and a sell signal is issued.
-
If the previous signal was 0 (representing a price rise), and the closing price of either the second or the third K-line bar is higher than the first one, it is judged as a price reversal signal and a buy signal is issued.
Through this method, the strategy can quickly judge price reversals and enter positions in time around reversal points.
Advantage Analysis
The main advantages of this strategy are:
-
Fast reaction. By only comparing the size relationship among three K-line bars to judge price reversals, it can quickly determine market reversal points and enter positions in time.
-
Reduced trading frequency. Compared with other oscillator strategies, this strategy only issues signals when prices clearly reverse, which can effectively reduce unnecessary trades.
-
Large optimization space for parameters. The strategy has great potential for optimization and the K-line cycle parameters can be adjusted to adapt to different market environments.
-
Quantifiable backtesting. The strategy can be directly implemented for automated backtesting on quantitative platforms, greatly improving test efficiency.
-
Simple and easy to understand logic. novice traders can also easily understand and grasp the core logic of the strategy.
Risk Analysis
The strategy also has certain risks, mainly embodied in:
-
Large price fluctuation range. When the price fluctuates too violently, the reversal signals may be inaccurate, prone to chasing highs and selling lows.
-
Difficult parameter optimization. The choice of K-line cycle parameters has a great influence on the strategy's performance, requiring a lot of optimization to find the optimal parameter combination.
-
Excessively frequent trading. In some market environments, reversal signals may be too frequent, resulting in too many trades.
-
Unpredictable reversal duration. The strategy cannot determine how long the new trend after price reversal will last, with the risk of inability to hold the trend.
The corresponding solutions are: appropriately adjust parameters to reduce price fluctuation ranges, fully optimize and test under various market environments, and set stop loss to control single loss.
Optimization Directions
The main directions for optimizing this strategy include:
-
K-line cycle optimization. Appropriately adjust the time cycle parameters of K-line to find the optimal parameter combination.
-
Add filtering conditions. Add other auxiliary conditions before issuing signals to avoid erroneous signals.
-
Add stop loss mechanism. Set reasonable stop loss points to control single losses.
-
Combine other indicators. Integrate signals of moving average, volatility and other indicators to improve decision accuracy.
-
Adaptive parameter optimization. Allow parameters to dynamically adjust based on market environment changes to make the strategy more robust.
Through these optimizations, the stability, win rate and profitability of the strategy can be greatly improved.
Conclusion
In summary, the idea of this strategy to determine reversal points by price patterns is very simple and straightforward, with clear and easy to understand logic, and relatively large space for parameter optimization that can be adjusted according to personal preferences. But there are also certain risks that the signals may be too frequent and the holding period control improper. Through rigorous backtesting and robust parameter optimization, this strategy can become one of the efficient and profitable oscillator trading strategies.
[/trans]
Strategy Arguments
| Argument | Default | Description |
|---|---|---|
| v_input_1 | false | Trade reverse |
Source (PineScript)
/*backtest
start: 2022-11-28 00:00:00
end: 2023-12-04 00:00:00
period: 1d
basePeriod: 1h
exchanges: [{"eid":"Futures_Binance","currency":"BTC_USDT"}]
*/

//@version=2
////////////////////////////////////////////////////////////
//  Copyright by HPotter v2.0 10/01/2018
// TTM scalper indicator of John Carter’s Scalper Buys and Sells. The methodology
// is a close approximation of the one described in his book Mastering the Trade.
// The book is highly recommended. Note the squares are not real-time but will
// show up once the third bar has confirmed a reversal.
//
//You can change long to short in the Input Settings
//WARNING:
//- For purpose educate only
//- This script to change bars colors.
////////////////////////////////////////////////////////////
strategy(title="TTM scalper indicator", overlay = true)
reverse = input(false, title="Trade reverse")
triggerSell = iff(iff(close[1] < close,1,0) and (close[2] < close[1] or close[3] <close[1]),1,0)
triggerBuy = iff(iff(close[1] > close,1,0) and (close[2] > close[1] or close[3] > close[1]),1,0)
buySellSwitch = iff(triggerSell, 1, iff(triggerBuy, 0, nz(buySellSwitch[1])))
SBS = iff(triggerSell and buySellSwitch[1] == false, high, iff(triggerBuy and buySellSwitch[1], low, nz(SBS[1])))
clr_s = iff(triggerSell and buySellSwitch[1] == false, 1, iff(triggerBuy and buySellSwitch[1], 0, nz(clr_s[1])))
clr = iff(clr_s == 0 , red , green)
pos = iff(clr == green, 1,
       iff(clr == red, -1, nz(pos[1], 0)))
possig = iff(reverse and pos == 1, -1,
          iff(reverse and pos == -1, 1, pos))
if (possig == 1)
    strategy.entry("Long", strategy.long)
if (possig == -1)
    strategy.entry("Short", strategy.short)
barcolor(possig == -1 ? red: possig == 1 ? green : blue )
plot(SBS, color=clr, title="TTM", style = circles, linewidth = 2)
Detail
https://www.fmz.com/strategy/434330
Last Modified
2023-12-05 15:07:10