
9.5 KiB
Name
基于交易量震荡指标的长短线交叉策略Volume-Oscillator-Long-and-Short-Term-Moving-Average-Crossover-Strategy
Author
ChaoZhang
Strategy Description
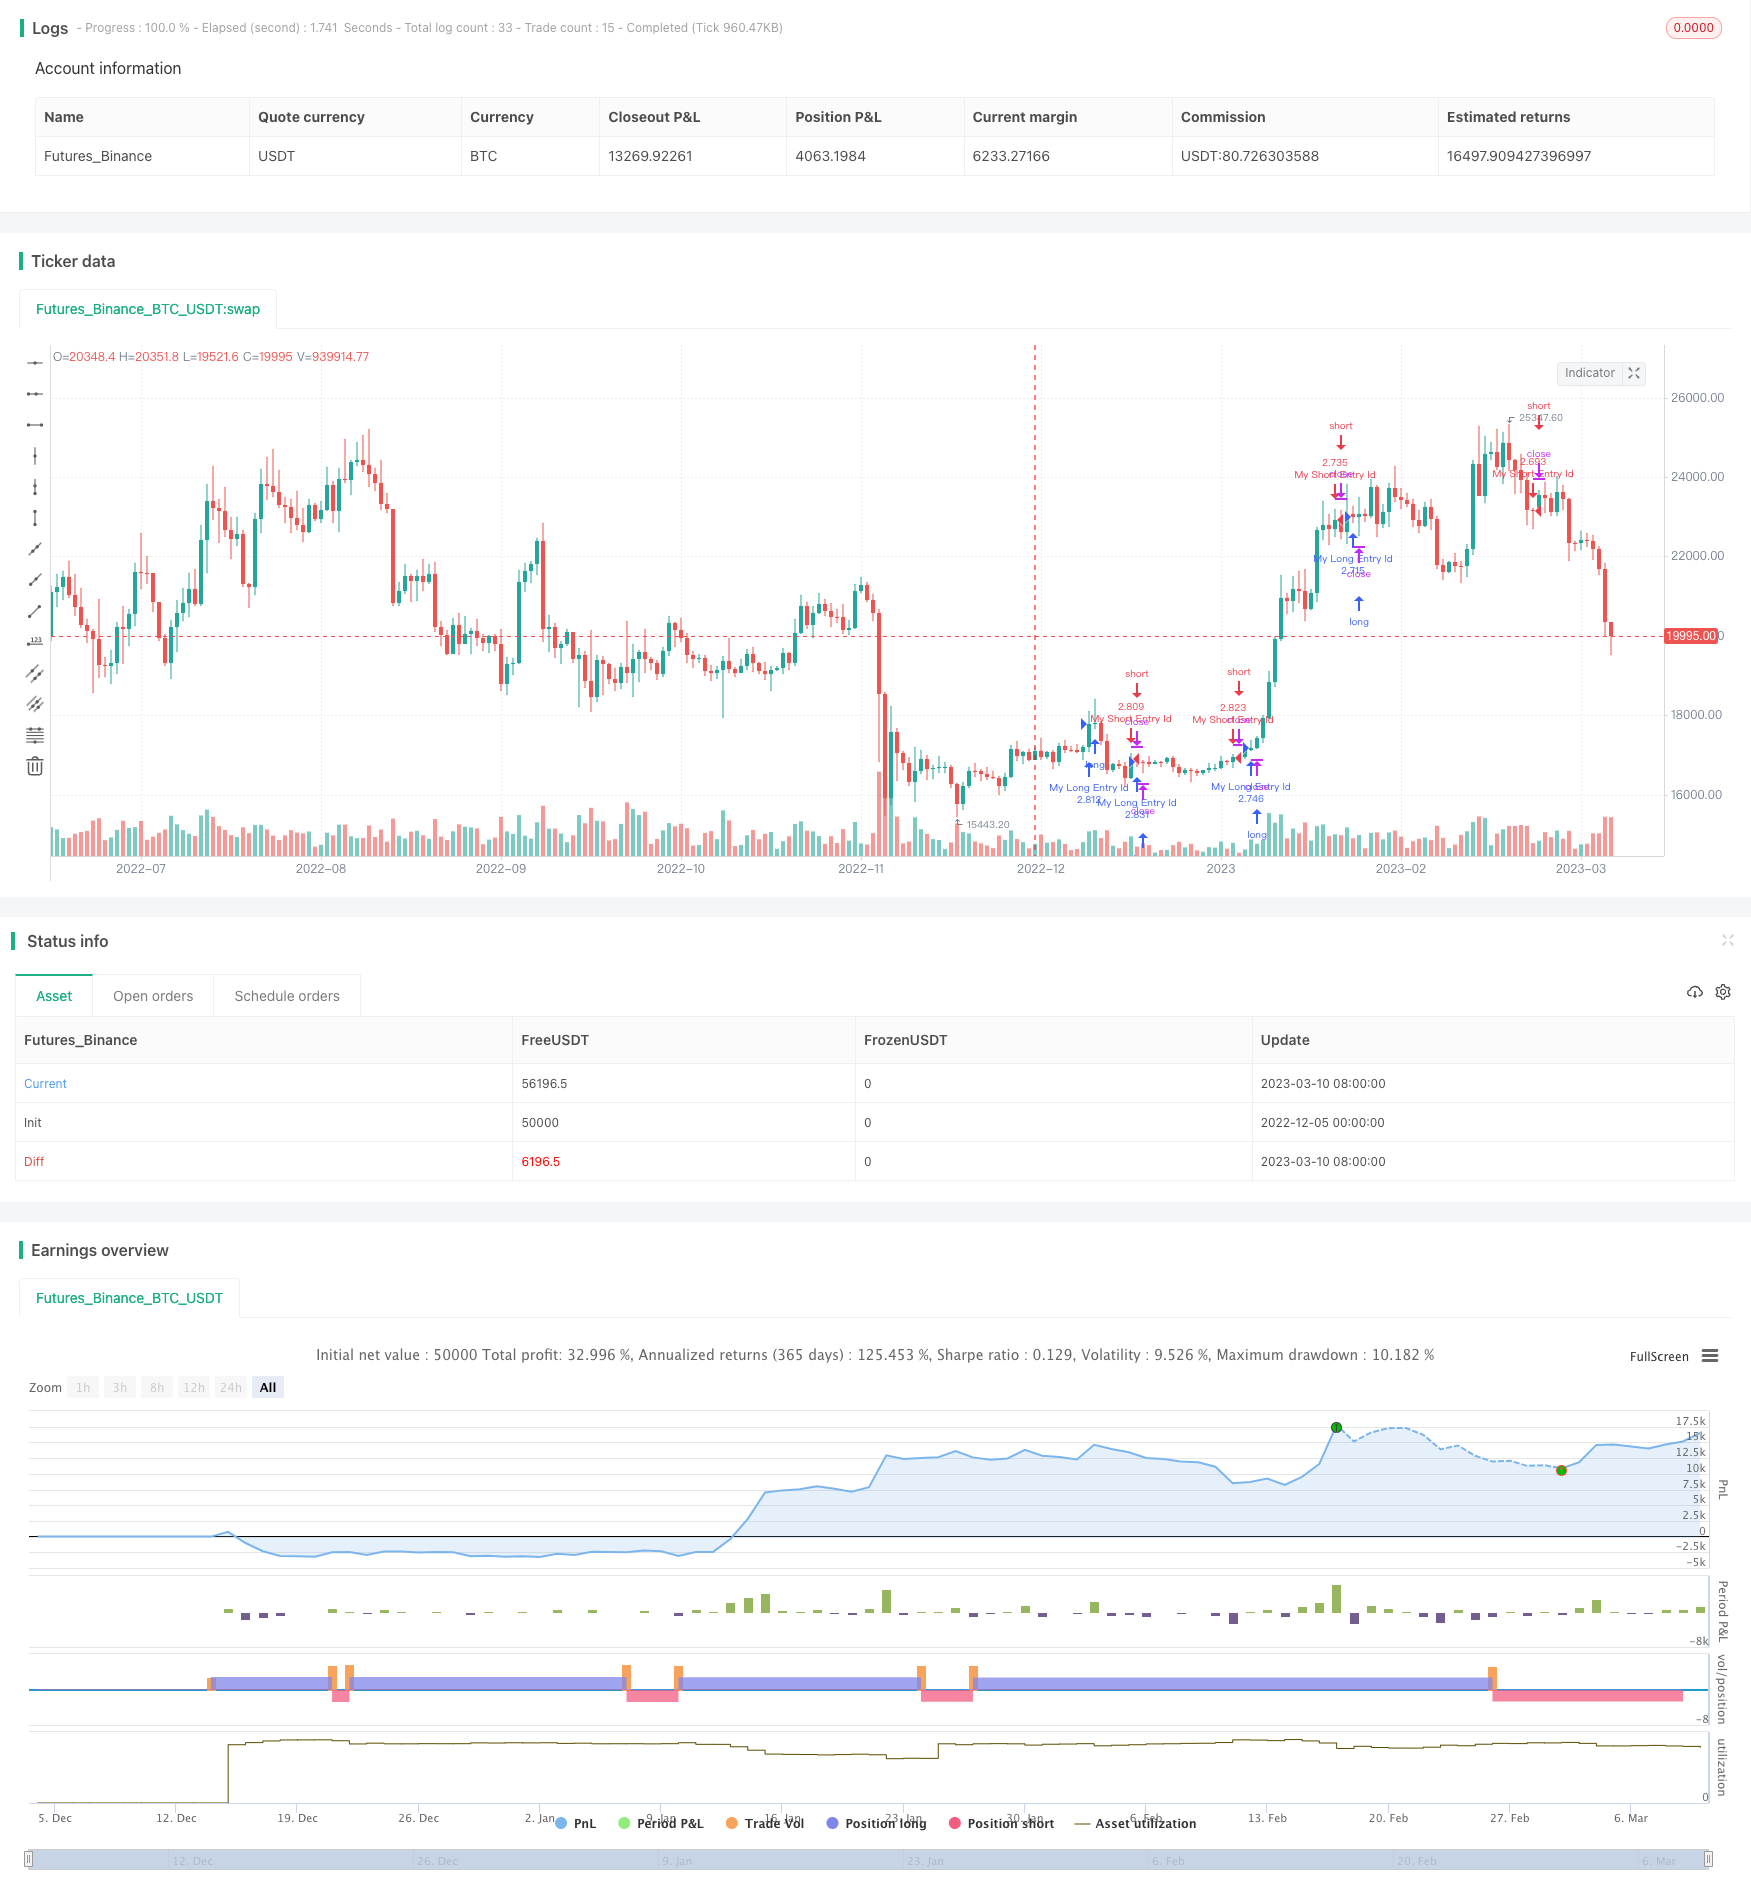
[trans]
概述
该策略是基于交易量的长短期移动平均线交叉实现的。它使用不同周期的EMA来计算交易量的长短期趋势,并通过其差值构建一个震荡指标。当该震荡指标上穿零轴时做多,下穿零轴时做空。此外,它还会结合前一高点和低点来判断具体的操作方向。
策略原理
该策略的核心指标是交易量震荡指标(Volume Oscillator)。它通过长短期交易量指数移动平均线的差值来体现交易量变化趋势。具体计算公式如下:
Volume Oscillator = (ShortEMA - LongEMA) / LongEMA * 100
其中,ShortEMA和LongEMA分别代表短期和长期的指数移动平均线。当ShortEMA上穿LongEMA时,该指标为正,意味着交易量正在扩大;当ShortEMA下穿LongEMA时,该指标为负,意味着交易量正在萎缩。
在计算出该震荡指标后,本策略利用其与零轴的交叉来产生交易信号。当指标由负转正,即上穿零轴时,做多;当指标由正转负,即下穿零轴时,做空。这体现了交易量的势能转换。
此外,策略还会结合前一高低点来判断具体的操作方向。即当指标上穿零轴时,如果前一高点大于前一低点的绝对值,则看多;反之看空。利用此特性可以对交易量扩张的力度做出判断。
策略优势
该策略具有以下几点优势:
-
使用交易量作为基础指标,可以有效判定市场参与者的意愿,具有很强的实用性。
-
结合长短期EMA,可以同时捕捉到中长期趋势和短期动能。
-
指标与零轴交叉形成的交易信号简单明确,容易判断。
-
加入前一高低点来确定具体操作方向,可以有效利用交易量的势能大小。
-
策略思路清晰,参数调整灵活,适应性较强。
策略风险
该策略也存在一些风险需要注意:
-
交易量指标容易受到市场假突破的影响,可能产生错误信号。可以设置止损来控制风险。
-
在震荡行情中,交易量交叉可能频繁,需要合理确认指标转折。
-
前一高低点仅反映最近一次扩张,无法确定其力度的持续性。
-
不同品种和时间段参数需要单独优化,不够通用。
-
交易量指标对高频程序化交易反应迟缓,可能错过最佳入场时机。
策略优化方向
该策略可以从以下几个方面进行优化:
-
增加过滤条件,避免虚假信号,例如加入价格指标的确认。
-
优化长短期EMA的周期参数,使其更符合不同品种的特点。
-
对前一高低点设置周期参数,使用一段时间的最高价和最低价。
-
将指标转折区域设定为区间,避免频繁交易。
-
增加止损策略,控制单笔损失。
-
结合VRP量价指标等其他量价技术指标。
-
利用机器学习方法自动优化参数。
总结
总的来说,基于交易量震荡指标的长短线交叉策略充分利用了交易量转折的特征,判断力较强,在趋势发展初期具有不错的探测性。同时结合前一高低点来确定具体方向,使交易决策更为准确。但也需要注意风险控制,防止虚假信号带来损失。该策略有很大的优化空间,在参数调整和组合指标方面都可以进行扩展,使其trading delay更短,对市场变化反应更快。
||
Overview
This strategy is based on the crossover of long and short term moving averages of trading volume. It uses EMAs of different periods to calculate the long and short term trends of trading volume, and constructs an oscillator based on their difference. It goes long when the oscillator crosses above the zero level, and goes short when crossing below. It also incorporates previous high and low prices to determine the specific direction.
Strategy Logic
The core indicator of this strategy is Volume Oscillator. It reflects the trend of trading volume change by calculating the difference between long term and short term Exponential Moving Averages. The concrete formula is:
Volume Oscillator = (ShortEMA - LongEMA) / LongEMA * 100
Here ShortEMA and LongEMA refer to short term and long term EMAs respectively. When ShortEMA crosses over LongEMA, the indicator turns positive, implying expanding trading volume. When ShortEMA crosses below LongEMA, the indicator turns negative, implying contracting trading volume.
After calculating the oscillator, this strategy uses its crossover with zero level to generate trading signals. It goes long when the oscillator turns from negative to positive, i.e. crossing above zero level, and goes short when turning from positive to negative, i.e. crossing below zero level. This reflects the momentum conversion of trading volume.
In addition, the strategy also incorporates previous high and low prices to determine specific directions. That is when oscillator crossing above zero level, if previous high price is greater than absolute value of previous low price, it implies a long signal, otherwise a short signal. This feature helps judging the strength of volume expansion.
Advantages
This strategy has the following advantages:
-
Using trading volume as the basis indicator can effectively determine market participants' willingness and is very practical.
-
Incorporating both long term and short term EMAs can capture mid-long term trends and short term momentum simultaneously.
-
The crossing signals formed by indicator and zero level is simple and clear for decision making.
-
Adding previous highs and lows to determine directions can make good use of the momentum size of trading volumes.
-
The strategy logic is straightforward, parameters are flexible for adjustment and it has relatively strong adaptivity.
Risks
Some risks of this strategy need to be noted:
-
Volume indicator can be influenced by market false breakouts, generating wrong signals. Stop loss should be set to control risks.
-
In range-bound markets, volume crossovers may happen frequently. Proper confirmation of indicator's turning points is needed.
-
Previous highs and lows only reflect the latest expansion and cannot determine its sustainability.
-
Parameters need separate optimization for different products and time periods. The universality is limited.
-
Volume indicator reacts slowly to high-frequency algorithmic trading, possibly missing the best entry timing.
Optimization Directions
The strategy can be optimized in the following aspects:
-
Adding filters to avoid false signals, e.g. confirming with price indicators.
-
Optimizing periods of long and short term EMAs to match characteristics of different products.
-
Setting period parameters for previous highs and lows to use maximum and minimum prices of a period.
-
Defining a range for indicator's turning area instead of a single level to avoid over-trading.
-
Adding stop loss strategies to control single loss.
-
Incorporating other volume-based indicators like VRP.
-
Using machine learning methods to auto-optimize parameters.
Summary
In summary, the volume oscillator long short term moving average crossover strategy makes good use of volume reversal features and has strong judging power in the initial stage of trends. Adding previous highs and lows to determine directions makes trading decisions more accurate. Risk control is also important to prevent losses from false signals. This strategy has large room for optimization, in aspects like parameter tuning and combining indicators, to shorten its trading delay and reaction time to market changes.
[/trans]
Strategy Arguments
| Argument | Default | Description |
|---|---|---|
| v_input_1 | 5 | shortlen |
| v_input_2 | 10 | longlen |
| v_input_3 | false | zero |
| v_input_4 | false | low_val |
| v_input_5 | false | high_val |
| v_input_6 | false | prev_high_val |
| v_input_7 | false | prev_low_val |
| v_input_8 | false | where |
Source (PineScript)
/*backtest
start: 2022-12-05 00:00:00
end: 2023-03-11 00:00:00
period: 1d
basePeriod: 1h
exchanges: [{"eid":"Futures_Binance","currency":"BTC_USDT"}]
*/

//@version=3
strategy("SB_Volume_oscillator_Prev_high_low", overlay=true,default_qty_type = strategy.percent_of_equity, default_qty_value = 100)

shortlen = input(5, minval=1)
longlen = input(10, minval=1)
short = ema(volume, shortlen)
long = ema(volume, longlen)
osc = 100 * (short - long) / long
//hline(0, title="Zero")
//plot(osc)
zero=input(0.0)

low_val=input(0.0)
high_val=input(0.0)
prev_high_val=input(0.0)
prev_low_val=input(0.0)
where=input(0)
where:=nz(where[1])
low_val:=nz(low_val[1])
high_val:=nz(high_val[1])
prev_high_val:=nz(prev_high_val[1])
prev_low_val:=nz(prev_low_val[1])
if(crossover(osc,zero))
    high_val:=osc
    where:=1
    prev_low_val:=low_val
    low_val:=osc

if(crossunder(osc,zero))
    low_val:=osc
    where:=-1
    prev_high_val:=high_val
    high_val:=osc

if(where==1)
    if(high_val<osc)
        high_val:=osc

if(where==-1)
    if(low_val>osc)
        low_val:=osc


if (crossover(osc,zero))
    if(prev_high_val<=abs(prev_low_val))
        strategy.entry("My Long Entry Id", strategy.long)
    if(prev_high_val>abs(prev_low_val))
        strategy.entry("My Short Entry Id", strategy.short)

if (crossunder(osc,zero))
    if(prev_high_val<=abs(prev_low_val))
        strategy.entry("My Long Entry Id", strategy.long)
    if(prev_high_val>abs(prev_low_val))
        strategy.entry("My Short Entry Id", strategy.short)
Detail
https://www.fmz.com/strategy/435091
Last Modified
2023-12-12 11:19:04