
5.8 KiB
Name
均线双边振荡交易策略Oscillation-Trading-Strategy-Between-Moving-Averages
Author
ChaoZhang
Strategy Description
 [trans]
概述
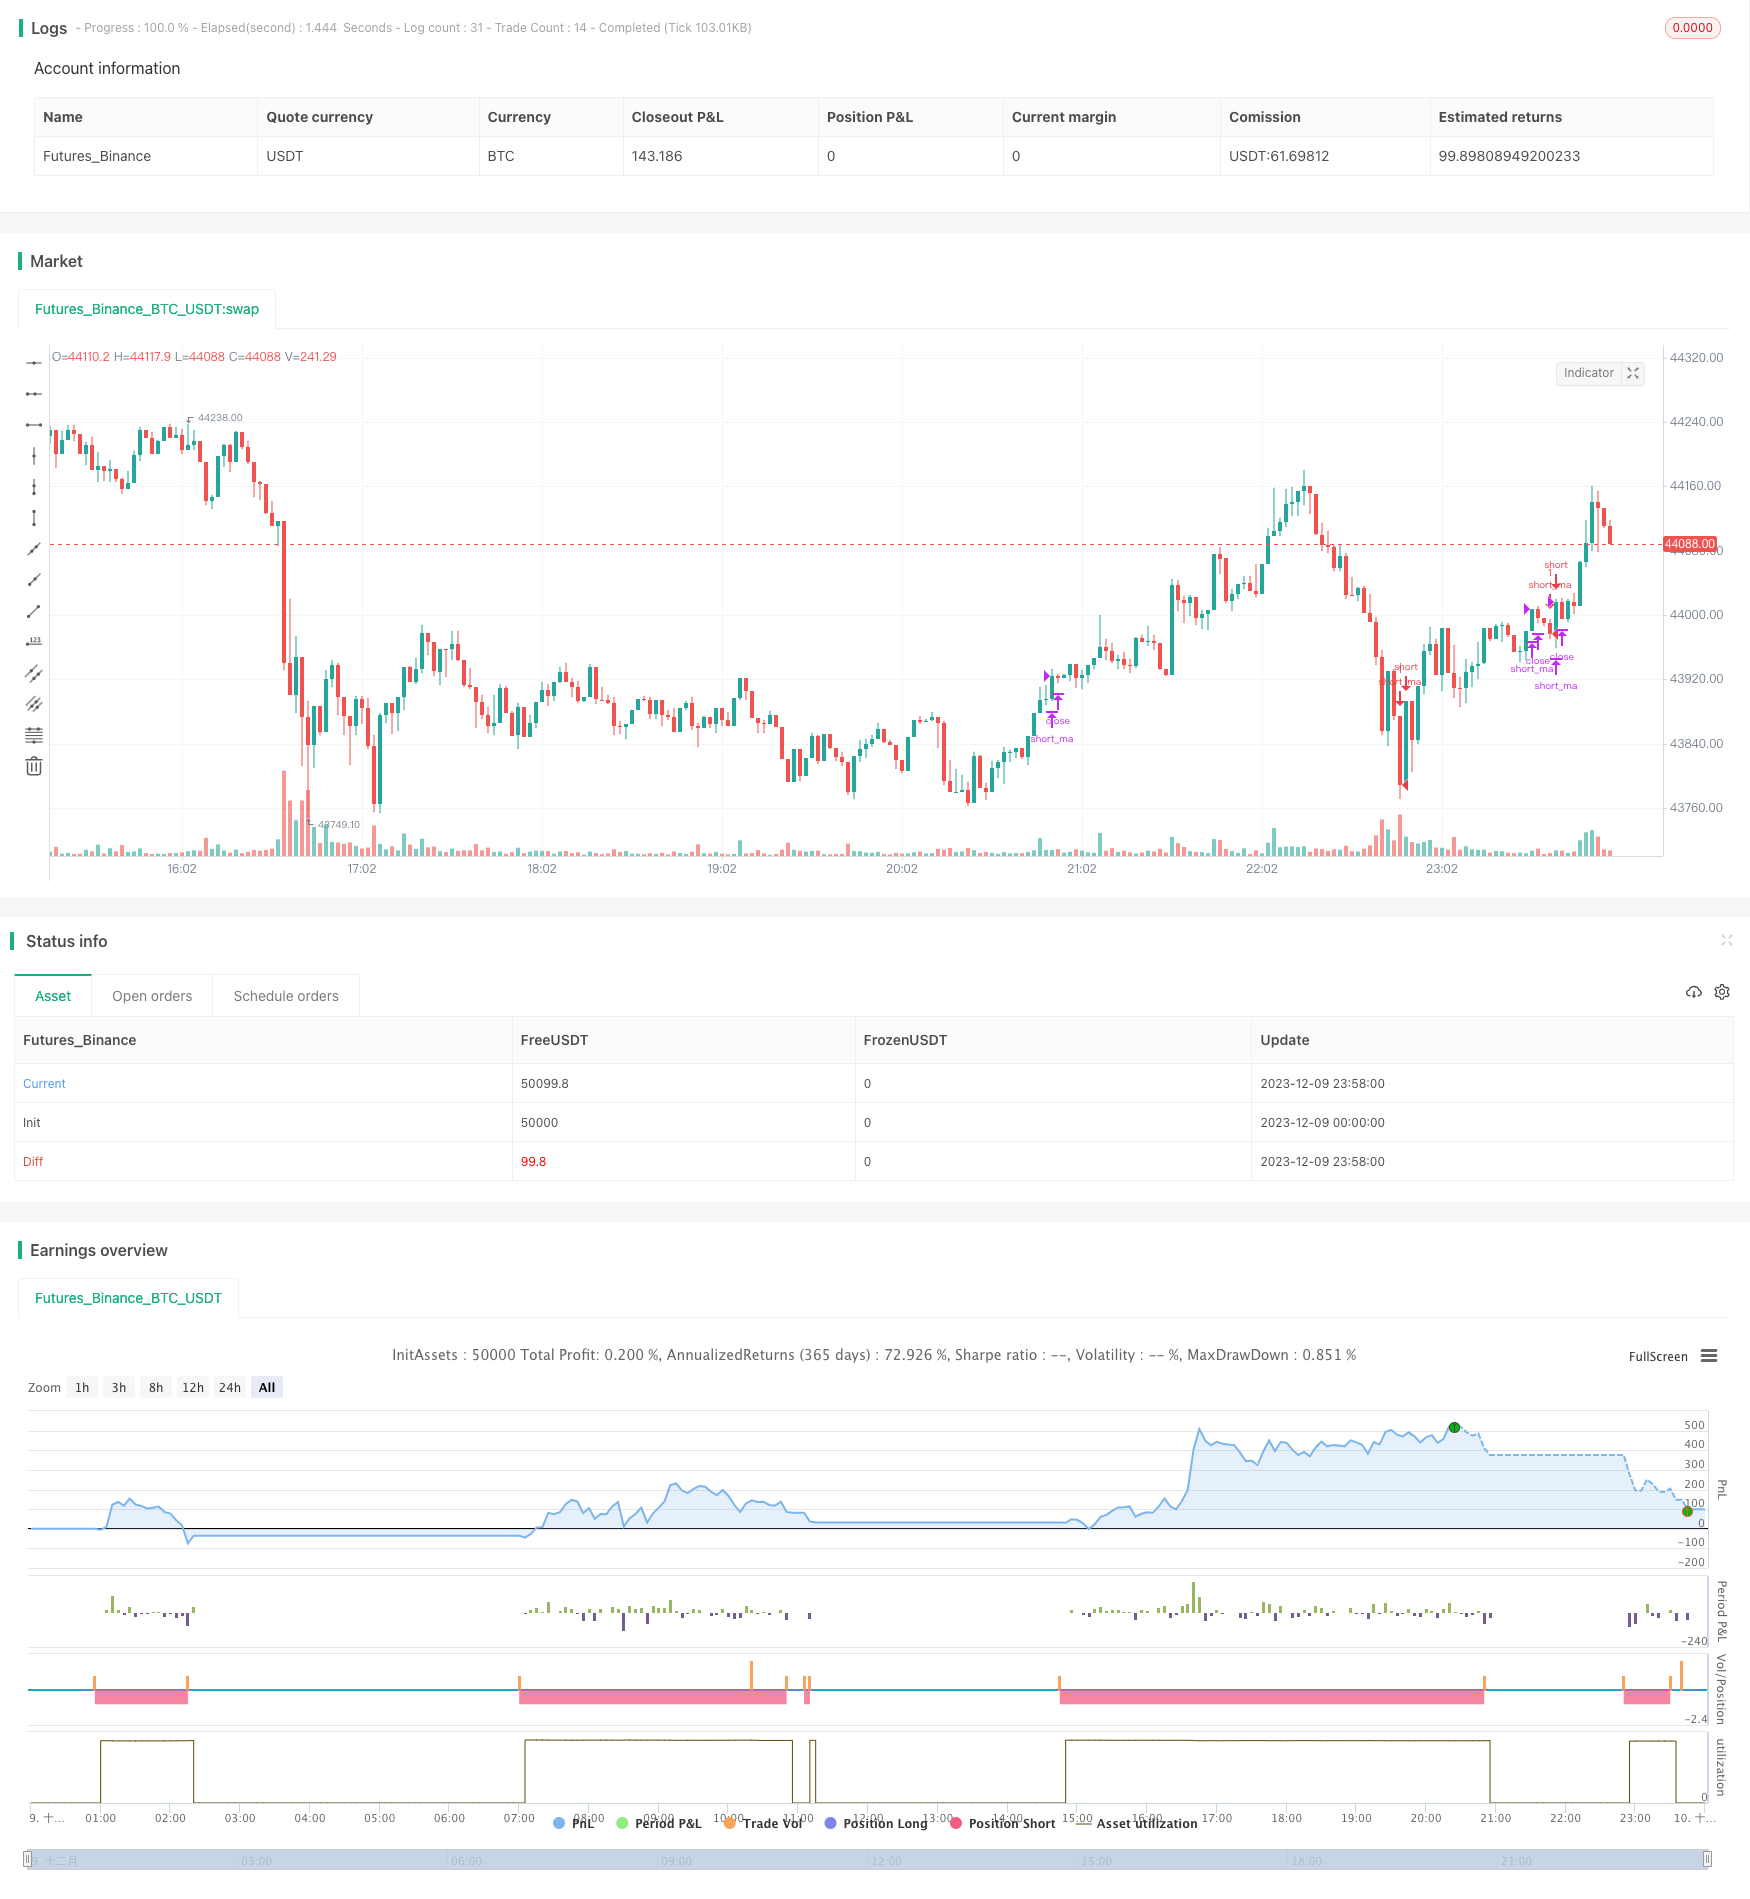
该策略结合了移动平均线指标和布林带指标,实现了在均线之间进行双边交易的策略。当价格上破下轨时做多,当价格下破上轨时做空,利用价格在均线之间的振荡获利。
策略原理
- 计算快速移动平均线ma_short和慢速移动平均线ma_long
- 当ma_short上穿ma_long时,做多;当ma_short下穿ma_long时,做空
- 计算布林带的上轨、下轨和中间轨
- 当价格上穿下轨时,确认做多信号;当价格下穿上轨时,确认做空信号
- 结合移动平均线指标和布林带指标的信号,在它们发出同向信号时开仓,不同向时平仓
优势分析
- 结合双重指标,比较稳定,可以滤除一定假信号
- 在均线和布林带之间进行振荡交易,避免追高杀跌
- 允许双边交易,可以充分利用价格的上下波动获利
风险分析
- 布林带参数设置会影响交易频率和获利情况
- 大幅度趋势市场中容易产生较大亏损
- 均线系统本身容易产生较多平仓亏损
风险解决方法:
- 优化布林带参数,调整到适合的交易频率
- 设置止损策略,控制单笔亏损
- 结合趋势判断,在趋势不明显时使用该策略
优化方向
- 测试不同均线系统的参数组合
- 评估是否加入成交量指标过滤信号
- 测试是否结合RSI等指标确定超买超卖区域
以上优化可以进一步提高获利率,减少不必要的交易,降低交易频率和亏损风险。
总结
该策略结合均线系统和布林带指标,实现了在价格均线之间振荡交易的策略。双重指标结合可以提高信号质量,允许双边交易可以获得更多机会。通过进一步优化参数以及加入其他辅助指标判断,可以减少不必要交易和提高获利率,值得实盘检验和优化。
||
Overview
This strategy combines the moving average indicator and Bollinger Bands to implement a strategy that oscillates between moving averages for two-way trading. Go long when the price breaks above the lower rail, go short when the price breaks below the upper rail, and profit from the oscillation between the moving averages.
Strategy Principle
- Calculate the fast moving average ma_short and slow moving average ma_long
- When ma_short crosses above ma_long, go long; when ma_short crosses below ma_long, go short
- Calculate the upper rail, lower rail and middle rail of Bollinger Bands
- When price breaks above lower rail, confirm long signal; when price breaks below upper rail, confirm short signal
- Open positions when the moving average indicator and Bollinger Bands give signals in the same direction, close positions when they give signals in opposite directions
Advantage Analysis
- The combination of dual indicators makes it relatively stable and can filter out some false signals
- Oscillating between moving averages and Bollinger Bands avoids chasing highs and selling lows
- Allowing two-way trading can take full advantage of price fluctuations for profit
Risk Analysis
- The parameter settings of Bollinger Bands will affect the trading frequency and profitability
- It is easy to generate large losses in strong trending markets
- The moving average system itself tends to generate more losing trades on exits
Risk Management:
- Optimize Bollinger Bands parameters to adjust to suitable trading frequency
- Set stop loss strategy to control single trade loss
- Use this strategy when the trend is not obvious
Optimization Directions
- Test different parameter combinations of moving average systems
- Evaluate whether to add volume indicators to filter signals
- Test whether to combine RSI and other indicators to determine overbought and oversold zones
The above optimizations can further improve profitability, reduce unnecessary trades, lower trading frequency and loss risks.
Summary
This strategy combines moving average systems and Bollinger Bands to implement oscillation trading between price moving averages. The combination of dual indicators can improve signal quality, and allowing two-way trading provides more opportunities. Further optimizing parameters and adding other auxiliary indicators can reduce unnecessary trades and improve profitability, which is worth live testing and optimization.
[/trans]]
Strategy Arguments
| Argument | Default | Description |
|---|---|---|
| v_input_1 | 24 | Bollinger Period Length |
Source (PineScript)
/*backtest
start: 2023-12-09 00:00:00
end: 2023-12-10 00:00:00
period: 2m
basePeriod: 1m
exchanges: [{"eid":"Futures_Binance","currency":"BTC_USDT"}]
*/

//@version=2
strategy("MA-Zorrillo",overlay=true)

ma_short= sma(close,8)
ma_long= sma(close,89)

entry_ma = crossover (ma_short,ma_long)
exit_ma = crossunder (ma_short,ma_long)


BBlength = input(24, minval=1,title="Bollinger Period Length")
BBmult = 2 // input(2.0, minval=0.001, maxval=50,title="Bollinger Bands Standard Deviation")
BBbasis = sma(close, BBlength)
BBdev = BBmult * stdev(close, BBlength)
BBupper = BBbasis + BBdev
BBlower = BBbasis - BBdev

source = close
entry_bb = crossover(source, BBlower)
exit_bb = crossunder(source, BBupper)


vs_entry = false
vs_exit = false
for i = 0 to 63
    if (entry_bb[i])
        vs_entry :=  true
    if (exit_bb[i])
        vs_exit :=  true


entry = entry_ma and vs_entry
exit =  exit_ma and vs_exit

strategy.entry(id="long_ma",long=true,when=entry)
strategy.close(id="long_ma", when=exit)

strategy.entry(id="short_ma",long=false,when=exit)
strategy.close(id="short_ma",when=entry)
Detail
https://www.fmz.com/strategy/434978
Last Modified
2023-12-11 14:38:48