
7.0 KiB
Name
叠加动量策略Momentum-Stacking-Strategy-of-Different-Timeframes
Author
ChaoZhang
Strategy Description
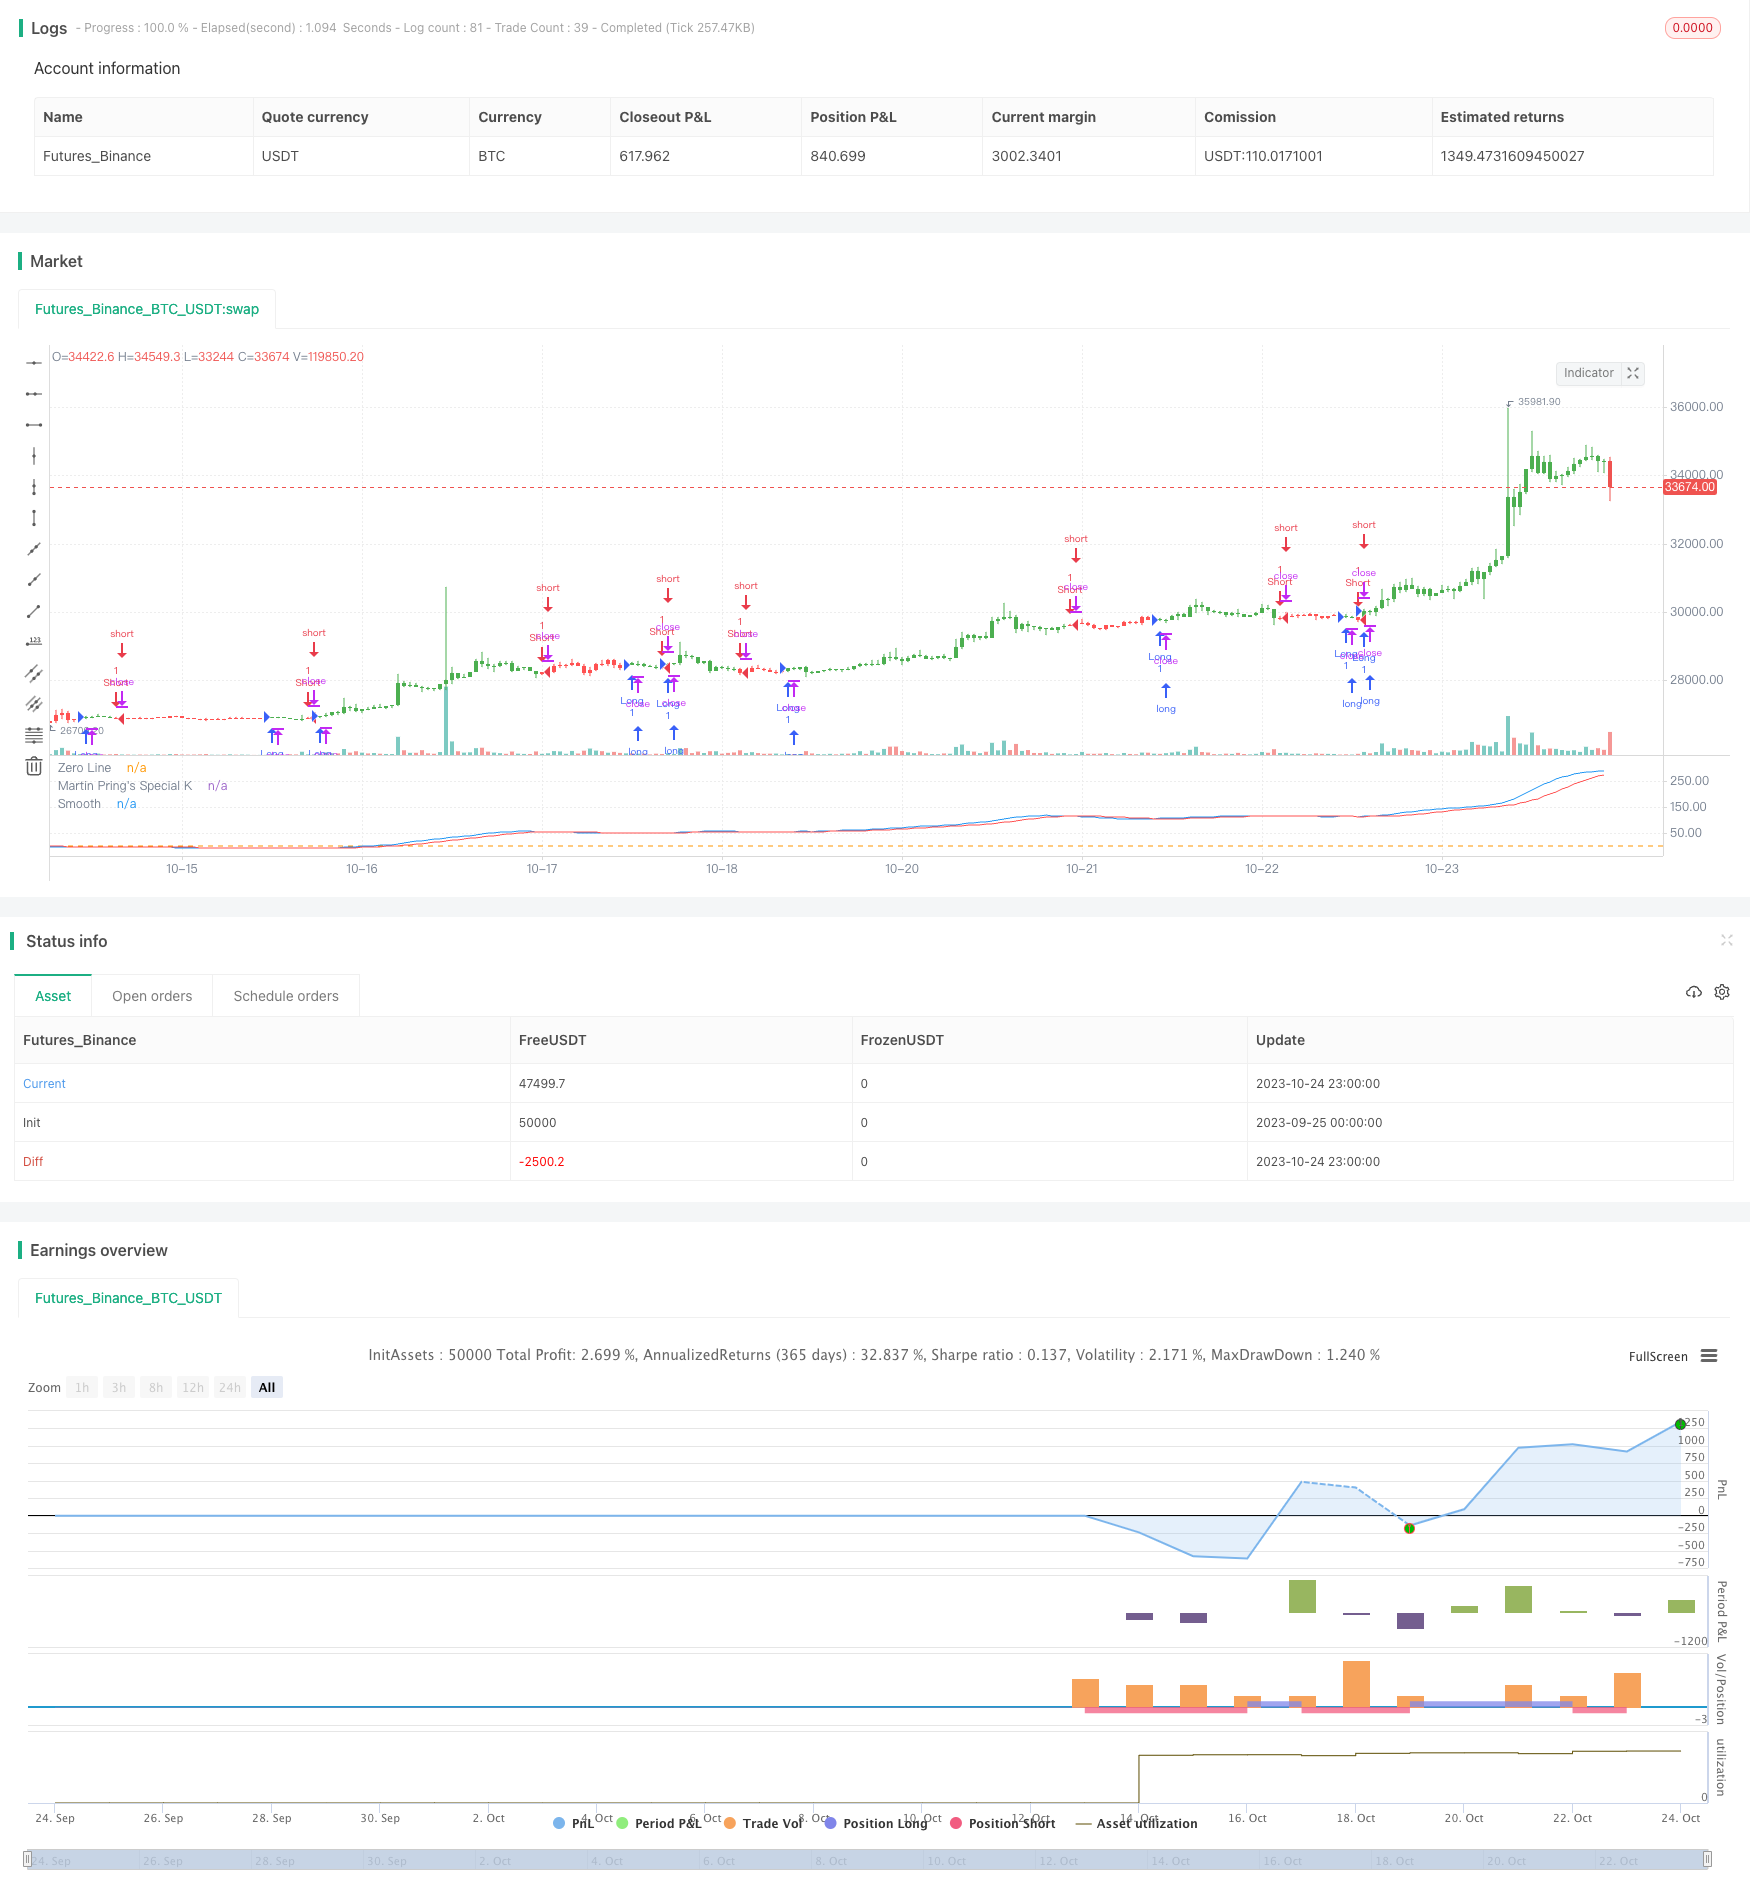
[trans]
概述
春秋叠加动量策略主要是通过计算不同周期的变化率ROC,并按比例赋权叠加,形成一个综合动量指标,以判断行情趋势方向的策略。该策略将短期、中期和长期的动量指标进行叠加,能够平衡短期和长期趋势,避免产生假信号。
策略原理
该策略首先计算10日、15日、20日等不同周期的ROC指标,然后对ROC进行平滑处理,并按照1-4的比例进行赋权叠加,计算公式如下:
roc1 = (sma(roc(close,10),10)*1)
roc2 = (sma(roc(close,15),10)*2)
...
osc = roc1+roc2+roc3+roc4+...
其中,roc1-roc12代表不同周期ROC的计算,分别对应10日、15日至530日周期。 Computes the Rate of Change (ROC) over the specified period.
接着对osc进行a天(默认10天)的SMA平滑处理,得到oscsmt。
然后比较osc与oscsmt的大小关系,当osc上穿oscsmt时为看涨信号,进入做多方向;当osc下穿oscsmt时为看跌信号,进入做空方向。
最后,可选择反转交易方向。
策略优势
-
将短期和长期动量指标进行叠加,能够同时捕捉短期和长期趋势,避免产生假信号。
-
通过差价比较osc和oscsmt,可以减少平盘区域的无谓交易。
-
可自定义参数,调整计算ROC的周期参数,以及SMA的平滑参数。
-
可选择反转交易方向,满足不同交易风格。
-
可视化指标,直观判断买卖点。
策略风险及优化
-
ROC指标对突发异常价格非常敏感,可能产生错误信号。可适当增大SMA平滑参数a,降低ROC指标的灵敏度。
-
默认参数可能不适用于所有品种,需要根据不同品种特点优化参数,找到最佳参数组合。
-
仅基于osc和oscsmt的差价比较产生交易信号,可结合其他指标过滤信号,降低错误交易概率。
-
本策略更适合中长线交易,短线交易效果可能不佳。可调整ROC的计算周期,优化本策略的使用场景。
总结
春秋叠加动量策略通过计算多个周期的ROC指标,并进行叠加得到综合动量指标,能够同时兼顾短期和长期趋势,避免产生假信号。相比单一ROC指标,该策略可大大提高信号质量和可靠性。但本策略也存在一定监控风险,需优化参数并结合其他指标使用,方能发挥最大效用。
||
Overview
The Momentum Stacking Strategy mainly calculates the Rate of Change (ROC) over different periods, weights and stacks them to form a comprehensive momentum indicator for judging the trend direction. This strategy stacks short-term, intermediate-term and long-term momentum indicators to balance short-term and long-term trends and avoid false signals.
Strategy Logic
The strategy first calculates the ROC indicators over 10-day, 15-day, 20-day periods, etc. Then smooths the ROC and stacks them in a 1-4 weighted ratio to get the formula:
roc1 = (sma(roc(close,10),10)*1)
roc2 = (sma(roc(close,15),10)*2)
...
osc = roc1+roc2+roc3+roc4+...
Where roc1-roc12 represent ROC calculations over different periods from 10-day to 530-day.
It then smoothes osc by a SMA of a (default 10) days to get oscsmt.
Compares osc with oscsmt, when osc crosses over oscsmt as the bullish signal and enters long. When osc crosses below oscsmt as the bearish signal and enters short.
Finally, it can choose to reverse the trading direction.
Advantages
-
Stacking short-term and long-term momentum indicators can capture both short-term and long-term trends, avoiding false signals.
-
Comparing osc and oscsmt can reduce unnecessary trading in sideways markets.
-
Customizable parameters to adjust ROC periods and SMA smoothness.
-
Reversible trading direction caters to different trading styles.
-
Visual indicators make buying and selling points intuitive.
Risks and Optimizations
-
ROC is very sensitive to sudden price abnormalities, which may generate wrong signals. Can increase the SMA smoothness to lower ROC sensitivity.
-
Default parameters may not suit all trading instruments. Need optimization to find the best parameter combination based on different characteristics.
-
Trades only based on osc and oscsmt crossover. Can add other indicators to filter signals and reduce errors.
-
More suitable for medium-long term trading. May need to adjust ROC periods to optimize usage scenario.
Conclusion
The Momentum Stacking Strategy calculates multiple ROC periods to get a comprehensive momentum indicator, capturing both short-term and long-term trends, avoiding false signals. Compared to a single ROC, it greatly improves signal quality and reliability. But it still carries some monitoring risks. Parameters need optimization and combining other indicators to maximize usefulness.
[/trans]
Strategy Arguments
| Argument | Default | Description |
|---|---|---|
| v_input_1 | 10 | Smooth |
| v_input_2_close | 0 | Source: close |
| v_input_3 | false | Trade reverse |
Source (PineScript)
/*backtest
start: 2023-09-25 00:00:00
end: 2023-10-25 00:00:00
period: 1h
basePeriod: 15m
exchanges: [{"eid":"Futures_Binance","currency":"BTC_USDT"}]
*/

//@version=2
////////////////////////////////////////////////////////////
//  Copyright by HPotter 08/08/2017
// Pring's Special K is a cyclical indicator created by Martin Pring.
// His method combines short-term, intermediate and long-term velocity
// into one complete series. Useful tool for Long Term Investors
// Modified for any source.
//
// You can change long to short in the Input Settings
// Please, use it only for learning or paper trading. Do not for real trading.
////////////////////////////////////////////////////////////
strategy(title="Martin Pring's Special K Backtest", shorttitle="UCS_Pring_sK")
a = input(10, title = "Smooth" )
sources = input(title="Source",  defval=close)
reverse = input(false, title="Trade reverse")
roc1 = (sma(roc(sources,10),10)*1)
roc2 = (sma(roc(sources,15),10)*2)
roc3 = (sma(roc(sources,20),10)*3)
roc4 = (sma(roc(sources,30),15)*4)
roc5 = (sma(roc(sources,40),50)*1)
roc6 = (sma(roc(sources,65),65)*2)
roc7 = (sma(roc(sources,75),75)*3)
roc8 = (sma(roc(sources,100),100)*4)
roc9 = (sma(roc(sources,195),130)*1)
roc10 = (sma(roc(sources,265),130)*2)
roc11 = (sma(roc(sources,390),130)*3)
roc12 = (sma(roc(sources,530),195)*4)
osc = roc1+roc2+roc3+roc4+roc5+roc6+roc7+roc8+roc9+roc10+roc11+roc12
oscsmt = sma(osc,a)
pos = iff(osc > oscsmt, 1,
	     iff(osc < oscsmt, -1, nz(pos[1], 0)))
possig = iff(reverse and pos == 1, -1,
          iff(reverse and pos == -1, 1, pos))
if (possig == 1)
    strategy.entry("Long", strategy.long)
if (possig == -1)
    strategy.entry("Short", strategy.short)
barcolor(possig == -1 ? red: possig == 1 ? green : blue )
plot(osc, color=blue, title="Martin Pring's Special K")
plot(oscsmt, color = red, title = "Smooth")
hline(0, title="Zero Line")
Detail
https://www.fmz.com/strategy/430285
Last Modified
2023-10-26 17:39:26