
11 KiB
Name
双EMA黄金交叉策略Dual-EMA-Crossover-Strategy
Author
ChaoZhang
Strategy Description
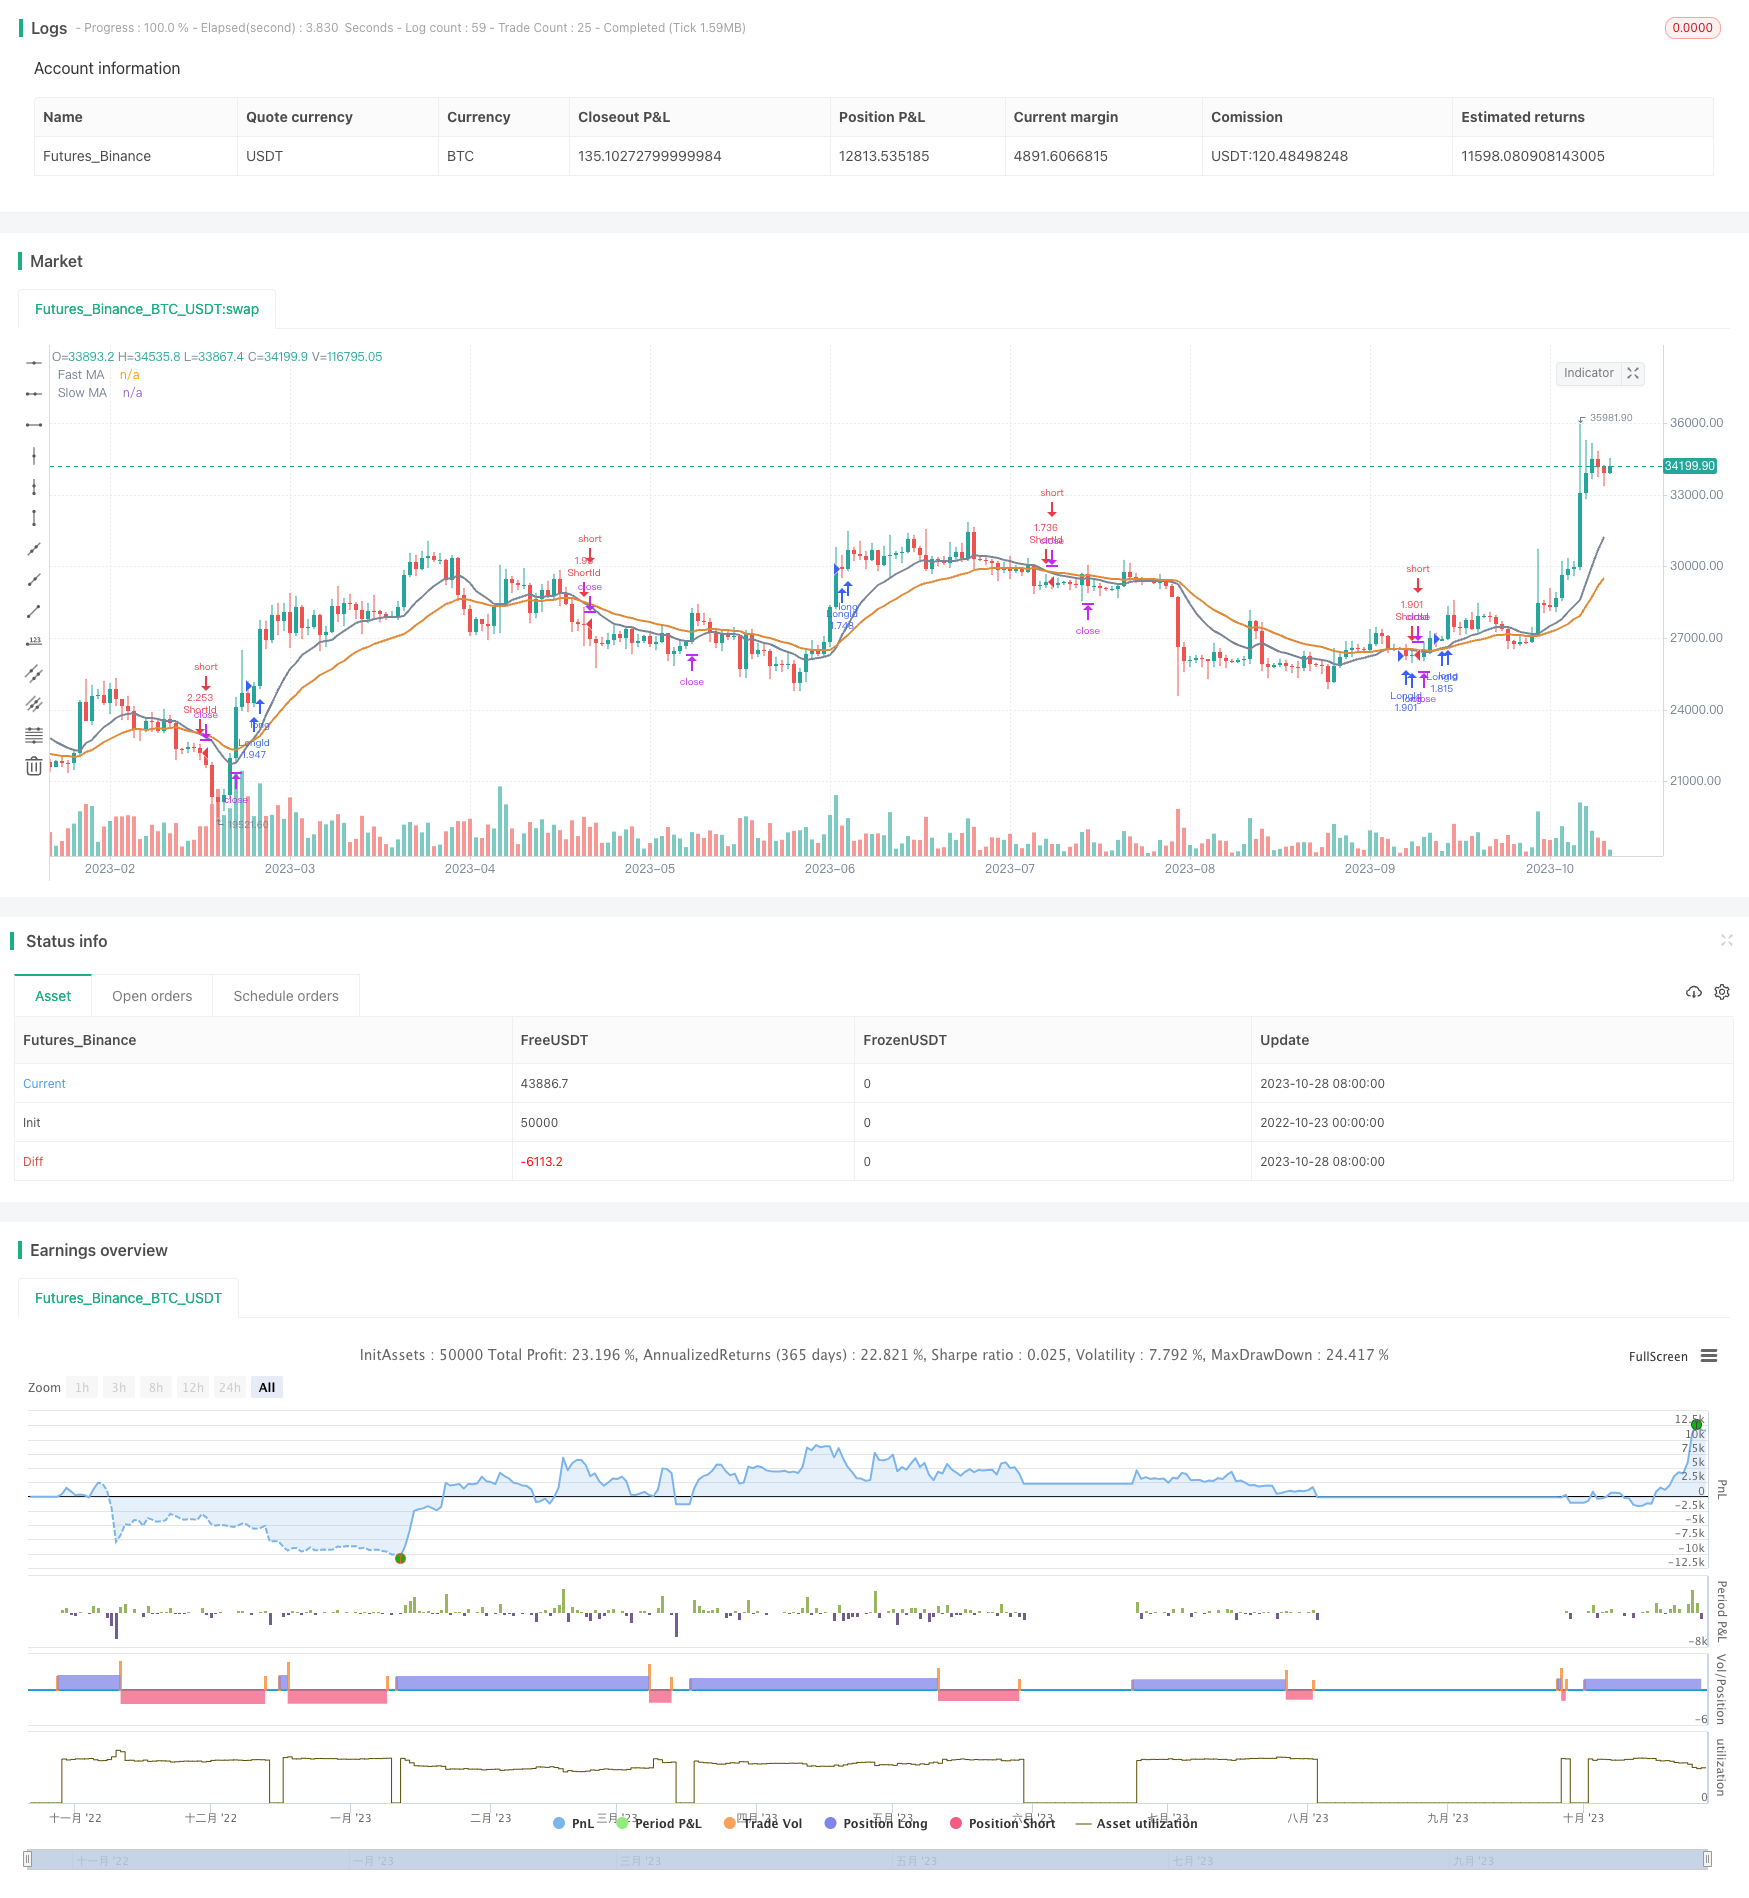
[trans]
概述
双EMA黄金交叉策略是一种典型的趋势跟踪策略。该策略运用两条不同周期的EMA均线,根据它们的交叉形态来产生买入和卖出信号。当短周期EMA上穿长周期EMA时,产生买入信号;当短周期EMA下穿长周期EMA时,产生卖出信号。这种策略可以跟踪中长线趋势,在趋势开始阶段能够及时捕捉交易机会。
策略原理
该策略主要由以下几部分组成:
-
设置快线EMA和慢线EMA的长度。在这里快线EMA长度为12,慢线EMA长度为26。
-
计算快线EMA和慢线EMA。快线EMA反应更快,慢线EMA反应更稳定。
-
判断EMA的交叉情况,产生交易信号。当快线EMA上穿慢线EMA时,产生买入信号;当快线EMA下穿慢线EMA时,产生卖出信号。
-
根据信号入场。做多时,若有反向做空头寸,先平掉做空头寸,再开多头寸。做空同理。
-
设置止损点。做多时,若价格跌破之前低点一定比例则止损。做空同理。
-
根据信号出场。快线EMA下穿慢线EMA时平掉多单。快线EMA上穿慢线EMA时平掉空单。
该策略简单明了,通过EMA两线的交叉来判断趋势方向和强度,可以有效跟踪趋势。快线EMA对短期价格变化敏感,慢线EMA对长期趋势响应更稳定。两线交叉是比较经典的判定趋势变化的方法。
策略优势分析
该策略具有以下优势:
-
概念简单,易于理解和实现。EMA和交叉是公认有效的技术指标和信号。
-
可以有效跟踪中长线趋势,及时捕捉趋势机会。
-
采用双EMA设定,可以避免被短期市场噪声干扰。
-
有明确的入场规则,出场规则和止损规则,不会出现死拿重仓的情况。
-
仅需要少量参数,不容易过度优化。参数调整简单,适合新手学习。
-
回测结果良好,具有实战价值。可以独立使用,也可以和其他策略组合使用。
策略风险分析
该策略也存在一些风险:
-
双EMA交叉容易产生错误信号和频繁交叉。应适当调整参数,过滤无效信号。
-
无法很好应对震荡区间和趋势反转。需要辅助其他指标进行确认。
-
双EMA策略容易追高杀跌,应适当控制仓位规模,或设置止盈止损。
-
回测曲线可能存在一定程度的过拟合。应进行参数敏感性测试,评估稳定性。
-
没有及时止损可能导致较大亏损。应设置合理的止损位置。
-
交易费用可能影响实际盈利。应考虑不同品种的手续费因素。
策略优化方向
该策略可以从以下几个方面进行优化:
-
优化EMA周期参数,找到最优参数组合。可以引入步进优化和机器学习方法。
-
增加趋势过滤器,如ADX,CCI等指标,避免不确定趋势下的错误交易。
-
增加量能指标,如交易量,能量潮等,确保存在真实交易推动。
-
设置动态止损机制,能根据市场波动自动调整止损位置。
-
结合相关品种进行组合,利用品种相关性进行风险调整。
-
增加机器学习算法,利用AI进行参数优化、特征工程、信号过滤等。
-
考虑交易成本因素,调整止损点和仓位规模,减少交易频率。
-
针对不同品种特点设计参数,使策略更具适应性。
-
设计复合策略框架,与其他策略组合,提高稳定性。
通过这些优化,可以使策略更完善、稳定,在实际交易中获得更持续、稳定的盈利。
总结
本策略采用双EMA交叉产生交易信号,可以有效跟踪中长线趋势。策略优势在于简单易用,回测效果良好,适合新手学习使用。但也存在一定风险,需要注意防范。通过参数优化、增加辅助技术指标、设置动态止损、考虑交易成本等措施,可以使策略更完善。该策略可以独立使用,也可以和其它策略组合,具有很好的实用性。
||
Overview
The Dual EMA Crossover strategy is a typical trend following strategy. It uses two EMA lines of different periods and generates trading signals based on their crossover. When the faster EMA crosses above the slower EMA, a buy signal is generated. When the faster EMA crosses below the slower EMA, a sell signal is generated. This strategy can track medium-long term trends and capture trading opportunities in trend initiation stages.
Strategy Logic
The key components of this strategy are:
-
Set lengths for the faster EMA and slower EMA. Here the faster EMA length is 12, slower EMA is 26.
-
Calculate the faster EMA and slower EMA. The faster EMA reacts quicker while the slower EMA is more stable.
-
Determine EMA crossover situations to generate trading signals. When faster EMA crosses above slower EMA, a buy signal is generated. When faster EMA crosses below slower EMA, a sell signal is generated.
-
Enter trades based on signals. When going long, existing short positions are closed first before opening long positions. Vice versa.
-
Set stop loss points. When going long, stop loss is triggered if price falls below previous low by a set percentage. Vice versa.
-
Exit trades based on signals. Long positions are closed when faster EMA crosses below slower EMA. Short positions closed when faster EMA crosses above slower EMA.
The logic is simple and intuitive. EMA crossover determines trend direction and strength. Faster EMA reacts to short term price changes quickly while slower EMA responds to long term trends steadily. Crossover of the two lines is a classic way to detect trend changes.
Advantage Analysis
The advantages of this strategy are:
-
Simple concept easy to understand and implement. EMA and crossover are recognized effective indicators and signals.
-
Can effectively track medium-long term trends and capture opportunities early.
-
Dual EMA setup avoids noise from short term market fluctuations.
-
Has clear entry rules, exit rules and stop loss rules. No overholding positions.
-
Only needs a few parameters, not prone to overfitting. Easy parameter tuning suitable for beginners.
-
Good backtest results, viable for live trading. Can be used standalone or combined with other strategies.
Risk Analysis
Some risks of this strategy:
-
Dual EMA crossover prone to generating false signals and whipsaws. Parameters need tuning to filter invalid signals.
-
Cannot handle ranging and trend reversal situations well. Needs confirmation from other indicators.
-
Dual EMA strategy tends to chase highs and sell lows. Position sizing and profit taking should be controlled.
-
Backtest results may be overfitted to some extent. Parameter sensitivity should be tested for robustness.
-
No timely stop loss can lead to large losses. Reasonable stop loss levels should be set.
-
Transaction costs may affect actual profitability. Commission factors for different products should be considered.
Improvement Areas
Some ways to improve the strategy:
-
Optimize EMA period parameters to find best combination, using walk forward optimization and machine learning.
-
Add trend filter indicators like ADX, CCI etc. to avoid trading in uncertain trends.
-
Add volume indicators like trading volume, on balance volume to ensure real trading is driving signals.
-
Implement dynamic stop loss to automatically adjust stops based on market volatility.
-
Combine correlated products to utilize correlation for risk management.
-
Introduce machine learning for parameter optimization, feature engineering, signal filtering etc.
-
Consider transaction costs, adjust stops and size to reduce trade frequency.
-
Customize parameters based on product characteristics to improve adaptiveness.
-
Design composite strategy framework, combining with other strategies to improve robustness.
These improvements can make the strategy more robust and profitable for live trading.
Conclusion
This strategy uses dual EMA crossover to generate trading signals and can effectively track medium-long term trends. The advantages lie in its simplicity and good backtest results, making it easy for beginners to use. But risks exist and should be managed through parameter optimization, adding indicators, dynamic stops, optimizing trade costs etc. The strategy can be used standalone or combined with others for added practicality.
[/trans]
Strategy Arguments
| Argument | Default | Description |
|---|---|---|
| v_input_1 | 2018 | Backtest Start Year |
| v_input_2 | true | Backtest Start Month |
| v_input_3 | true | Backtest Start Day |
| v_input_4 | true | UseStopLoss |
| v_input_5 | 20 | Stop loss percentage(0.1%) |
| v_input_6_open | 0 | Fast MA Source: open |
| v_input_7 | 12 | Fast MA Period |
| v_input_8_open | 0 | Slow MA Source: open |
| v_input_9 | 26 | Slow MA Period |
Source (PineScript)
/*backtest
start: 2022-10-23 00:00:00
end: 2023-10-29 00:00:00
period: 1d
basePeriod: 1h
exchanges: [{"eid":"Futures_Binance","currency":"BTC_USDT"}]
*/

//@version=2

strategy(title = "EMA Cross Strategy", shorttitle = "EMA Cross",calc_on_order_fills=true,calc_on_every_tick =true, initial_capital=21000,commission_value=.25,overlay = true,default_qty_type = strategy.percent_of_equity, default_qty_value = 100)
StartYear = input(2018, "Backtest Start Year")
StartMonth = input(1, "Backtest Start Month")
StartDay = input(1, "Backtest Start Day")
UseStopLoss = input(true,"UseStopLoss")

window() => time >=  timestamp(StartYear, StartMonth, StartDay,00,00) ? true : false

stopLoss = input(20, title = "Stop loss percentage(0.1%)")


maFastSource   = input(defval = open, title = "Fast MA Source")
maFastLength   = input(defval = 12, title = "Fast MA Period", minval = 1)
// long ma
maSlowSource   = input(defval = open, title = "Slow MA Source")
maSlowLength   = input(defval = 26, title = "Slow MA Period", minval = 1)

maFast = ema(maFastSource, maFastLength)
maSlow = ema(maSlowSource, maSlowLength)


fast = plot(maFast, title = "Fast MA", color = #7a8598, linewidth = 2, style = line, transp = 50)
slow = plot(maSlow, title = "Slow MA", color = #e08937, linewidth = 2, style = line, transp = 50)


longEMA = crossover(maFast, maSlow)
exitLong = crossunder(maFast, maSlow)

shortEMA = crossover(maSlow, maFast)
exitShort = crossover(maFast, maSlow)


if (longEMA)
    strategy.entry("LongId", strategy.long, when=window())

if (shortEMA)
    strategy.entry("ShortId", strategy.short, when=window())


if (UseStopLoss)
    strategy.exit("StopLoss", "LongId", loss = close * stopLoss / 1000 / syminfo.mintick)
    strategy.exit("StopLoss", "ShortId", loss = close * stopLoss / 1000 / syminfo.mintick)
Detail
https://www.fmz.com/strategy/430562
Last Modified
2023-10-30 14:36:11