
9.3 KiB
Name
双超趋势策略Dual-SuperTrend-Strategy
Author
ChaoZhang
Strategy Description
[trans]
概述
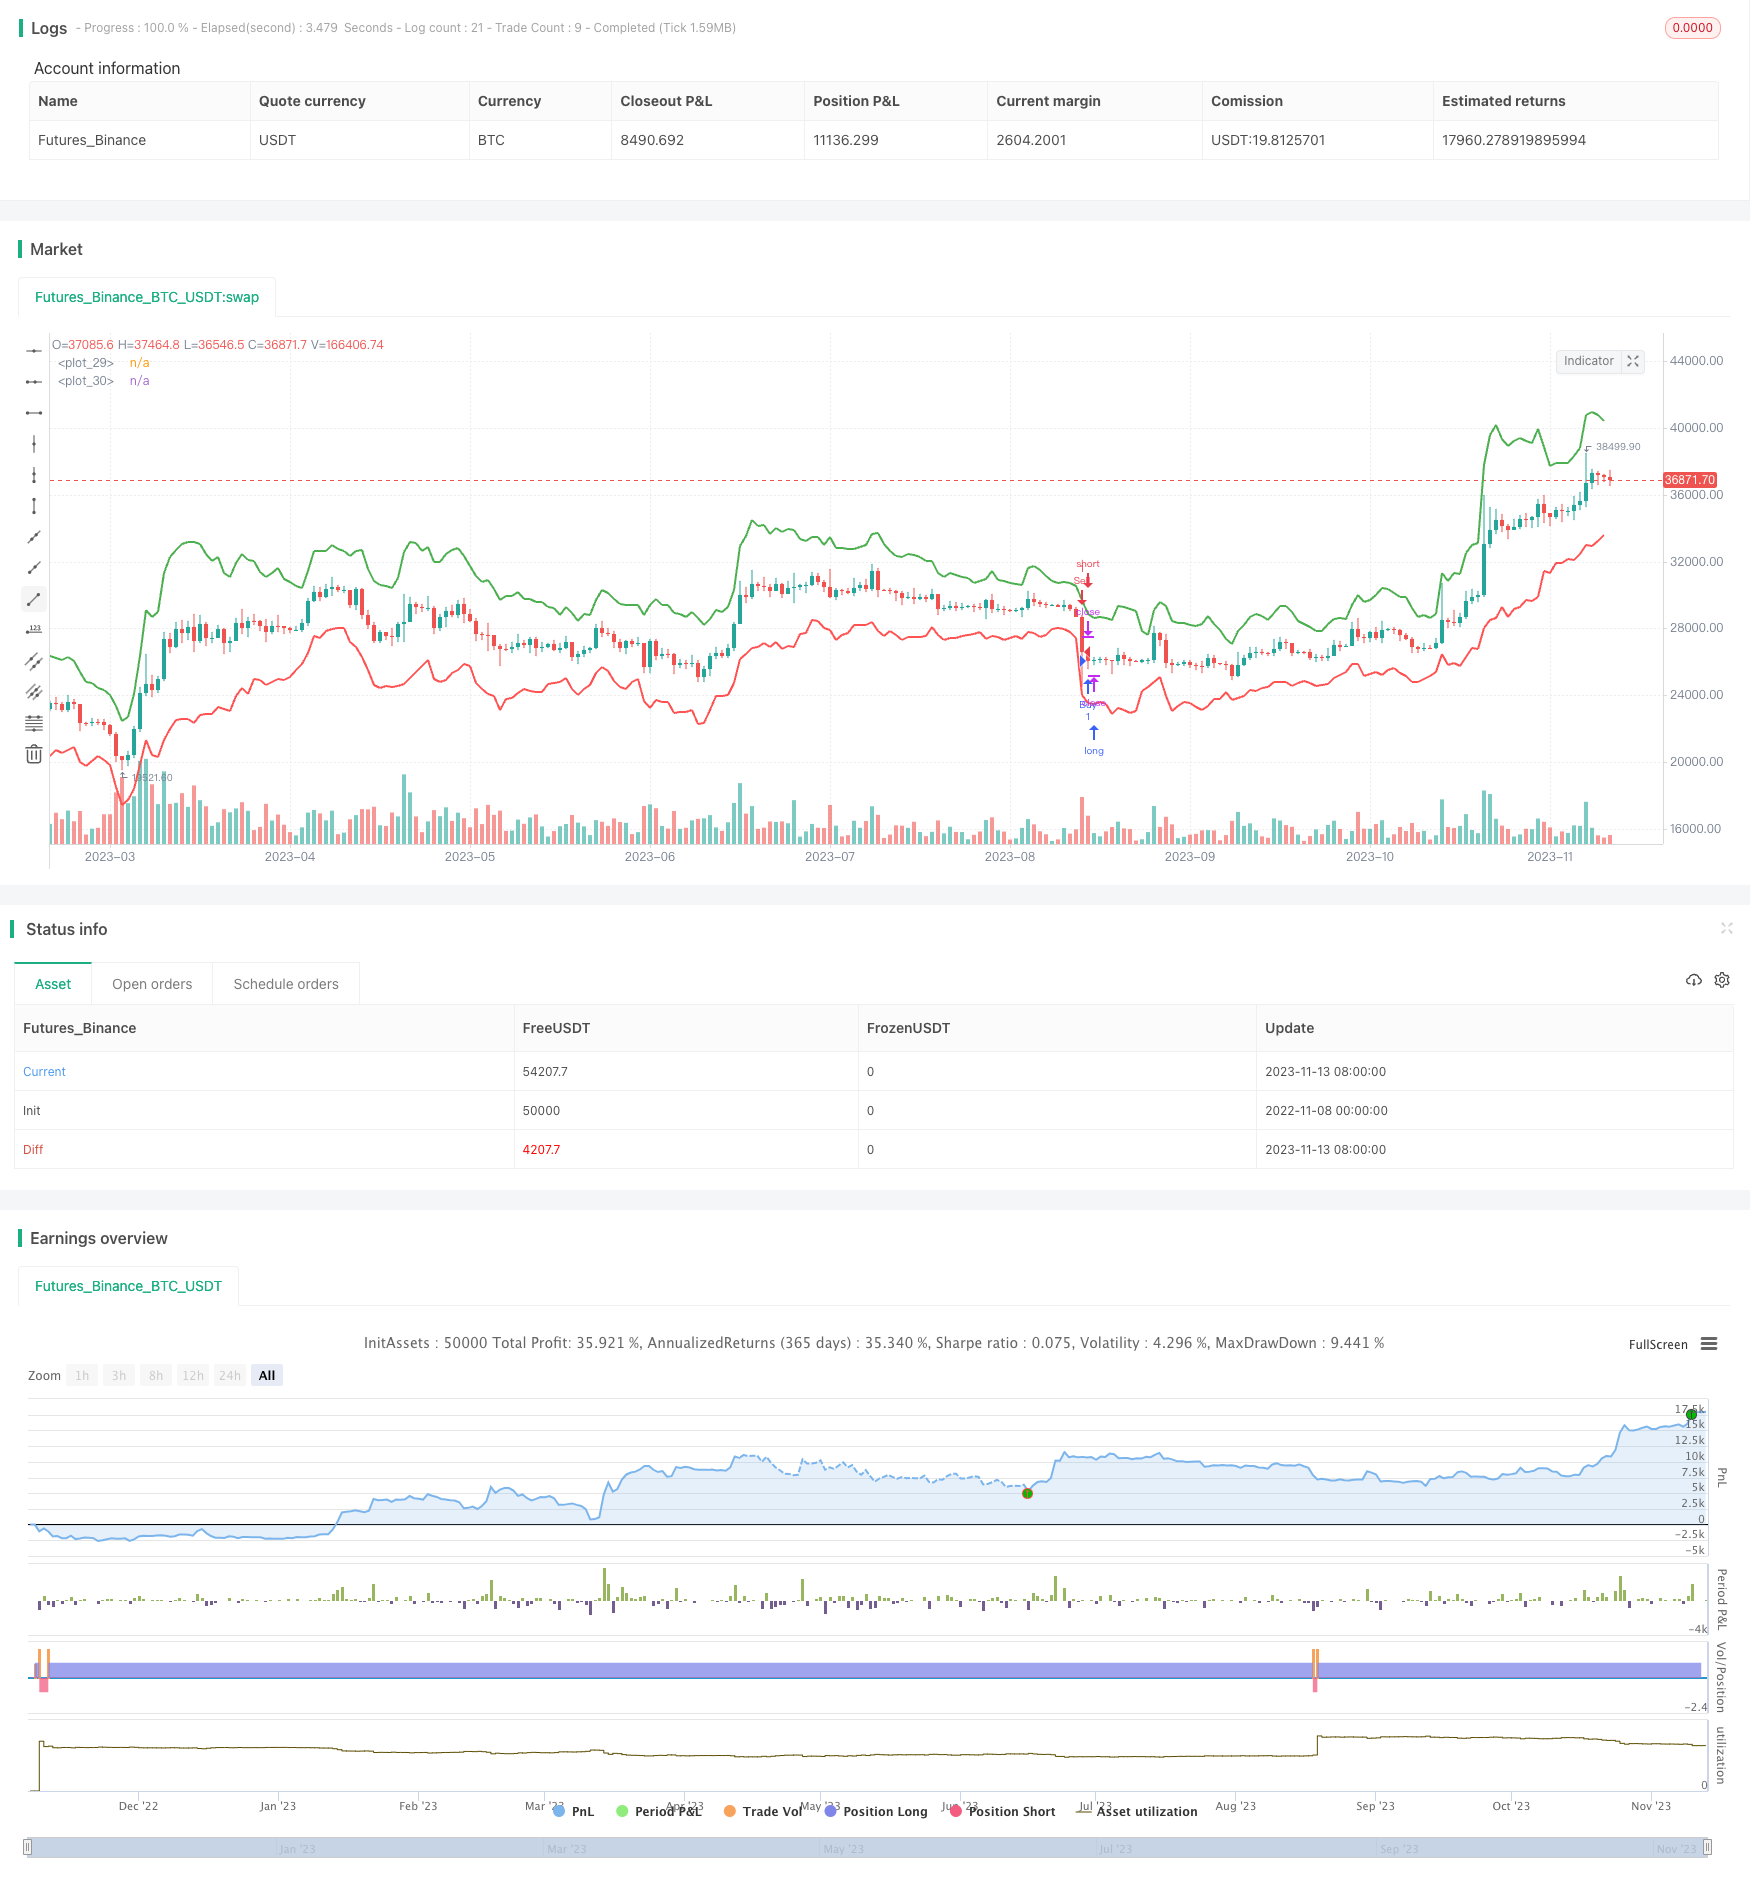
双超趋势策略是一种融合双超趋势通道的短线量化交易策略。该策略通过计算真实波幅范围并构建双通道系统,实时监控价格突破通道,实现趋势追踪和反转交易。
策略原理
双超趋势策略基于超趋势指标的衍生。超趋势指标由上端带和下端带组成,用来判断价格趋势和关键支撑阻力位。双超趋势策略在此基础上构建双通道:企稳通道和破裂通道。
- 企稳通道:由基础上端带和下端带组成,用于判断当前价格趋势;
- 破裂通道:由启发式上端带和下端带组成,用于捕捉趋势反转。
策略首先计算真实波幅范围,即最高价与最低价的差价,以及平均真实波幅范围。然后根据长度参数和乘数参数计算基础通道。接着判断价格是否突破基础通道构建破裂通道,完成双通道建立。
在双通道体系下,策略通过判断价格突破不同通道来实现交易信号的产生:
- 价格上穿企稳通道下端带时,产生买入信号;
- 价格下穿企稳通道上端带时,产生卖出信号。
通过双通道的监控,可以实现趋势追踪和反转捕捉。
优势分析
双超趋势策略结合双通道系统,具有以下优势:
- 捕捉趋势反转,避免假突破。破裂通道的设定可以有效识别真实趋势反转,防止被短期噪音误导。
- 交易持续性强。相比单一超趋势,双超趋势可延长每次交易周期。
- 参数优化空间大。通过调整通道参数可以适应不同品种和周期的特点。
- 实现较低的策略神经质化。双通道机制增强了策略稳定性。
- 容易检验和优化。直观的通道显示有利于快速评估策略效果。
风险分析
双超趋势策略也存在以下风险:
- 双通道范围选取需要经验。通道过窄易造成多次无效突破;通道过宽则无法及时捕捉趋势反转。
- 场外重大事件影响。非技术驱动事件可能导致价格出现异常波动,突破通道系统失效。
- 交易频率较高。双通道结构容易增大交易频率,需要控制仓位规模。
- 参数优化难度大。双通道的参数不易同时优化,需要花费足够时间调整。
- 不能保证止损。该策略无法设置止损,存在一定风险。
可以通过调整参数范围、结合过滤条件、适当控制仓位等方法来规避上述风险。
优化方向
双超趋势策略可以从以下方面进行优化:
- 增加过滤条件,避免假突破。可以加入交易量或波动率指标等过滤信号,确保突破有效。
- 结合趋势指标,判断大趋势方向。大趋势方向一致可以避免逆势交易。
- 动态调整通道参数,适应市场变化。可以利用自适应算法优化通道参数。
- 优化退出机制,实现盈利保护。可以设定移动止损或时间退出等方式。
- 区分多空状态,做多做空分别交易。针对多头和空头阶段采用不同的参数。
- 加入量化风控,控制最大回撤。可以设置仓位控制和总体止损等方法。
通过进一步优化,可以使策略 Parameter Fitting 和 Walk Forward Analysis 效果更佳,从而获得更稳定的收益。
总结
双超趋势策略基于双通道机制实现趋势跟踪和反转捕捉,通过参数优化可以得到稳定的交易策略。但该策略也存在一定的局限性,需要引入辅助手段进行风险控制。总体来说,双超趋势策略为短线量化交易提供了一个可靠的模型框架。
||
Overview
The Dual SuperTrend strategy is a quantitative trading strategy that incorporates a dual SuperTrend channel system. It calculates true range volatility and constructs a two-band channel to monitor price breakthroughs, enabling trend following and reversal trading.
Strategy Logic
The Dual SuperTrend strategy derives from the SuperTrend indicator. SuperTrend consists of upper and lower bands to determine price trends and key support/resistance levels. The Dual SuperTrend builds two channels on top of it: the consolidating channel and the breaking channel.
- Consolidating Channel: made up of the basic upper and lower bands to judge the ongoing trend.
- Breaking Channel: formed by the heuristic upper and lower bands to capture trend reversals.
The strategy firstly computes the true range and average true range. It then calculates the basic bands based on the length and multiplier parameters. Next, it constructs the breaking channel if the price breaks through the basic bands. The dual-channel system is thus established.
Under the dual-channel structure, trading signals are generated when the price crosses different channels:
- A buy signal is triggered when the price crosses above the lower band of the consolidating channel.
- A sell signal is triggered when the price crosses below the upper band of the consolidating channel.
The dual-channel monitoring enables both trend following and reversal capturing.
Advantage Analysis
The Dual SuperTrend strategy with the dual-channel system has the following advantages:
- Capturing trend reversals and avoiding false breakouts. The breaking channel effectively identifies true reversals.
- Persistence in trades. The dual-channel prolongs each trade compared to the single SuperTrend.
- Large parameter optimization space. The channels can be tuned for different products and timeframes.
- Reduced strategy whipsaws. The dual-channel enhances stability.
- Easy backtesting and optimization. The intuitive channels facilitate evaluating the strategy.
Risk Analysis
The Dual SuperTrend strategy also has the following risks:
- Channel range selection requires expertise. Too narrow channels cause frequent invalid breakouts. Too wide channels fail to capture reversals timely.
- Impact from external events. Non-technical events may trigger abnormal price moves that invalidate the channel system.
- High trading frequency. The dual-channel structure tends to increase trading frequency and position sizing needs control.
- Difficult parameter optimization. It is challenging to optimize both channels simultaneously. Sufficient time is required.
- No stop loss guarantee. The strategy does not have a stop loss mechanism.
The risks can be mitigated by adjusting parameter range, adding filters, controlling position sizing, etc.
Optimization Directions
The Dual SuperTrend strategy can be optimized in the following aspects:
- Adding filters to avoid false breakouts. Volume or volatility indicators can be used to confirm valid breakouts.
- Incorporating trend indicators to determine the macro trend. Trading along the major trend avoids counter-trend trades.
- Dynamically adjusting channel parameters to adapt to changing markets. Adaptive algorithms can optimize parameters.
- Optimizing exit mechanisms for profit protection. Trailing stop or time-based exit can be incorporated.
- Separating long and short states for directional trading. Different parameters can be used for bullish and bearish stages.
- Introducing quant risk control for maximum drawdown limit. Position sizing control and overall stop loss can be set.
Further optimizations can improve Parameter Fitting and Walk Forward Analysis for more robust performance.
Conclusion
The Dual SuperTrend strategy leverages the dual-channel mechanism for trend following and reversal capturing. Stable trading strategies can be developed through parameter optimization, but limitations exist. Risk control addons are required. Overall, the Dual SuperTrend provides a solid framework for short-term quantitative trading strategies.
[/trans]
Strategy Arguments
| Argument | Default | Description |
|---|---|---|
| v_input_1 | 10 | Length |
| v_input_2 | 3 | Multiplier |
Source (PineScript)
/*backtest
start: 2022-11-08 00:00:00
end: 2023-11-14 00:00:00
period: 1d
basePeriod: 1h
exchanges: [{"eid":"Futures_Binance","currency":"BTC_USDT"}]
*/


//@version=4
strategy("Double Supertrend Strategy", overlay=true)

// Define your parameters
length = input(10, title="Length")
multiplier = input(3, title="Multiplier")

// Calculate the True Range and Average True Range
trueRange = max(high - low, max(abs(high - close[1]), abs(low - close[1])))
averageTrueRange = sma(trueRange, length)

// Calculate the basic upper and lower bands
basicUpperBand = hl2 + (multiplier * averageTrueRange)
basicLowerBand = hl2 - (multiplier * averageTrueRange)

// Calculate the final upper and lower bands
finalUpperBand = basicUpperBand
finalLowerBand = basicLowerBand

finalUpperBand := close[1] > finalUpperBand[1] ? max(basicUpperBand, finalUpperBand[1]) : basicUpperBand
finalLowerBand := close[1] < finalLowerBand[1] ? min(basicLowerBand, finalLowerBand[1]) : basicLowerBand

// Determine if we're currently in an uptrend or downtrend
uptrend = close > finalLowerBand[1]
downtrend = close < finalUpperBand[1]

// Plot the bands
plot(uptrend ? finalUpperBand : na, color=color.green, linewidth=2)
plot(downtrend ? finalLowerBand : na, color=color.red, linewidth=2)

// Define your conditions for entering and exiting trades
if (uptrend)
    strategy.entry("Buy", strategy.long)
else if (downtrend)
    strategy.entry("Sell", strategy.short)
Detail
https://www.fmz.com/strategy/432221
Last Modified
2023-11-15 16:33:05