
10 KiB
Name
双线性反转均线振荡器组合策略123-Reversal-Moving-Average-Convergence-Divergence-Combination-Strategy
Author
ChaoZhang
Strategy Description
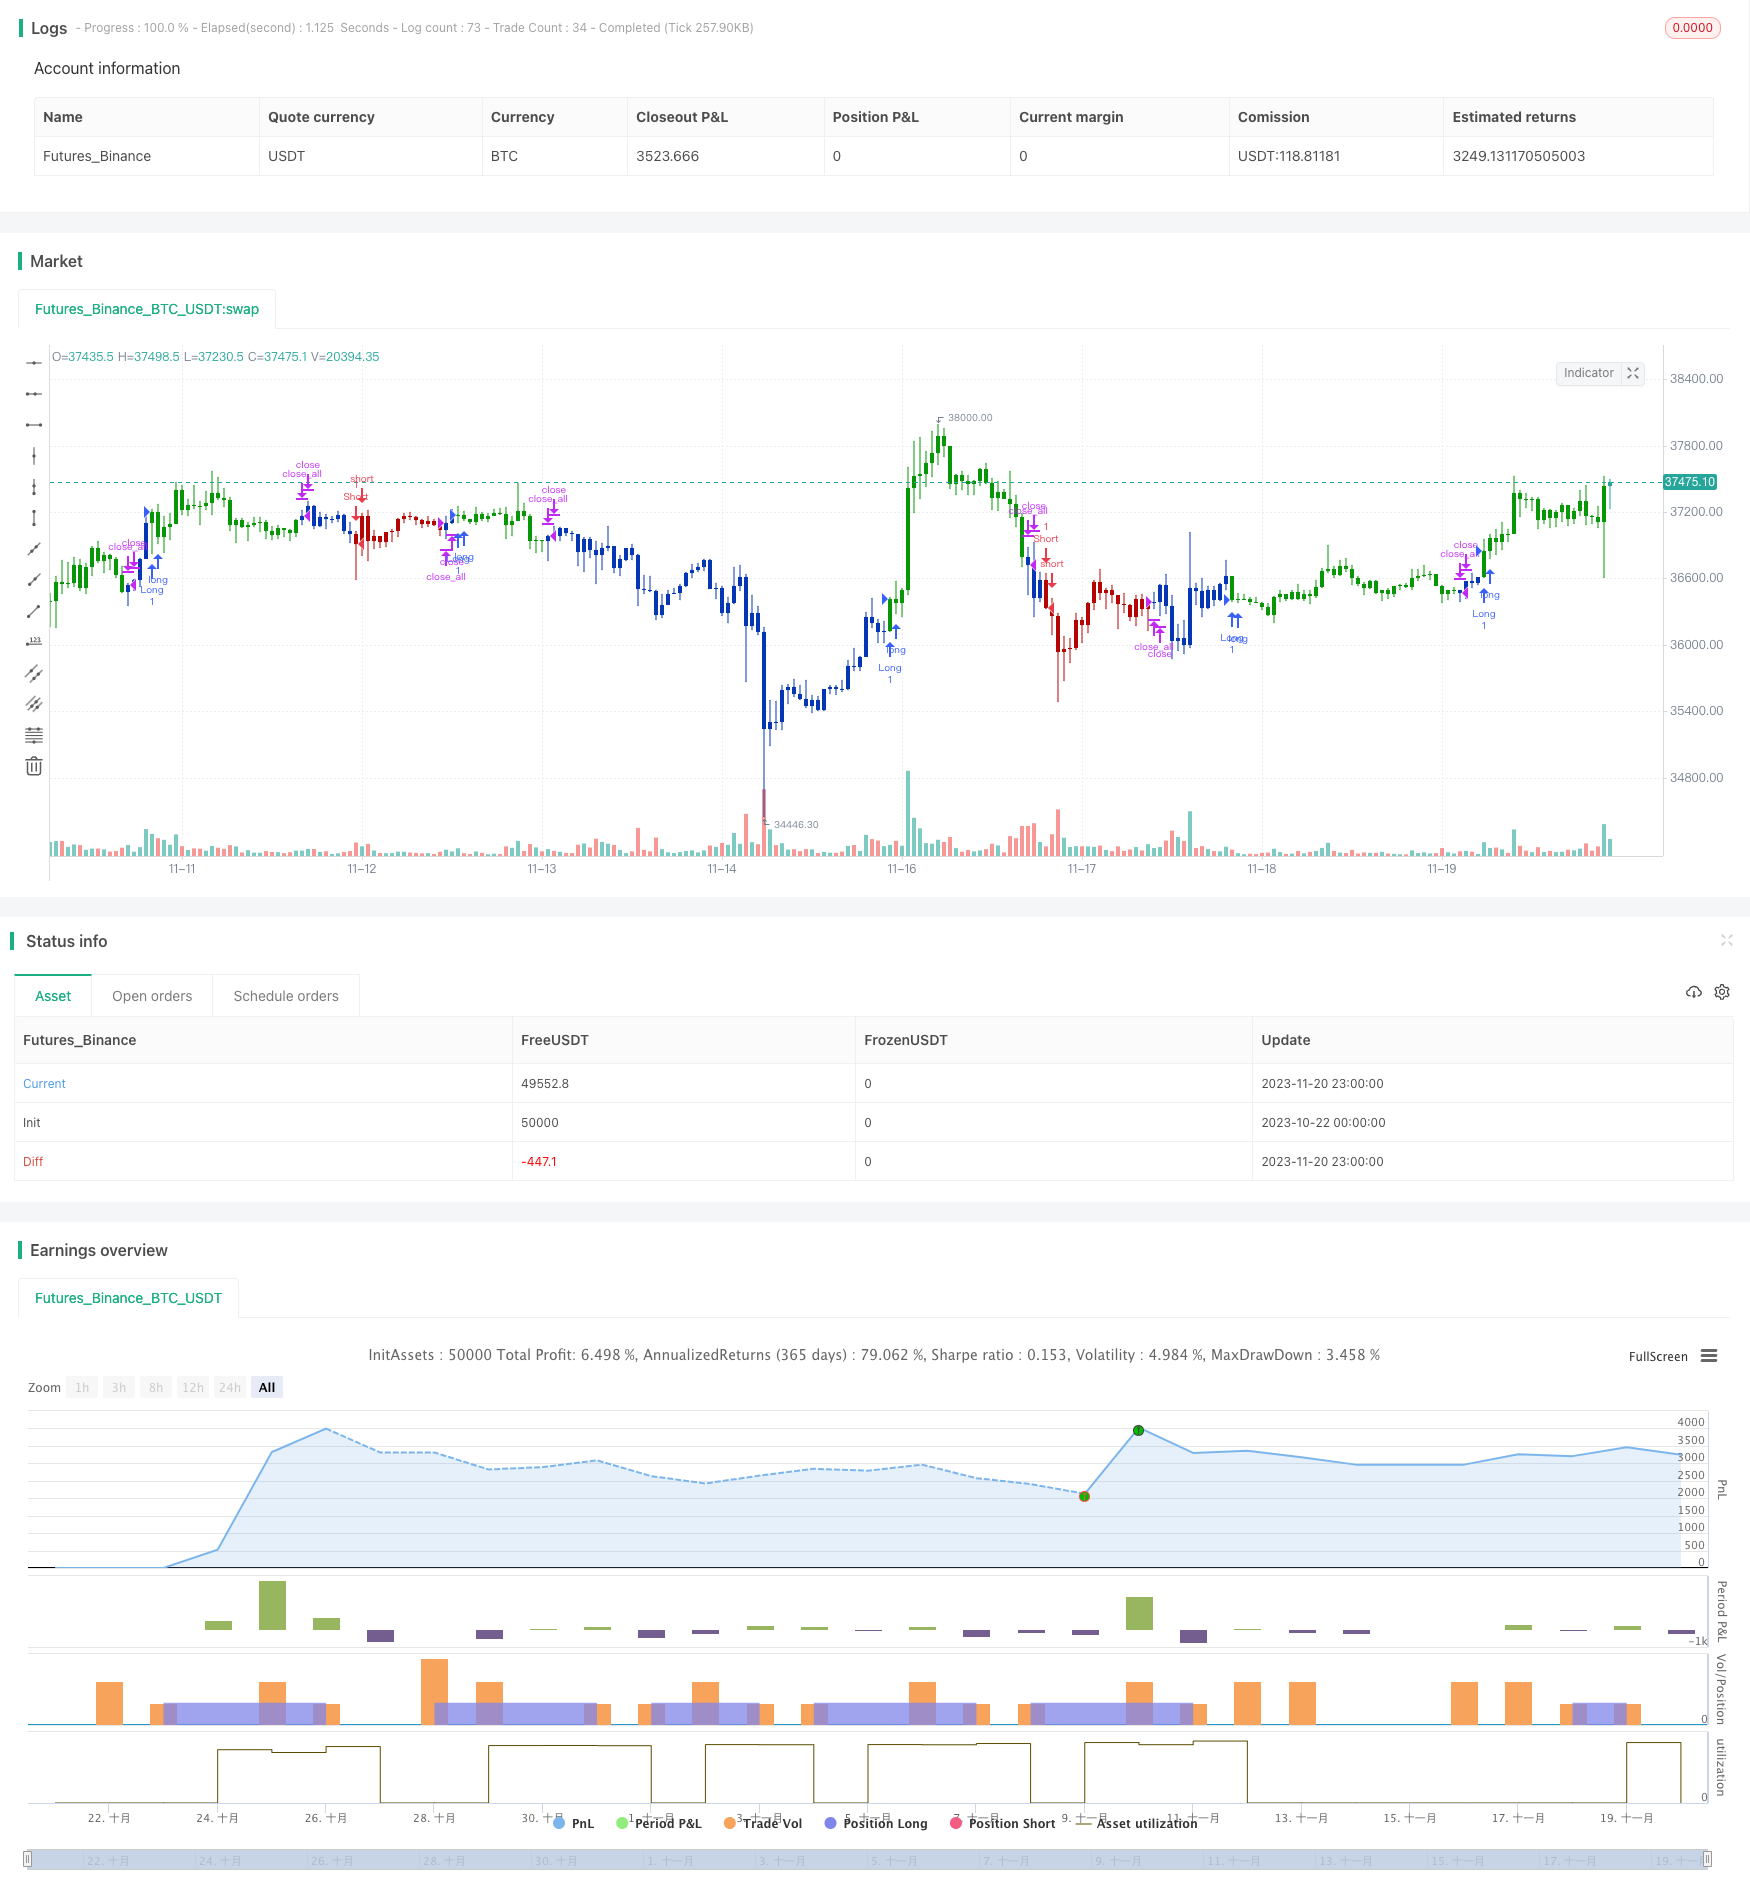
[trans]
概述
本策略是将乌尔夫·詹森在他的著作中提出的123形态反转交易策略与马丁·普林克提出的加权移动平均线振荡器(KST)进行组合,构建一个综合利用反转形态和趋势震荡指标产生交易信号的量化策略。
策略原理
123反转形成机理
该部分策略的核心逻辑是监测股票的收盘价在最近2天内是否出现转折,具体来说就是:
如果最近2天的收盘价处于下跌趋势,即前一天的收盘价高于前2天;而今天的收盘价较前一天反转上涨,即高于前一天的收盘价,那么可以判断底部反转,产生买入信号。
相反,如果最近2天收盘价处于上涨趋势,即前一天收盘价低于前2天;而今天收盘价较前一天反转下跌,即低于前一天的收盘价,那么可以判断顶部反转,产生卖出信号。
该部分策略还同时结合Stochastic指标判断是否超买超卖,过滤掉非反转时间点的交易信号。
KST指标机理
KST指标中的ROC代表价格的变化速率,分别计算6天、10天、15天和20天的ROC,并进行不同参数的移动平均线平滑之后,进行加权求和,构成KST指标。
当快线上穿慢线时判断为看涨,当快线下穿慢线时判断为看跌。 herein,快线就是原始的KST值,慢线是KST的移动平均。
本策略采用KST>0判断为看涨,KST<0判断为看跌。
信号合并
将123形态反转策略和KST指标的 Judgment 信号进行合并:
- 若两者信号一致,产生该方向的交易信号
- 若两者信号不一致,不交易
可见,该策略综合运用了反转形态和指标判断两种不同类型的技术指标,结合其信号强度,设计出一个较为先进的量化交易策略。
策略优势
- 反转形态部分可有效识别转折点,指标部分可跟踪趋势,两者互补
- 结合双重指标过滤,可提高信号质量,减少假信号
- KST参数调节灵活,可对不同周期的股票进行优化
- 可适应高波动的股票,也可用于相对稳定的股票
策略风险
- 反转失败风险,反转信号也可能是假突破
- 信号合并后可错过部分机会
- KST参数不当可能对结果产生较大干扰
- 股价波动剧烈时KST产生迟滞,可能出现信号不一致
可通过调整参数,优化反转判定逻辑,引入止损机制等方法来控制风险。
策略优化方向
- 优化Stochastic指标参数
- 优化KST线的长度参数
- 增加交易量或波动力指标过滤
- 增加趋势判断,避免逆势交易
- 引入止损机制
总结
该策略整合运用多种不同类型的技术指标,通过双重确认和组合优化, scientifically designed出一个较强的量化交易策略,可谓策略组合的典范。实盘表现还有待进一步验证,但从理论构思上看,它综合考虑了多种 scenarios,解决了单一指标的局限性,值得进一步研究与应用。
||
Overview
This strategy combines the 123 reversal trading strategy proposed by Ulf Jensen in his book with the Moving Average Convergence Divergence Oscillator (KST) proposed by Martin Pring to build a quantitative strategy that generates trading signals by utilizing reversal patterns and trend oscillation indicators.
Strategy Principle
123 Reversal Formation Mechanism
The core logic of this part of the strategy is to monitor whether the closing price of the stock has reversed in the past 2 days, specifically:
If the closing prices in the past 2 days are in a downward trend, that is, the previous day's closing price is higher than the one before; and today's closing price rebounds upward from the previous day, which is higher than the previous day's closing price, it can be judged as a bottom reversal and a buy signal is generated.
On the contrary, if the closing prices in the past 2 days are in an upward trend, that is, the previous day's closing price is lower than the one before; and today's closing price falls from the previous day, which is lower than the previous day's closing price, it can be judged as a top reversal and a sell signal is generated.
This part of the strategy also combines the Stochastic indicator to determine whether it is overbought or oversold to filter out non-reversal trading signals.
KST Indicator Principle
In the KST indicator, ROC represents the rate of change in price, calculating the ROCs of 6 days, 10 days, 15 days and 20 days respectively, and performing weighted summation after different parameter moving average smoothing to construct the KST indicator.
When the fast line crosses above the slow line, it is judged as bullish; when the fast line crosses below the slow line, it is judged as bearish. Here, the fast line is the original KST value, and the slow line is the moving average of KST.
This strategy uses KST>0 to judge bullish and KST<0 to judge bearish.
Signal Merge
The Judgment signals of the 123 reversal strategy and the KST indicator are combined:
- If both signals are the same, a trading signal is generated in that direction
- If the two signals are different, no trading occurs
It can be seen that this strategy comprehensively uses two different types of technical indicators, the reversal pattern and indicator judgment, and combines their signal strengths to design a more advanced quantitative trading strategy.
Advantages of the Strategy
- The reversal part can effectively identify turning points, and the indicator part can track trends, complementing each other
- Filtering with dual indicators can improve signal quality and reduce false signals
- Flexible adjustment of KST parameters for optimization for stocks of different cycles
- Can adapt to high volatility stocks, can also be used for relatively stable stocks
Risks of the Strategy
- Risk of reversal failure, reversal signal may also be false breakout
- Some opportunities may be missed after signal merge
- Improper KST parameters may greatly interfere with results
- When stock price fluctuates sharply, KST lags, inconsistent signals may appear
Methods like parameter adjustment, optimization of reversal logic, introduction of stop loss mechanism can be used to control risks.
Optimization Direction
- Optimize Stochastic Parameters
- Optimize length parameters of KST line
- Add trading volume or volatility index filter
- Add trend judgment to avoid trading against trend
- Introduce stop loss mechanism
Conclusion
This strategy integrates multiple different types of technical indicators. Through dual confirmation and combination optimization, it scientifically designs a relatively strong quantitative trading strategy, and it is a model of strategy combination. Its performance in live trading is yet to be further verified, but from the theoretical conceptualization perspective, it comprehensively considers multiple scenarios, solves the limitations of single indicators, and is worth further research and application.
[/trans]
Strategy Arguments
| Argument | Default | Description |
|---|---|---|
| v_input_1 | true | ---- 123 Reversal ---- |
| v_input_2 | 14 | Length |
| v_input_3 | true | KSmoothing |
| v_input_4 | 3 | DLength |
| v_input_5 | 50 | Level |
| v_input_6 | false | Trade reverse |
Source (PineScript)
/*backtest
start: 2023-10-22 00:00:00
end: 2023-11-21 00:00:00
period: 1h
basePeriod: 15m
exchanges: [{"eid":"Futures_Binance","currency":"BTC_USDT"}]
*/

//@version=4
////////////////////////////////////////////////////////////
//  Copyright by HPotter v1.0 23/03/2021
// This is combo strategies for get a cumulative signal.
//
// First strategy
// This System was created from the Book "How I Tripled My Money In The
// Futures Market" by Ulf Jensen, Page 183. This is reverse type of strategies.
// The strategy buys at market, if close price is higher than the previous close
// during 2 days and the meaning of 9-days Stochastic Slow Oscillator is lower than 50.
// The strategy sells at market, if close price is lower than the previous close price
// during 2 days and the meaning of 9-days Stochastic Fast Oscillator is higher than 50.
//
// Second strategy
// This indicator really is the KST indicator presented by Martin Pring.
// the KST indicator is a weighted summed rate of change oscillator that
// is designed to identify meaningful turns. Various smoothed rate of change
// indicators can be combined to form different measurements of cycles.
//
// WARNING:
// - For purpose educate only
// - This script to change bars colors.
////////////////////////////////////////////////////////////
Reversal123(Length, KSmoothing, DLength, Level) =>
    vFast = sma(stoch(close, high, low, Length), KSmoothing)
    vSlow = sma(vFast, DLength)
    pos = 0.0
    pos := iff(close[2] < close[1] and close > close[1] and vFast < vSlow and vFast > Level, 1,
	         iff(close[2] > close[1] and close < close[1] and vFast > vSlow and vFast < Level, -1, nz(pos[1], 0)))
	pos


MROC() =>
    pos = 0.0
    xROC6 = sma(roc(close, 6), 10)
    xROC10 = sma(roc(close, 10), 10)
    xROC15 = sma(roc(close, 15), 9)
    xROC20 = sma(roc(close, 20), 15)
    nRes = xROC6 + (2 * xROC10) + (3 * xROC15) + (4 * xROC20)
    pos := iff(nRes > 0, 1,
    	     iff(nRes < 0, -1, nz(pos[1], 0)))
    pos

strategy(title="Combo Backtest 123 Reversal & MovROC (KST indicator)", shorttitle="Combo", overlay = true)
line1 = input(true, "---- 123 Reversal ----")
Length = input(14, minval=1)
KSmoothing = input(1, minval=1)
DLength = input(3, minval=1)
Level = input(50, minval=1)
//-------------------------
reverse = input(false, title="Trade reverse")
posReversal123 = Reversal123(Length, KSmoothing, DLength, Level)
posMROC = MROC()
pos = iff(posReversal123 == 1 and posMROC == 1 , 1,
	   iff(posReversal123 == -1 and posMROC == -1, -1, 0))
possig = iff(reverse and pos == 1, -1,
          iff(reverse and pos == -1 , 1, pos))
if (possig == 1 )
    strategy.entry("Long", strategy.long)
if (possig == -1 )
    strategy.entry("Short", strategy.short)
if (possig == 0)
    strategy.close_all()
barcolor(possig == -1 ? #b50404: possig == 1 ? #079605 : #0536b3 )
Detail
https://www.fmz.com/strategy/432883
Last Modified
2023-11-22 14:49:41