
9.0 KiB
Name
双移动均线金叉死叉反转策略Dual-Moving-Average-Crossover-Reversal-Strategy
Author
ChaoZhang
Strategy Description
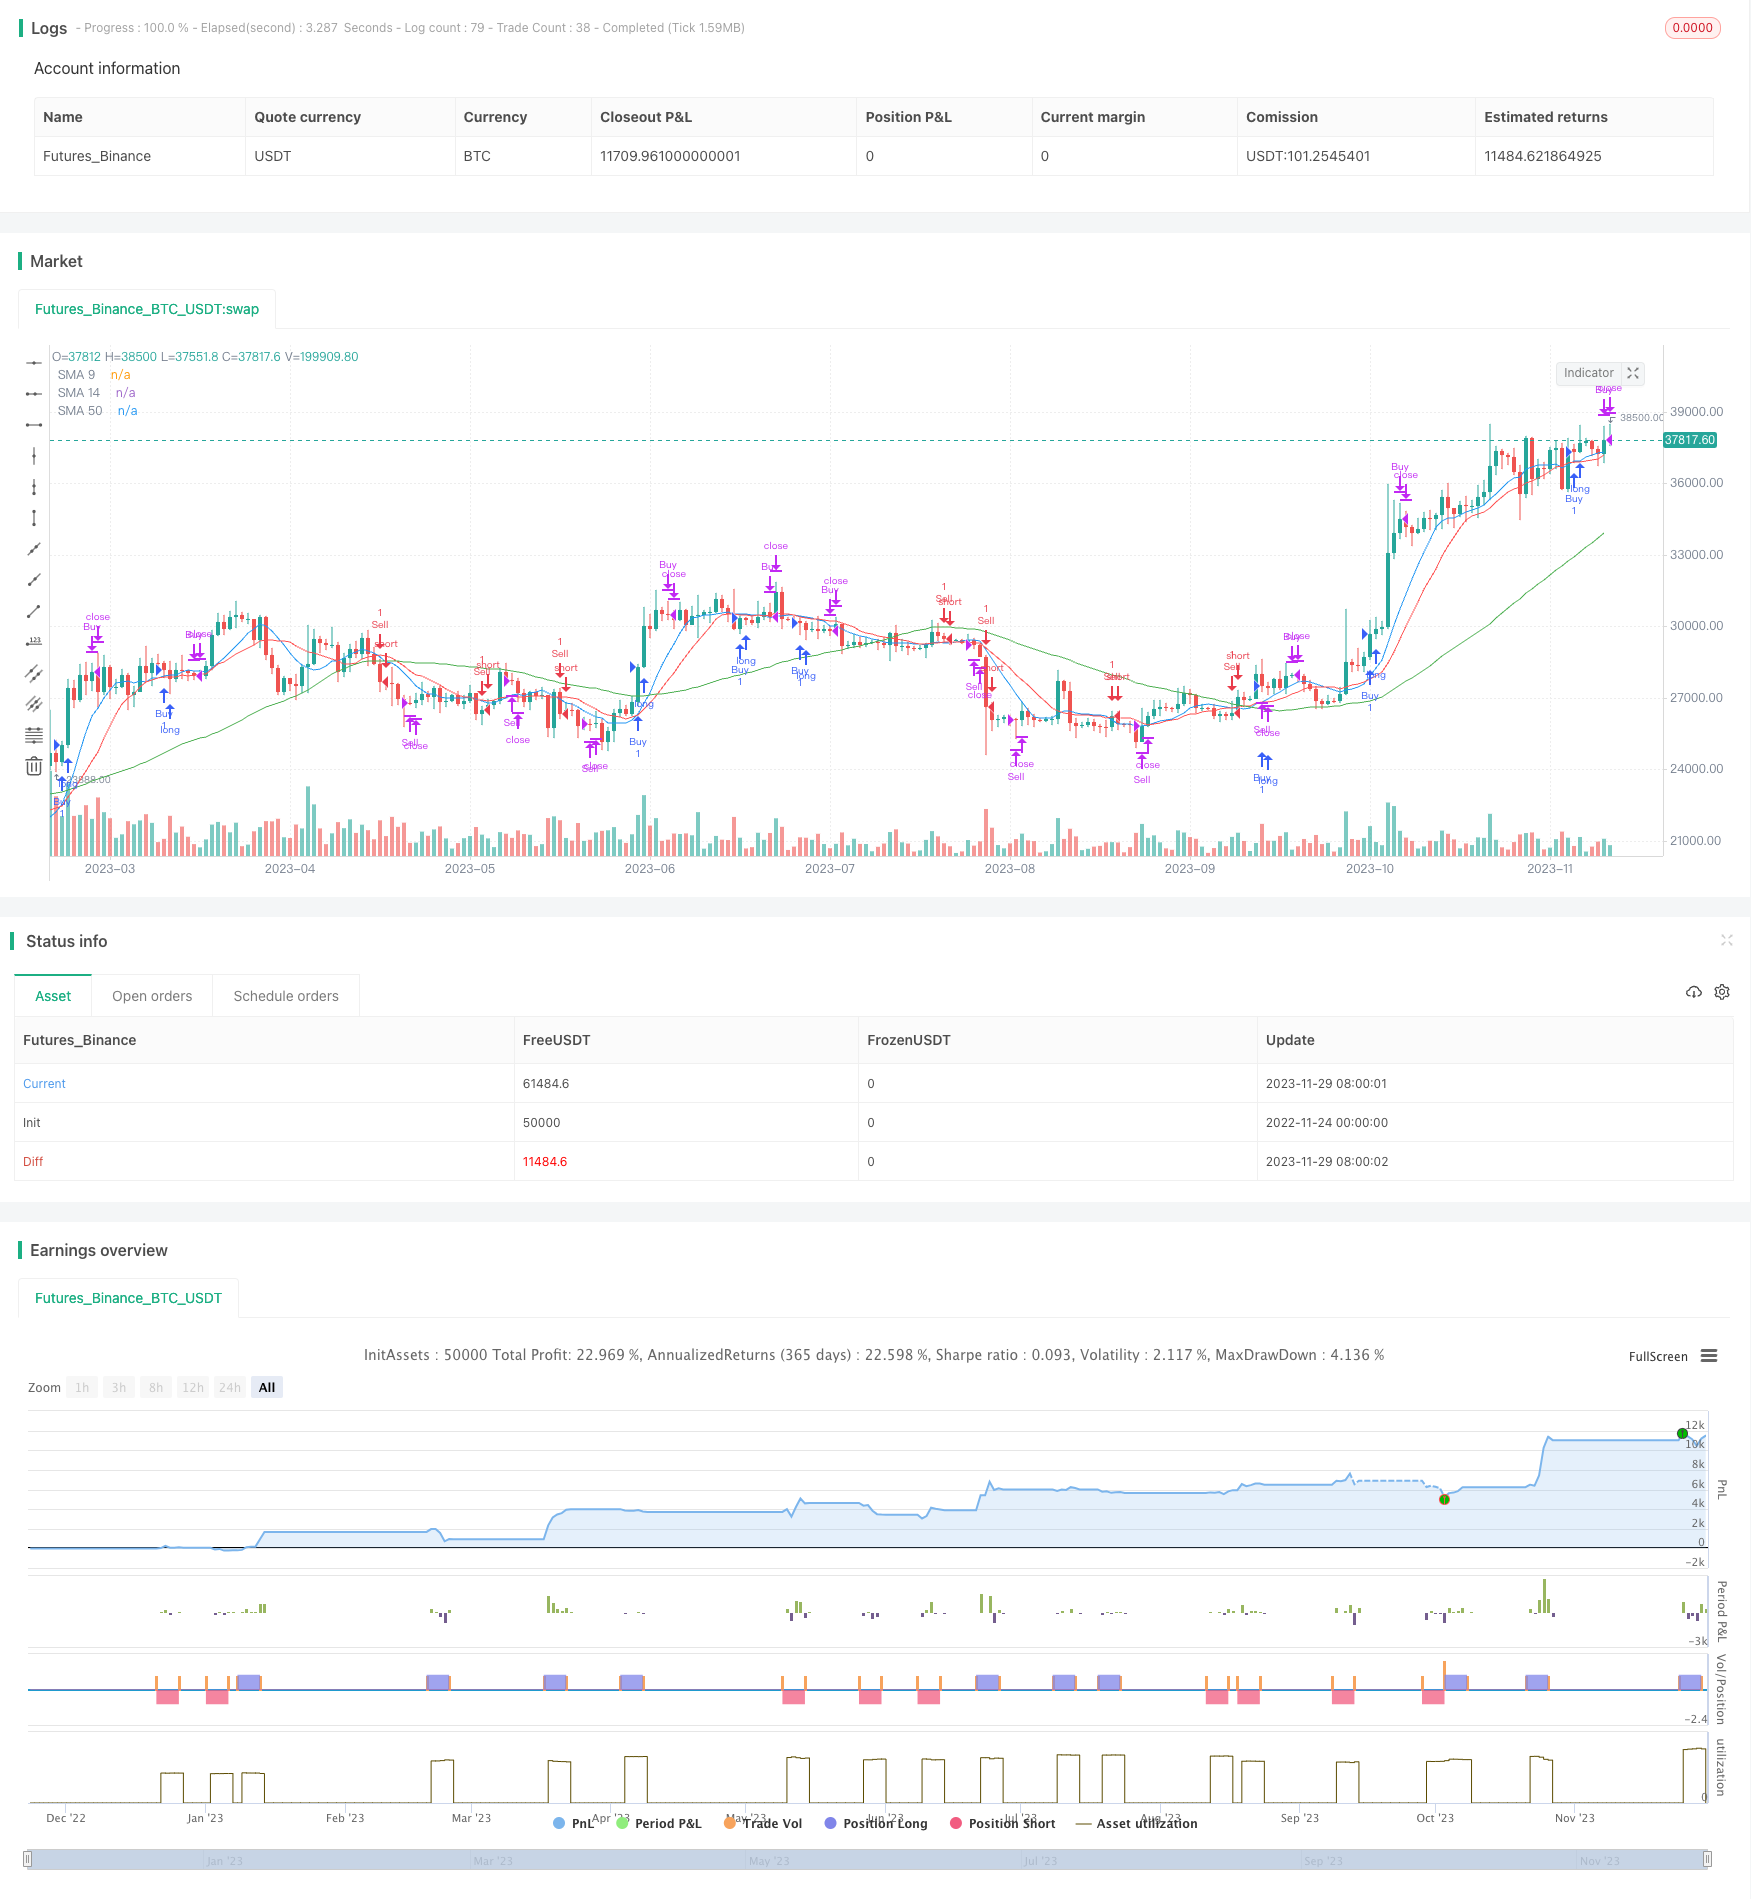 [trans]
概述
双移动均线金叉死叉反转策略是一种典型的跟踪趋势的量化交易策略。该策略运用双移动均线指标中的9日线和14日线构建买入和卖出信号。当9日线从下方突破14日线而形成金叉时买入,当9日线从上方突破14日线而形成死叉时卖出。为过滤假信号,策略还引入50日线指标判断价格是否突破。
策略原理
该策略主要基于双移动均线指标的金叉和死叉信号进行交易。双移动均线中,9日线代表短期趋势,14日线代表中期趋势,它们的交叉为判断市场趋势转折的有效技术指标。当短期趋势线从下方突破中期趋势线而形成金叉时,代表短期趋势线走强,属于买入信号;当从上方突破而形成死叉时,代表短期趋势线走弱,属于卖出信号。
另外,策略还引入50日线来过滤误导信号。只有当价格高于50日线时,才产生买入;只有当价格低于50日线时,才产生卖出。50日线代表了中长期趋势,只有中长期趋势同意,才进行短期操作。
核心代码逻辑如下:
// 买入条件:9日线上穿14日线 且 当前价格高于50日线
buyCondition = ta.crossover(sma9, sma14) and close > sma50

// 卖出条件:9日线下穿14日线 且 当前价格低于50日线
sellCondition = ta.crossunder(sma9, sma14) and close < sma50
优势分析
双移动均线策略优势明显:
- 操作简单,容易理解实现,适合新手学习;
- 顺势而为,避免在震荡行情中被套。
- 借助中长期指标过滤误导信号,避免被短期市场noise欺骗;
- 可跟踪趋势行情,持续高效盈利。
风险分析
双移动均线策略也存在一定的风险:
- 在极端行情中,如熊市崩盘,尚未形成死叉就已经出现大幅下跌行情。此时策略会持有大量浮亏头寸直至死叉形成止损。
- 震荡行情中,金叉和死叉交替出现,不断打开又止损头寸。此时会产生较多交易成本。
针对风险,可做如下优化:
- 进一步引入其他指标组合,在崩盘行情中快速止损。
- 增加开仓过滤条件,避免震荡行情的金叉死叉交替。
优化方向
双移动均线策略可从以下几个方面进行优化:
- 参数优化。调整移动均线的周期参数,优化指标参数。
- 进一步过滤开仓信号。组合更多指标判断行情,避免误导。
- 引入止损机制。设置移动止损、突破止损等止损方式。
- 结合其它交易策略。与交易量策略、波动率策略等组合使用。
- 适当使用杠杆。提高operation效率。
总结
双移动均线策略整体而言是一种有效率盈利的策略。它可以顺势而为,持续盈利;同时也存在一定风险,需要进一步完善。通过参数优化、止损方式以及策略组合,可以进一步增强该策略的效果。
||
Overview
The Dual Moving Average Crossover Reversal strategy is a typical quantitative trading strategy that tracks trends. The strategy utilizes the crossover signals from the 9-day line and 14-day line in the dual moving average indicator to construct buy and sell signals. It buys when the 9-day line breaks through the 14-day line from below to form a golden cross, and sells when the 9-day line breaks through the 14-day line from above to form a death cross. To filter false signals, the strategy also introduces the 50-day line indicator to determine if the price breaks through.
Strategy Principle
This strategy mainly trades based on the golden cross and death cross signals from the dual moving average indicator. In the dual moving averages, the 9-day line represents short-term trends, the 14-day line represents medium-term trends, and their crossover is an effective technical indicator for judging turns in market trends. When the short-term trend line breaks through the medium-term trend line from below to form a golden cross, it indicates the short-term trend line is strengthening, which is a buy signal; when it breaks through from above to form a death cross, it indicates the short-term trend line is weakening, which is a sell signal.
In addition, the strategy also introduces the 50-day line to filter misleading signals. It only generates a buy when the price is above the 50-day line; and only generates a sell when the price is below the 50-day line. The 50-day line represents medium to long term trends. Only when medium to long term trends agree, short term operations are carried out.
The core logic is as follows:
// Buy condition: 9-day line crosses above 14-day line and close price is above 50-day line
buyCondition = ta.crossover(sma9, sma14) and close > sma50

// Sell condition: 9-day line crosses below 14-day line and close price is below 50-day line
sellCondition = ta.crossunder(sma9, sma14) and close < sma50
Advantage Analysis
The advantages of the dual moving average strategy are obvious:
- Simple to understand and implement, suitable for beginners to learn.
- Go with the trend, avoid being trapped in range-bound markets.
- Use medium to long term indicators to filter misleading signals and avoid being fooled by short-term market noise.
- Can track trending markets and profit efficiently for extended periods.
Risk Analysis
The dual moving average strategy also has some risks:
- In extreme market conditions such as market crashes, there can be large drawdowns before a death cross forms. The strategy will hold onto large losing positions until a death cross triggers stops.
- In ranging markets, golden crosses and death crosses alternate, repeatedly opening and stopping out positions. This generates increased transaction costs.
To address the risks, optimizations such as below can be made:
- Introduce other indicators to quickly cut losses in crashing market conditions.
- Add more opening filters to avoid alternating crosses in ranging markets.
Optimization Directions
The dual moving average strategy can be optimized in several aspects:
- Parameter optimization. Adjust moving average periods, optimize indicator parameters.
- Further filter opening signals. Incorporate more indicators to judge market conditions and avoid false signals.
- Introduce stop loss mechanisms. Employ moving stop loss, penetration stop loss and other stop methods.
- Combine with other trading strategies such as volume and volatility strategies.
- Appropriately employ leverage to improve operational efficiency.
Summary
The dual moving average strategy is generally an efficient profit-generating strategy. It can profit by following trends continuously. At the same time, it has certain risks and needs further improvement. By optimizing parameters, stop methods and strategy combinations, the effects of this strategy can be further enhanced.
[/trans]
Strategy Arguments
| Argument | Default | Description |
|---|---|---|
| v_input_1 | 9 | SMA 9 Length |
| v_input_2 | 14 | SMA 14 Length |
| v_input_3 | 50 | SMA 50 Length |
Source (PineScript)
/*backtest
start: 2022-11-24 00:00:00
end: 2023-11-30 00:00:00
period: 1d
basePeriod: 1h
exchanges: [{"eid":"Futures_Binance","currency":"BTC_USDT"}]
*/

//@version=5
strategy("smaCrossReverse", shorttitle="smaCrossReverse", overlay=true)

// Define the length for the SMAs
sma9Length = input(9, title="SMA 9 Length")
sma14Length = input(14, title="SMA 14 Length")
sma50Length = input(50, title="SMA 50 Length")  // Add input for SMA 50

// Calculate SMAs
sma9 = ta.sma(close, sma9Length)
sma14 = ta.sma(close, sma14Length)
sma50 = ta.sma(close, sma50Length)  // Calculate SMA 50

// Buy condition: SMA 9 crosses above SMA 14 and current price is above SMA 50
buyCondition = ta.crossover(sma9, sma14) and close > sma50

// Sell condition: SMA 9 crosses below SMA 14 and current price is below SMA 50
sellCondition = ta.crossunder(sma9, sma14) and close < sma50

// Track the time since position was opened
var float timeElapsed = na
if (buyCondition)
    timeElapsed := 0
else
    timeElapsed := na(timeElapsed[1]) ? timeElapsed[1] : timeElapsed[1] + 1

// Close the buy position after 5 minutes
if (timeElapsed >= 5)
    strategy.close("Buy")

// Track the time since position was opened
var float timeElapsedSell = na
if (sellCondition)
    timeElapsedSell := 0
else
    timeElapsedSell := na(timeElapsedSell[1]) ? timeElapsedSell[1] : timeElapsedSell[1] + 1

// Close the sell position after 5 minutes
if (timeElapsedSell >= 5)
    strategy.close("Sell")

// Plot the SMAs on the chart
plot(sma9, title="SMA 9", color=color.blue)
plot(sma14, title="SMA 14", color=color.red)
plot(sma50, title="SMA 50", color=color.green)  // Plot SMA 50 on the chart

// Strategy entry and exit conditions using if statements
if (buyCondition)
    strategy.entry("Buy", strategy.long)

if (sellCondition)
    strategy.entry("Sell", strategy.short)
Detail
https://www.fmz.com/strategy/433950
Last Modified
2023-12-01 16:56:43