
14 KiB
Name
双移动均线交叉策略Dual-Moving-Average-Crossover-Strategy
Author
ChaoZhang
Strategy Description
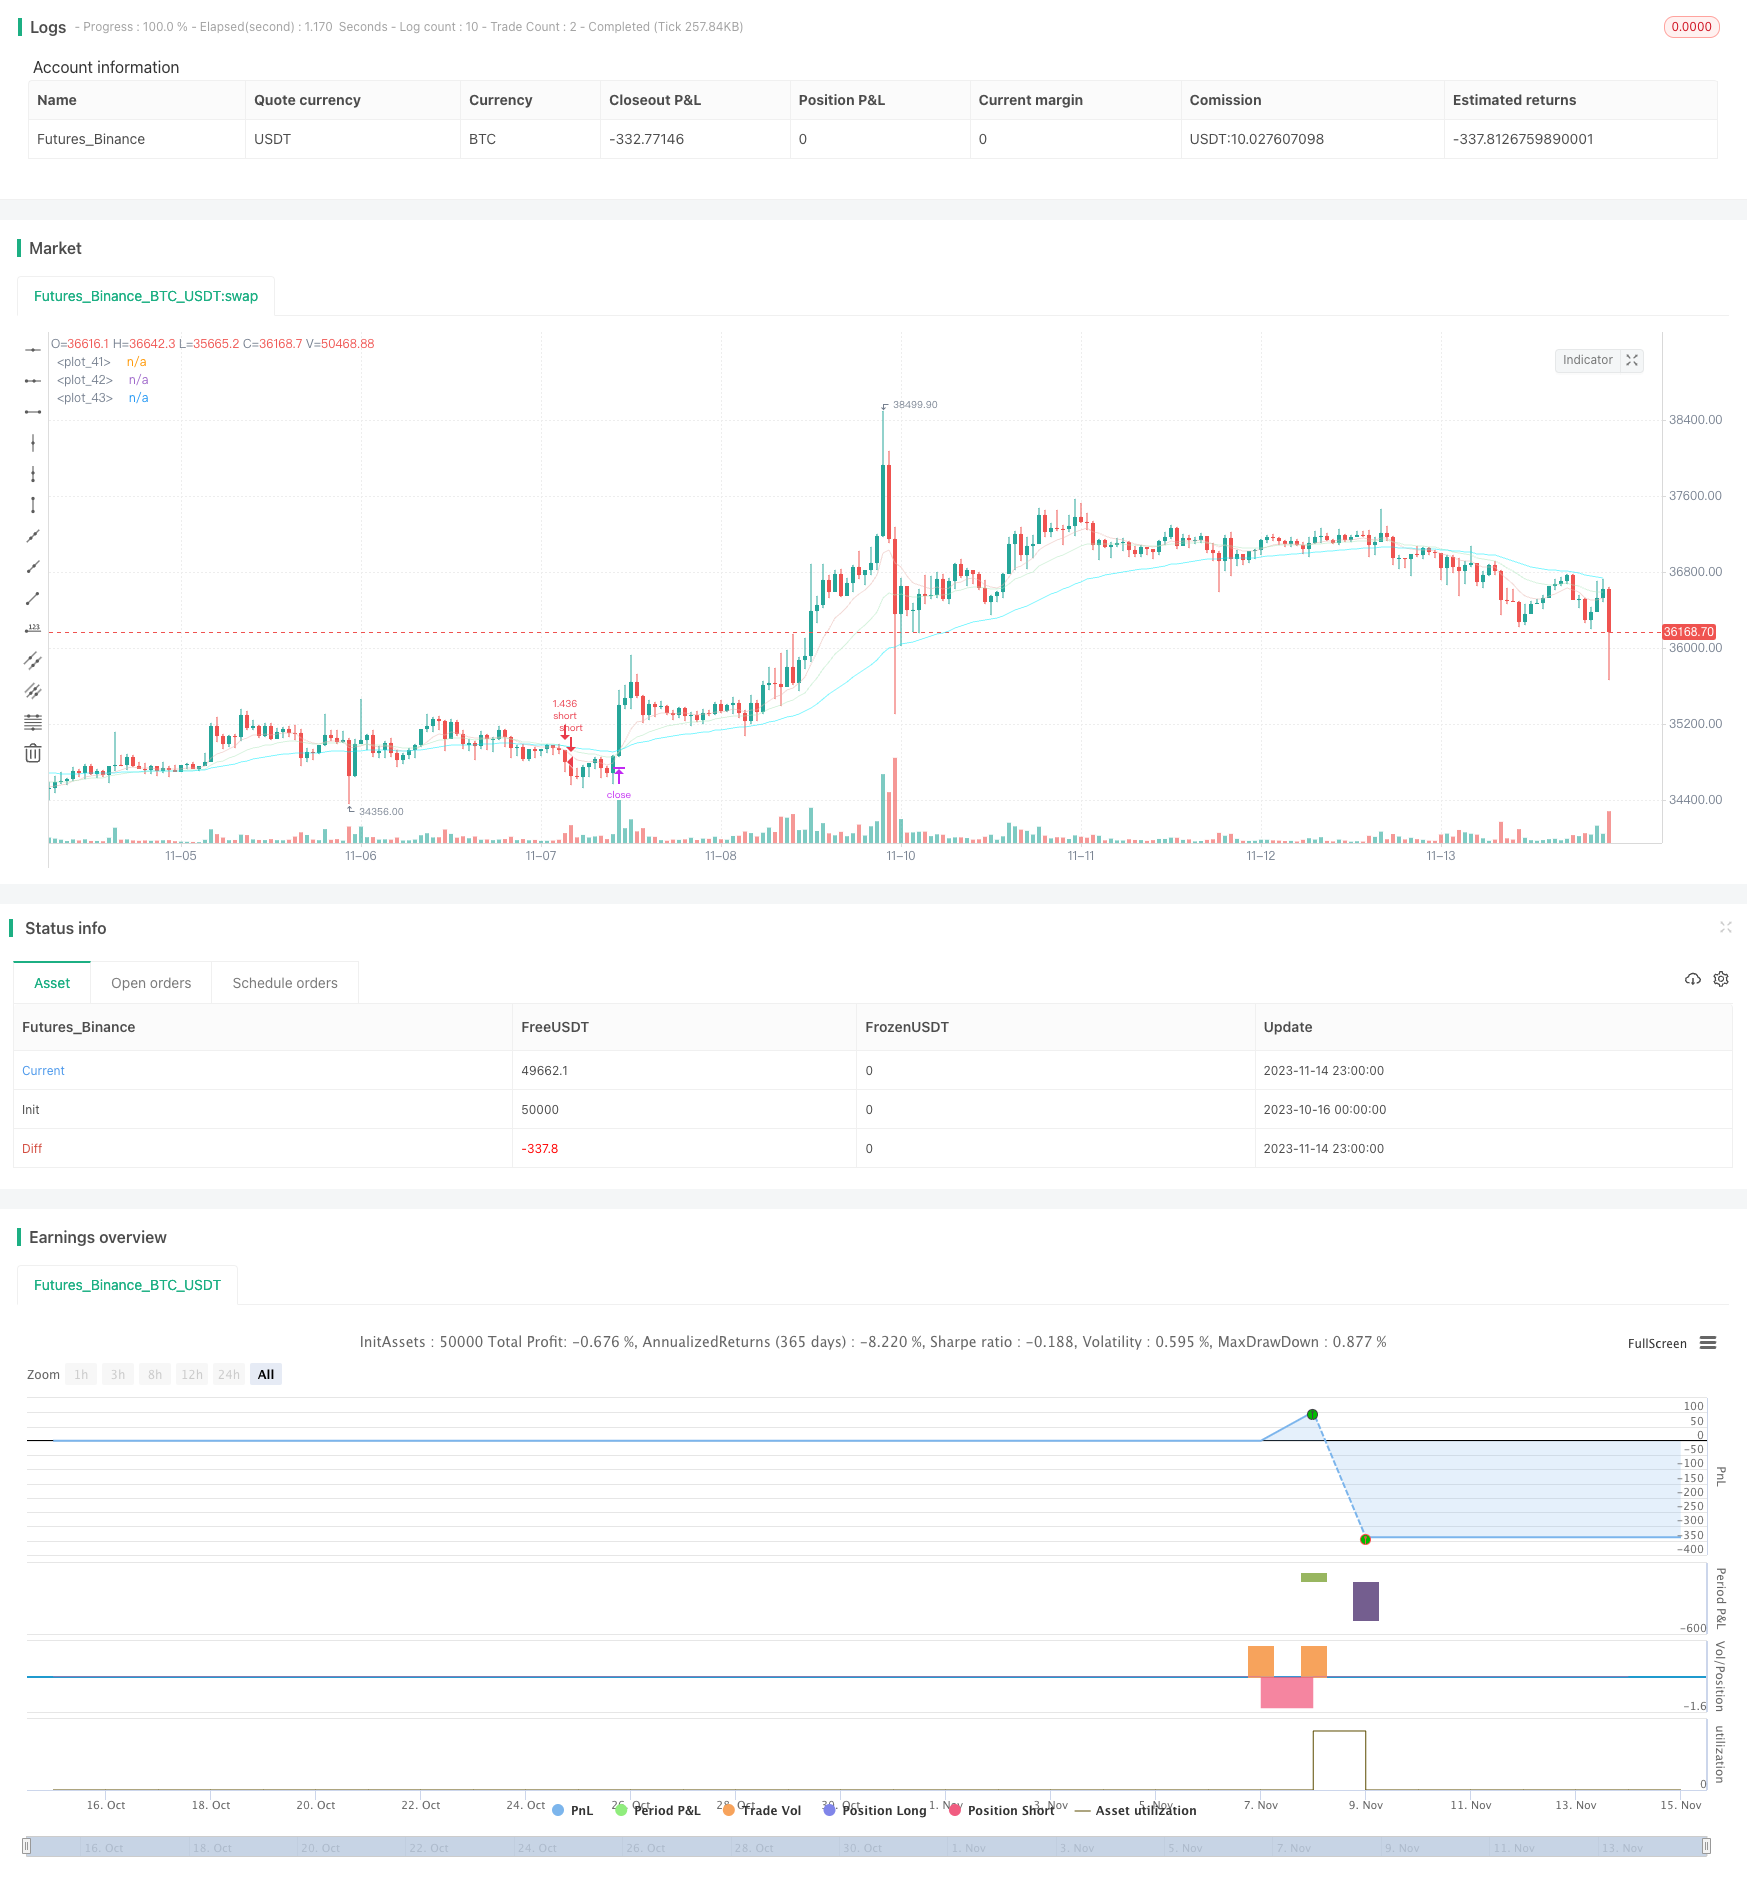 [trans]
概述
双移动均线交叉策略通过计算不同周期的移动均线,判断价格趋势方向,实现趋势跟踪。当短周期均线上穿长周期均线时做多,当短周期均线下穿长周期均线时做空,属于典型的趋势跟踪策略。
策略原理
该策略基于9周期、21周期和50周期的指数移动均线(EMA)。其中,9周期EMA代表短期趋势,21周期EMA代表中期趋势,50周期EMA代表长期趋势。
当9周期EMA上穿21周期EMA时,表示短期趋势转为上升,做多;当9周期EMA下穿21周期EMA时,表示短期趋势转为下降,做空。这里using了交叉函数crossover()来判断均线的交叉情况。
代码中设置了长仓和空仓的开仓、止盈、止损逻辑。开仓条件为均线上穿或下穿。多头止盈为进入价×(1+ 输入的止盈比例),空头止盈为进入价×(1- 输入的止盈比例)。多头止损为进入价×(1- 输入的止损比例),空头止损为进入价×(1+ 输入的止损比例)。
此外,代码还加入了一些过滤条件,如趋势性过滤,要求均线上下穿之前的K线不能震荡,以及资金利用率过滤,要求策略权益不能低于N天均线,避免亏损过多时仍然交易。这些过滤条件可以一定程度上避免虚假信号。
总的来说,该策略使用双EMA交叉来判断价格趋势方向,以及合理的止盈止损逻辑,可以捕捉中长线趋势。但作为单因素策略,其信号可能不够稳定,可进一步优化。
优势分析
- 使用双移动均线交叉判断趋势方向,原理简单,容易理解实现。
- 采用不同周期EMA,可以对长短期趋势进行判断。
- 设置止盈止损逻辑,可以锁定盈利,控制风险。
- 加入过滤条件,可以一定程度上过滤假信号。
- 可以自由设置参数,优化周期组合,适应不同市场环境。
风险分析
- 作为单因素策略,交易信号可能不够稳定。价格震荡时,可能出现多次无谓交易。
- EMA交叉时,价格可能已运行一段距离,存在追高杀跌风险。
- 未考虑交易成本,实盘时收益可能减少。
- 未设立止损,无法控制极端行情下的亏损。
应对方法:
- 优化MA周期参数,使信号更稳定。
- 结合其他指标过滤信号。
- 加大交易数量,降低成本影响。
- 设置止损点,限制最大损失。
优化方向
该策略可以从以下方面进行优化:
-
优化移动均线的周期参数,找到最佳周期组合。可以引入自适应优化技术,动态优选周期。
-
增加其他技术指标过滤信号,如MACD,KD等,提高信号质量。或引入机器学习对信号进行评分,自动过滤虚假信号。
-
结合交易量分析。如突破均线但交易量不足时,不采信信号。
-
在突破发生时,考察前期的波动情况,如在震荡区间突破,可能是假突破。
-
建立动态止损机制,如跟踪型止损、Chandelier Exit等,减小止损距离,但确保止损有效。
-
优化仓位管理,如固定仓位、动态仓位、杠杆仓位等,让盈亏比例更合理。
-
全面考虑交易成本,滑点影响。优化止盈止损比例,确保策略在实盘中依然盈利。
总结
本策略整体结构合理,原理简单,通过双EMA交叉判断趋势方向,并设置了止盈止损逻辑,可以捕捉趋势。但作为单因素策略,可进一步优化参数设定、信号过滤等,使策略更稳健。加入止损和仓位管理等机制后,可以进一步降低风险。整体来说,该策略提供了一个可靠的趋势跟踪策略框架,在优化调整后可以获得稳定的投资回报。
||
Overview
The Dual Moving Average Crossover strategy judges the price trend direction by calculating moving averages of different periods, and realizes trend following. It goes long when the short period MA crosses over the long period MA, and goes short when the short period MA crosses below the long period MA. It is a typical trend following strategy.
Strategy Logic
This strategy is based on 9, 21 and 50 period Exponential Moving Averages (EMA). The 9 period EMA represents the short term trend, 21 period EMA represents the medium term trend, and 50 period EMA represents the long term trend.
When the 9 period EMA crosses over the 21 period EMA, it signals an uptrend in the short term, thus going long. When the 9 period EMA crosses below the 21 period EMA, it signals a downtrend in the short term, thus going short. The crossover() function is used here to determine the crossover between the MAs.
The logic for long/short entry, take profit and stop loss is configured. The entry condition is the crossover of the MAs. Long take profit is entry price * (1 + input take profit ratio), short take profit is entry price * (1 - input take profit ratio). Long stop loss is entry price * (1 - input stop loss ratio), short stop loss is entry price * (1 + input stop loss ratio).
Some filters are also added, like trend filter to avoid sideways, and equity filter to avoid trading when strategy equity is too low. These filters can help avoid some false signals.
In summary, this strategy uses dual EMA crossovers to determine price trend direction, with proper take profit and stop loss logic, which can capture mid to long term trends. But as a single factor strategy, the signals may not be stable enough and can be further optimized.
Advantage Analysis
-
Using dual MA crossovers to determine trend direction, the logic is simple and easy to understand.
-
Adopting EMAs of different periods can judge short and long term trends.
-
Take profit and stop loss logic locks in profit and controls risk.
-
Filters help avoid some false signals to some extent.
-
Parameters can be freely configured, periods can be optimized for different market environments.
Risk Analysis
-
As a single factor strategy, trading signals may not be stable enough. Whipsaws may occur during price consolidations.
-
When crossover happens, price may have already run up/down a stretch, with risk of buying high and selling low.
-
Trading costs are not considered, actual returns could be lower.
-
No stop loss in place, risks unlimited loss in extreme market conditions.
Solutions:
-
Optimize MA periods for more stable signals.
-
Add other indicators to filter signals.
-
Increase trade size to lower cost impact.
-
Set proper stop loss to limit maximum loss.
Optimization Directions
The strategy can be optimized in the following aspects:
-
Optimize MA periods to find best combinations, or use adaptive optimization to dynamically select best periods.
-
Add other technical indicators like MACD, KD etc to filter signals and improve quality, or use machine learning to score signals and filter false ones.
-
Incorporate volume analysis. Do not take signal if volume is insufficient on MA crossover.
-
Check price fluctuations before crossover happens. Crossover in ranging market may be false signal.
-
Build dynamic stop loss mechanisms like trailing stop loss, Chandelier Exit etc, to reduce stop loss distance but keep it effective.
-
Optimize position sizing like fixed/dynamic/leveraged, to achieve more reasonable profit/loss ratios.
-
Comprehensively consider trading costs, slippage. Optimize take profit/stop loss ratios to ensure profitability in live trading.
Conclusion
The overall structure of this strategy is sound, with simple logic of dual EMA crossover to determine trend direction, coupled with take profit and stop loss logic to capture trends. As a single factor strategy, it can be further optimized on parameters, signal filters etc to make it more robust. With proper stop loss and position sizing, risks can be further reduced. Overall, it provides a solid trend following strategy framework, which can achieve consistent profits after optimizations and adjustments.
[/trans]
Strategy Arguments
| Argument | Default | Description |
|---|---|---|
| v_input_1 | true | include longs? |
| v_input_2 | true | condition two? |
| v_input_3 | true | condition three? |
| v_input_4 | true | include shorts? |
| v_input_5 | true | condition two? |
| v_input_6 | true | condition three? |
| v_input_7 | 200 | lookback for average range (bars) |
| v_input_8 | true | filter trades if range is less than (%) |
| v_input_9 | 40 | filter trades if equity is below ema() |
| v_input_10 | true | sideways filter? |
| v_input_11 | true | equity filter? |
| v_input_12 | true | long TP % |
| v_input_13 | 0.4 | long SL % |
| v_input_14 | true | short TP % |
| v_input_15 | 0.4 | short SL % |
Source (PineScript)
/*backtest
start: 2023-10-16 00:00:00
end: 2023-11-15 00:00:00
period: 1h
basePeriod: 15m
exchanges: [{"eid":"Futures_Binance","currency":"BTC_USDT"}]
*/

// This source code is subject to the terms of the Mozilla Public License 2.0 at https://mozilla.org/MPL/2.0/
// © TradingMentalist

//@version=4
strategy("Initial template",initial_capital=1000, overlay=true, pyramiding=0, commission_type=strategy.commission.percent, commission_value=0.04, default_qty_type = strategy.percent_of_equity, default_qty_value = 100, currency = currency.USD)

////////////////////////////////////////////////////////////////////////////////////////////////////////////////////////////////////////////////inputs
//turn on/off longs/shorts / extraneous conditions
longinc=input(true, title="include longs?")
lConSw2=input(true, title="condition two?")
lConSw3=input(true, title="condition three?")
shotinc=input(true, title="include shorts?")
sConSw2=input(true, title="condition two?")
sConSw3=input(true, title="condition three?")

//turn on/off / adjust trade filters (average range/average equity)
sidein2     = input(200, step=10, title='lookback for average range (bars)')
sidein      = input(1, title='filter trades if range is less than (%)')/100
equityIn    = input(40, title='filter trades if equity is below ema()')
sidewayssw  = input(true, title='sideways filter?')
equitysw    = input(true, title='equity filter?')
longtpin    = input(1,step=0.1, title='long TP %')/100
longslin    = input(0.4,step=0.1, title='long SL %')/100
shorttpin   = input(1,step=0.1, title='short TP %')/100
shortslin   = input(0.4,step=0.1, title='short SL %')/100

////////////////////////////////////////////////////////////////////////////////////////////////////////////////////////////////////////////////filters
//(leave as is)
side1       = (close[1] + close[sidein2]) / 2
side2       = close[1] - close[sidein2]
side3       = side2 / side1
notsideways = side3 > sidein
equityMa    = equitysw ? ema(strategy.equity, equityIn) : 0
equityCon   = strategy.equity >= equityMa

////////////////////////////////////////////////////////////////////////////////////////////////////////////////////////////////////////////////indicators
ma1 = ema(close, 9)
ma2 = ema(close, 21)
ma3 = ema(close, 50)

plot(ma1, color=color.new(#E8B6B0,50))
plot(ma2, color=color.new(#B0E8BE,50))
plot(ma3, color=color.new(#00EEFF,50))

////////////////////////////////////////////////////////////////////////////////////////////////////////////////////////////////////////////////conditions
//adjust conditions
//-------------------------------------------
longCondition1  = crossover(ma2,ma3)
longCondition2  = close[5] > close[10]
longCondition3  = close[1] > close[2]

shortCondition1 = crossover(ma3,ma2)
shortCondition2 = close[5] < close[10]
shortCondition3 = close[1] < close[2]

closelong       = shortCondition1
closeshort      = longCondition1
//-------------------------------------------

//(leave as is)
longCondition1in  = longCondition1
longCondition2in  = lConSw2 ? longCondition2 : true
longCondition3in  = lConSw3 ? longCondition3 : true
shortCondition1in = shortCondition1
shortCondition2in = sConSw2 ? shortCondition2: true
shortCondition3in = sConSw3 ? shortCondition3: true
longConditions    = longCondition1in and longCondition2in and longCondition3in
shortConditions   = shortCondition1in and shortCondition2in and shortCondition3in

////////////////////////////////////////////////////////////////////////////////////////////////////////////////////////////////////////////////execution
//(leave as is)
long            = sidewayssw ? notsideways and equityCon and longConditions : equityCon and longConditions
short           = sidewayssw ? notsideways and equityCon and shortConditions : equityCon and shortConditions

////////////////////////////////////////////////////////////////////////////////////////////////////////////////////////////////////////////////risk
//(leave as is)
longtplevel     = strategy.position_avg_price * (1 + longtpin)
longsllevel     = strategy.position_avg_price * (1 - longslin)
shorttplevel    = strategy.position_avg_price * (1 - shorttpin)
shortsllevel    = strategy.position_avg_price * (1 + shortslin)

///////////////////////////////////////////////////////////////////////////////////////////////////////////////////////////////////////////////timeframe
//adjust timeframe
//-------------------------------------------
startyear   = 2000
startmonth  = 1
startday    = 1

stopyear    = 9999
stopmonth   = 12
stopday     = 31
//-------------------------------------------

//(leave as is)
startperiod = timestamp(startyear,startmonth,startday,0,0)
periodstop  = timestamp(stopyear,stopmonth,stopday,0,0)
timeframe()    =>
    time >= startperiod and time <= periodstop ? true : false

////////////////////////////////////////////////////////////////////////////////////////////////////////////////////////////////////////////////orders
//comments are empty characters for clear chart
if timeframe()
    if longinc
        if strategy.position_size == 0 or strategy.position_size > 0
            strategy.entry(id="long", long=true, when=long, comment=" ")
            strategy.exit("stop","long", limit=longtplevel, stop=longsllevel,comment=" ")
            strategy.close(id="long", when=closelong, comment = " ")
    if shotinc
        if strategy.position_size == 0 or strategy.position_size < 0
            strategy.entry(id="short", long=false, when=short, comment = " ")
            strategy.exit("stop","short", limit=shorttplevel, stop=shortsllevel,comment = " ")
            strategy.close(id="short", when=closeshort, comment = " ")
Detail
https://www.fmz.com/strategy/432363
Last Modified
2023-11-16 17:50:52