
11 KiB
Name
双均线ADX择时策略Dual-Moving-Average-ADX-Timing-Strategy
Author
ChaoZhang
Strategy Description
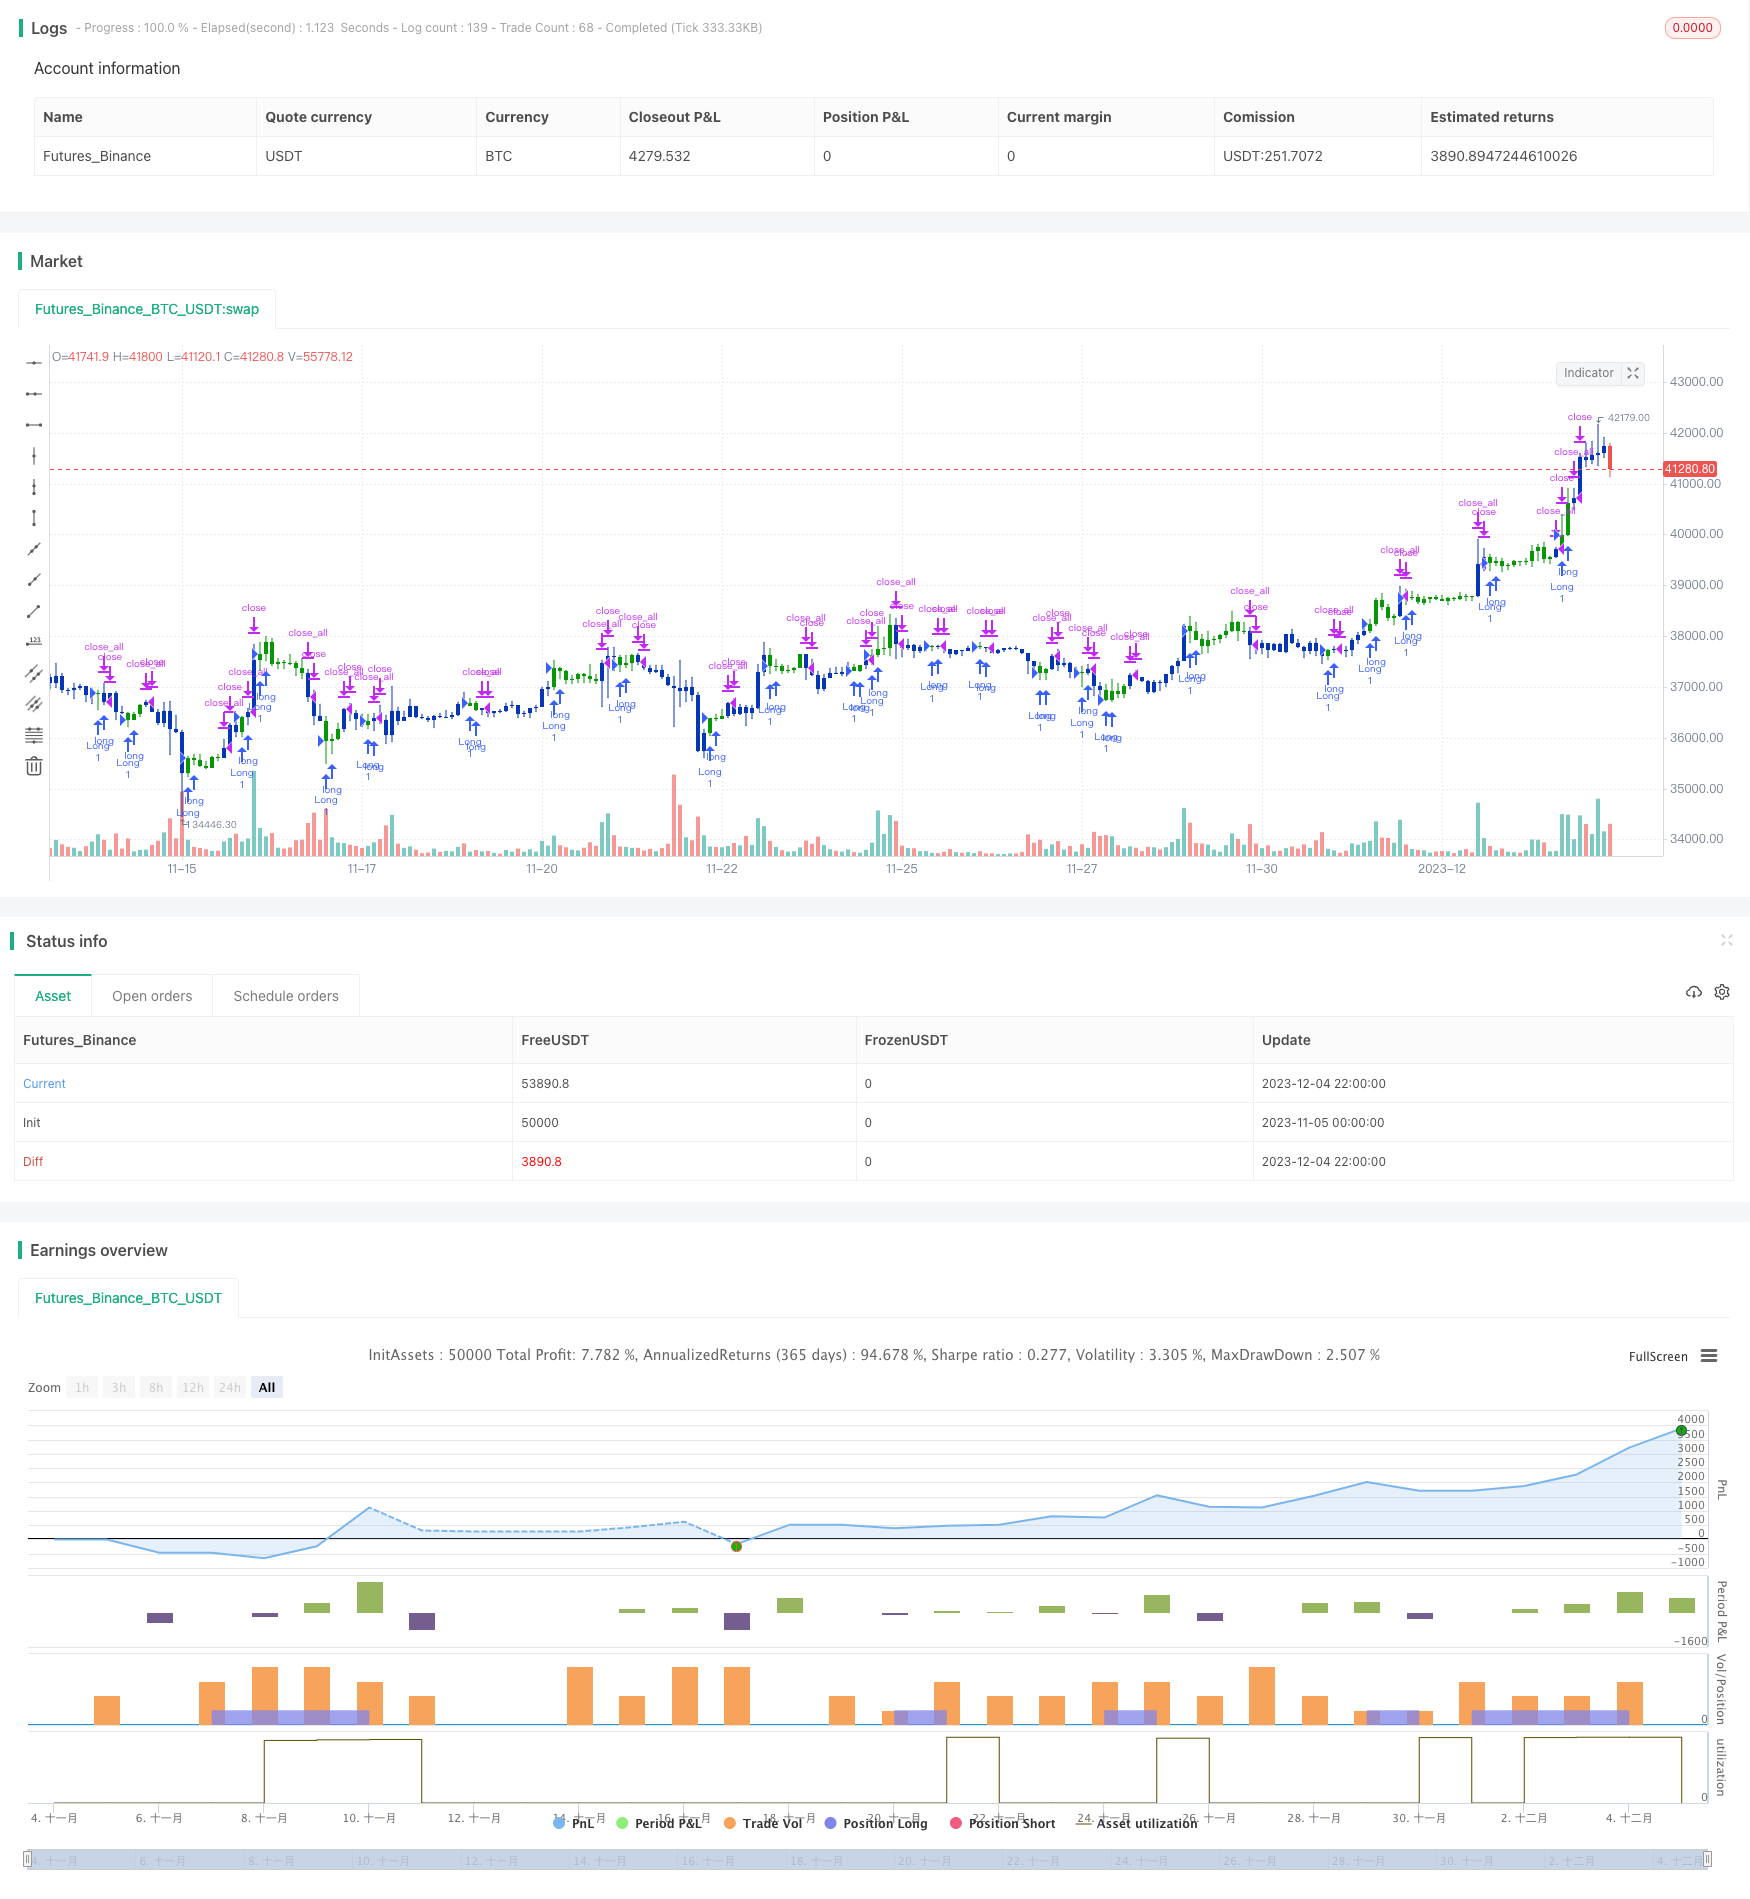 [trans]
概述
双均线ADX择时策略通过结合使用2/20均线和ADXR指标来识别趋势,在趋势开始阶段产生交易信号。该策略首先使用2/20指数移动平均线判断价格趋势方向,然后结合ADXR指标进一步确认趋势信号,从而产生更可靠的交易信号。
策略原理
双均线ADX择时策略的核心逻辑基于以下几个部分:
-
2/20指数移动平均线(EMA)
- 使用2日和20日两条不同参数的EMA。
- 当价格上穿2日EMA时视为看涨信号。
- 当价格下穿20日EMA时视为看跌信号。
-
ADXR指标
- ADXR指标是ADX指标的变种。
- 通过计算ADX的简单平均值来减少ADX指标的波动。
- ADXR低于某一阈值时说明趋势较弱。
- ADXR高于某一阈值时说明趋势较强。
-
交易信号
- 当2日EMA Golden Cross AND ADXR高于阈值时产生看涨信号。
- 当20日EMA Dead Cross AND ADXR低于阈值时产生看跌信号。
- 通过与ADXR指标的组合,可以过滤掉部分假断和加强真实趋势信号。
该策略的主要创新点在于运用ADXR指标识别初始阶段的趋势,并与传统均线策略的信号进行组合,从而提高信号质量,增强策略的稳定性。
策略优势
双均线ADX择时策略具有以下主要优势:
- 结合双均线和ADXR指标,信号更加准确可靠,可过滤假信号。
- 利用ADXR指标识别趋势的初始阶段,能够更早进入确定趋势。
- ADXR参数设置灵活,可根据市场调整,适应行情的变化。
- 策略逻辑简单清晰,容易理解,参数调整方便。
- 可在多种市场环境中运用,历史测试表现较好。
策略风险
双均线ADX择时策略也存在以下主要风险:
-
ADXR参数设置不当可能导致错失交易机会。
- 可适当扩大ADXR的参数范围,或根据不同品种调整参数。
-
特殊行情下可能出现较多假信号。
- 可考虑与其他指标组合使用,进一步过滤信号。
-
EMA参数固定,无法适应市场变化。
- 可尝试运用自适应EMA参数的优化版本。
-
无法识别价格震荡区间,可能产生过多无效交易。
- 可加入附加逻辑判断或指标识别震荡行情。
策略优化方向
双均线ADX择时策略可从以下几个方面进行进一步优化:
-
EMA参数优化,使其能根据行情自动变化。
-
ADXR参数范围优化,使其能包含更多有效交易信号。
-
加入附加趋势判断指标,组合生成信号,提升质量。
-
增加止损策略,设置止盈标准,控制单笔交易风险。
-
优化资金管理策略,使其能根据account状态自动调整仓位。
总结
双均线ADX择时策略通过传统双均线策略与ADXR指标的创新组合,提高了信号质量,增强了策略稳定性,能够有效识别趋势的开始阶段,历史回测表现较好。该策略优化空间较大,可从多方面进行改进,使其在更复杂的市场中表现出强大的适应能力和获利空间。
||
Overview
The Dual Moving Average ADX Timing strategy identifies trends by combining 2/20 moving averages and the ADXR indicator to generate trading signals at the beginning of trends. It first uses the 2/20 exponential moving averages to determine the price trend direction, then further confirms the trend signal in combination with the ADXR indicator, thus producing more reliable trading signals.
Strategy Logic
The core logic of the Dual Moving Average ADX Timing strategy is based on the following main components:
-
2/20 Exponential Moving Average (EMA)
- Uses 2 EMAs with different parameters of 2 and 20 days.
- A upward cross of price over 2-day EMA is considered a bullish signal.
- A downward cross of price below 20-day EMA is considered a bearish signal.
-
ADXR Indicator
- ADXR is a variant of the ADX indicator.
- It calculates a simple moving average of ADX to smooth out fluctuations.
- ADXR below a threshold implies weaker trend.
- ADXR above a threshold implies stronger trend.
-
Trading signals
- A bullish signal is generated when 2-day EMA Golden Cross AND ADXR is higher than threshold.
- A bearish signal is generated when 20-day EMA Dead Cross AND ADXR is lower than threshold.
- Combining with ADXR filters out some false breaks and enhances real trend signals.
The main innovation of this strategy is using ADXR indicator to identify trends in initial stage, and combining it with traditional moving average signals to improve quality and stability.
Advantages
The main advantages of the Dual Moving Average ADX Timing strategy:
- Combining dual MAs and ADXR, signals are more accurate and reliable with false signals filtered out.
- Identifying early trend by using ADXR to detect initial stage of trends.
- Flexible ADXR parameter tuning to adapt to changing market conditions.
- Simple and clear logic, easy to understand, convenient to adjust parameters.
- Applicable in various market environments with decent historical performance.
Risks
There are also several main risks for this strategy:
-
Improper ADXR parameter setting may lead to missing trades.
- Expand ADXR parameter range or adjust by products.
-
More false signals may occur in special market conditions.
- Consider combining with other indicators for further signal filtering.
-
Fixed EMA parameters fail to adapt to market changes.
- Test optimization version with adaptive EMA parameters.
-
Unable to identify trading ranges, may generate excessive insignificant trades.
- Add extra logic or indicators to detect ranging markets.
Enhancement Directions
The strategy can be further optimized and enhanced from the following aspects:
-
EMA parameter optimization for automatic adaptation to market conditions.
-
Expand ADXR parameter range for capturing more effective trading signals.
-
Add extra trend judgment indicators for combinational signals to improve quality.
-
Add stop loss strategies and take profit standards to control per trade risks.
-
Optimize money management for dynamic position sizing based on account status.
Conclusion
The Dual Moving Average ADX Timing strategy innovatively combines traditional dual moving averages and the ADXR indicator to improve signal quality and enhance stability. It can effectively identify the initial stage of trends with decent historical performance. The strategy has ample room for optimization to make it robust and profitable across more complex markets.
[/trans]
Strategy Arguments
| Argument | Default | Description |
|---|---|---|
| v_input_1 | 14 | Length ADX |
| v_input_2 | 14 | Length ADXR |
| v_input_float_1 | 13 | Signal1 |
| v_input_float_2 | 45 | Signal2 |
| v_input_int_1 | 14 | (?●═════ 2/20 EMA ═════●)Length |
| v_input_bool_1 | false | (?●═════ MISC ═════●)Trade reverse |
| v_input_int_2 | true | (?●═════ Time Start ═════●)From Day |
| v_input_int_3 | true | From Month |
| v_input_int_4 | 2005 | From Year |
Source (PineScript)
/*backtest
start: 2023-11-05 00:00:00
end: 2023-12-05 00:00:00
period: 2h
basePeriod: 15m
exchanges: [{"eid":"Futures_Binance","currency":"BTC_USDT"}]
*/

//@version=5
////////////////////////////////////////////////////////////
//  Copyright by HPotter v1.0 04/04/2022
// This is combo strategies for get a cumulative signal.
//
// First strategy
// This indicator plots 2/20 exponential moving average. For the Mov
// Avg X 2/20 Indicator, the EMA bar will be painted when the Alert criteria is met.
//
// Second strategy
// The Average Directional Movement Index Rating (ADXR) measures the strength
// of the Average Directional Movement Index (ADX). It's calculated by taking
// the average of the current ADX and the ADX from one time period before
// (time periods can vary, but the most typical period used is 14 days).
// Like the ADX, the ADXR ranges from values of 0 to 100 and reflects strengthening
// and weakening trends. However, because it represents an average of ADX, values
// don't fluctuate as dramatically and some analysts believe the indicator helps
// better display trends in volatile markets.
//
//
// WARNING:
// - For purpose educate only
// - This script to change bars colors.
////////////////////////////////////////////////////////////
EMA20(Length) =>
    pos = 0.0
    xPrice = close
    xXA = ta.ema(xPrice, Length)
    nHH = math.max(high, high[1])
    nLL = math.min(low, low[1])
    nXS = nLL > xXA or nHH < xXA ? nLL : nHH
    iff_1 = nXS < close[1] ? 1 : nz(pos[1], 0)
    pos := nXS > close[1] ? -1 : iff_1
    pos

fADX(Len) =>
    up = ta.change(high)
    down = -ta.change(low)
    trur = ta.rma(ta.tr, Len)
    plus = fixnan(100 * ta.rma(up > down and up > 0 ? up : 0, Len) / trur)
    minus = fixnan(100 * ta.rma(down > up and down > 0 ? down : 0, Len) / trur)
    sum = plus + minus
    100 * ta.rma(math.abs(plus - minus) / (sum == 0 ? 1 : sum), Len)

ADXR(LengthADX,LengthADXR,Signal1,Signal2) =>
    pos = 0.0
    xADX = fADX(LengthADX)
    xADXR = (xADX + xADX[LengthADXR]) / 2
    pos := xADXR < Signal1 ? 1 : xADXR > Signal2 ? -1 : nz(pos[1], 0)
    pos

strategy(title='Combo 2/20 EMA & ADXR', shorttitle='Combo', overlay=true)
var I1 = '●═════ 2/20 EMA ═════●'
Length = input.int(14, minval=1, group=I1)
var I2 = '●═════ ADXR  ═════●'
LengthADX = input(title="Length ADX", defval=14)
LengthADXR = input(title="Length ADXR", defval=14)
Signal1 = input.float(13, step=0.01)
Signal2 = input.float(45, step=0.01)
var misc = '●═════ MISC ═════●'
reverse = input.bool(false, title='Trade reverse', group=misc)
var timePeriodHeader = '●═════ Time Start ═════●'
d = input.int(1, title='From Day', minval=1, maxval=31, group=timePeriodHeader)
m = input.int(1, title='From Month', minval=1, maxval=12, group=timePeriodHeader)
y = input.int(2005, title='From Year', minval=0, group=timePeriodHeader)
StartTrade = time > timestamp(y, m, d, 00, 00) ? true : false
posEMA20 = EMA20(Length)
prePosADXR = ADXR(LengthADX,LengthADXR,Signal1,Signal2)
iff_1 = posEMA20 == -1 and prePosADXR == -1 and StartTrade ? -1 : 0
pos = posEMA20 == 1 and prePosADXR == 1 and StartTrade ? 1 : iff_1
iff_2 = reverse and pos == -1 ? 1 : pos
possig = reverse and pos == 1 ? -1 : iff_2
if possig == 1
    strategy.entry('Long', strategy.long)
if possig == -1
    strategy.entry('Short', strategy.short)
if possig == 0
    strategy.close_all()
barcolor(possig == -1 ? #b50404 : possig == 1 ? #079605 : #0536b3)
Detail
https://www.fmz.com/strategy/434458
Last Modified
2023-12-06 15:48:29