
13 KiB
Name
双均线突破策略Dual-Moving-Average-Breakthrough-Strategy
Author
ChaoZhang
Strategy Description
[trans]
概述
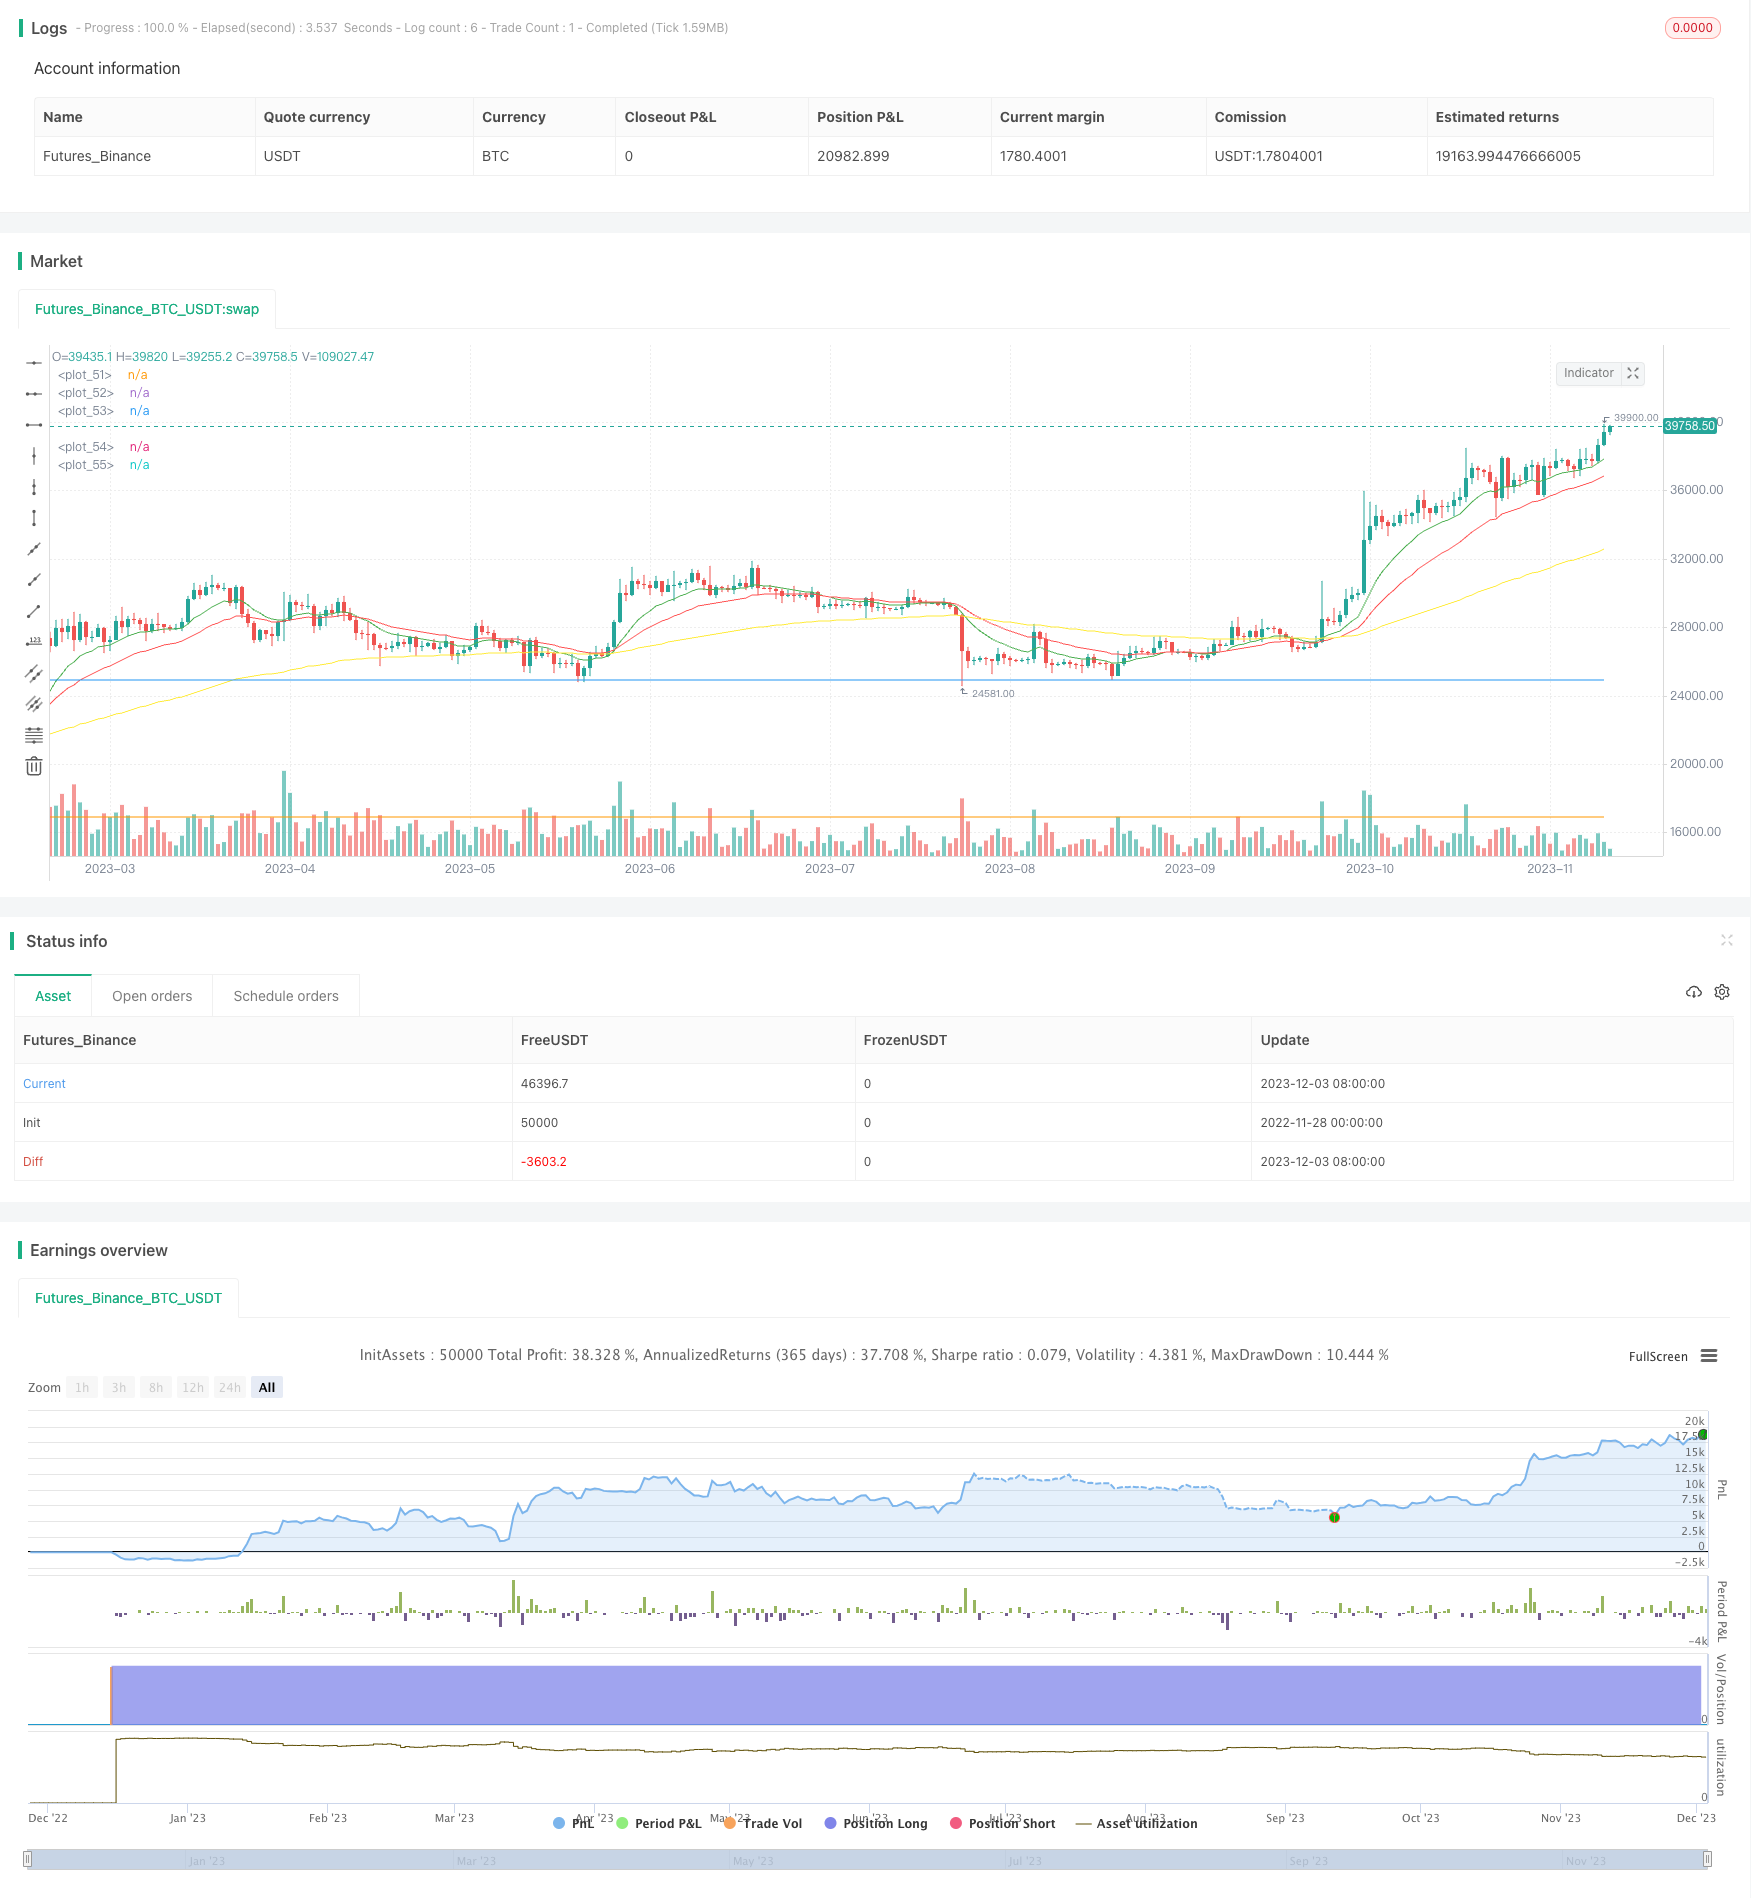
双均线突破策略通过计算快线EMA和慢线EMA,并设定买入信号为快线上穿慢线时做多,卖出信号为快线下穿慢线时平仓。该策略同时结合了MACD指标作为辅助判断指标。当MACD柱线上穿0轴时产生买入信号,可与均线策略匹配,进一步验证信号。另外,策略还监控单日涨幅是否达到一定比例,如果单日涨幅超过设定阈值,也会产生买入信号。
在退出机制上,策略设置了止损位和止盈位。止损位固定在入场价的一定比例下方,用于控制下跌风险;止盈位则固定在入场价的一定比例上方,用于锁定利润。
综上,该策略结合了多种指标,进出场规则明确,既考虑趋势跟踪,也关注短线操作机会,优化后可以应用于高波动股票的择时交易。
策略原理
双均线突破策略的核心指标是快线EMA和慢线EMA。EMA代表指数移动平均线,是一种趋势跟踪指标。快线EMA参数一般设置短期,用来捕捉短期趋势;慢线EMA参数一般设置长期,用来判断长期趋势方向。当快线上穿慢线时,代表短期趋势变强,可以做多;当快线下穿慢线时,代表短期趋势转弱,应该平仓。
该策略的快线EMA周期默认为12天,慢线EMA周期默认为26天。这组参数比较典型,匹配时间段也较为合适。股票每日收盘价作为计算EMA的价格输入。
另外,策略还引入MACD作为辅助判断指标。MACD指标的定义是快线EMA(默认12天)减去慢线EMA(默认26天),再对MACD进行平滑处理得到信号线。当MACD上穿0轴代表短期获利超过长期获利,是买入信号。该信号与均线策略匹配,可以达到验证的效果,提高信号的可靠性。
最后,监控股票的单日涨幅是否高于一个预设阈值(默认8%),如果单日涨幅超过这个数值,也会产生买入信号。因为对于高波动股票而言,大幅单日放量涨停板是常见的行情特征,这时也是一个捕捉短线机会的信号。
在退出上,策略预设了止损位和止盈位。止损位固定在入场价的一定比例下方(默认5%),用于控制损失;止盈位固定在入场价的一定比例上方(默认40%),用于锁定利润。
优势分析
双均线突破策略具有以下优势:
-
结合趋势跟踪和短线操作,灵活度高。双均线本身适合判断中长期趋势,叠加MACD指标和放量突破判断,可以兼顾短线交易机会。
-
买卖信号比较可靠,容易判断。快线EMA上穿慢线EMA形成标准的金叉信号,判断简单直观。结合MACD指标可以达到验证效果,提高信号质量。
-
运用止盈止损原则,风险可控。预设止损位可以快速割掉亏损部分,避免大面积损失;设置止盈位也可以锁定部分利润。
-
规则参数可调,适应性强。快线EMA周期、慢线EMA周期、单日涨幅阈值等参数都可以自由设置,可以针对不同股票进行优化,提高适应性。
风险分析
双均线突破策略也存在以下风险:
-
单一指标组合可能产生虚假信号。双均线和MACD都可能出现头假信号的情况,跟踪效果不佳。可以考虑引入更多不同类型指标进行匹配验证。
-
未考虑大级别止损。如遇到重大黑天鹅事件,未设置足够大的总体止损阈值,可能造成巨额损失。这需要人工干预进行风险控制。
-
快线EMA和慢线EMA参数设置不当可能失效。如果参数设置不匹配,也会出现多次震荡造成虚假信号。需要针对股票特点进行参数测试和优化。
-
买卖点选择时点不精确。策略并没有选择最佳买卖点位,这需要引入更复杂判断规则或机器学习等手段进行优化。
优化方向
双均线突破策略可以从以下维度进行优化:
-
增加验证指标,提高信号质量。可以测试引入KDJ、BOLL等其他指标,组成多指标验证体系,减少假信号。
-
增加机器学习模型判断,找出最优买卖点。可以收集大量历史数据,构建模型判断最佳买卖时机,降低Timing Risk。
-
优化EMA周期参数,测试不同参数对策略效果的影响。可以网格搜索不同参数,找到最佳参数组合,提高策略稳定性。
-
增加自适应止损机制。可以根据market regime设计动态跟踪止损位。遇到特殊行情止损幅度适当放宽,提高策略胜率。
-
优化止盈位。可以研究出最佳止盈比率,比如设置动态止盈位,在行情向好时适当追涨等。
总结
双均线突破策略整体框架完整,指标选择和 Parameter 设置合理,是一套适合高波动股票交易的趋势跟踪短线策略。但策略仍有优化空间,建议从增加判断指标、机器学习辅助、参数优化等方面进行深化,可以进一步提升策略效果。
||
Overview
The dual moving average breakthrough strategy generates buy signals when the fast EMA crosses above the slow EMA, and closes out positions when the fast EMA crosses below the slow EMA. The strategy also incorporates the MACD indicator as an auxiliary judgment indicator. When the MACD histogram crosses above the 0-line, a buy signal is generated, which can match the moving average strategy to further verify the signal. In addition, the strategy also monitors whether the single-day increase reaches a certain percentage threshold. If the single-day increase exceeds the set threshold, a buy signal will also be generated.
In terms of exits, the strategy sets a stop loss level and take profit level. The stop loss is fixed at a certain percentage below the entry price to control the downside risk; the take profit is fixed at a certain percentage above the entry price to lock in profits.
In summary, the strategy combines multiple indicators with clear entry and exit rules, taking into account both trend following and short-term trading opportunities. It can be applied to market timing trading of highly volatile stocks after optimization.
Strategy Logic
The core indicators of the dual moving average breakthrough strategy are the fast EMA and the slow EMA. The EMA represents the exponential moving average, which is a trend-following indicator. The fast EMA usually has a shorter parameter to capture short-term trends, while the slow EMA usually has a longer parameter to determine the long-term trend direction. When the fast EMA crosses above the slow EMA, it indicates the strengthening of the short-term trend and suggests going long. When the fast EMA crosses below the slow EMA, it indicates the weakening of the short-term trend and suggests closing positions.
The default parameters for this strategy are 12 days for the fast EMA and 26 days for the slow EMA. This set of parameters is typical and the matching time frame is appropriate. The closing price of the stock is used as the price input to calculate the EMAs.
In addition, the strategy introduces the MACD indicator as an auxiliary judgment tool. The definition of the MACD indicator is the fast EMA (default 12 days) minus the slow EMA (default 26 days), followed by signal line smoothing of the MACD. When MACD crosses above the 0-line, it represents that short-term gains exceed long-term gains and gives a buy signal. This signal matches the moving average strategy and can play a role of verification and improve the reliability of trading signals.
Finally, the strategy monitors whether the single-day increase of the stock exceeds a preset threshold (default 8%). For highly volatile stocks, large single-day limit-ups are common market characteristics. Crossing this threshold also gives a signal to capture short-term trading opportunities.
For exits, the strategy presets a stop loss level and a take profit level. The stop loss is fixed at a certain percentage (default 5%) below the entry price to control losses. The take profit is fixed at a certain percentage (default 40%) above the entry price to lock in profits.
Advantage Analysis
The dual moving average crossover strategy has the following advantages:
-
Flexible combination of trend following and short-term trading. The dual moving average itself is suitable for determining medium- and long-term trends. Adding MACD indicators and volume breakout judgments can take into account short-term trading opportunities.
-
Reliable trading signals that are easy to judge. The fast EMA crossing above the slow EMA forms a standard golden cross signal that is simple and intuitive to determine. Incorporating the MACD indicator can play a role of verification and improve signal quality.
-
Controllable risks through stop loss and take profit principles. Presetting a stop loss level can quickly cut losses and avoid huge drawdowns. Setting a take profit level also allows locking in partial profits.
-
Adjustable parameters for strong adaptability. Parameters like fast EMA period, slow EMA period, and single-day increase threshold can be freely set. The strategy can be optimized for different stocks to improve adaptability.
Risk Analysis
The dual moving average crossover strategy also has the following risks:
-
Single indicator combinations may generate false signals. Both dual moving averages and MACD may have false signals and poor tracking effects. More types of indicators should be introduced for matching verification.
-
No consideration of major stop loss levels. In the event of black swan events, lack of a sufficiently large overall stop loss threshold may result in huge losses. This requires manual intervention for risk control.
-
Inappropriate EMA period settings may invalidate the strategy. If the parameters are not set properly, there will be multiple oscillations resulting in false signals. Parameters need to be tested and optimized according to stock characteristics.
-
Imprecise timing in selecting entry and exit points. The strategy does not select the best entry and exit spots. More complex rules or machine learning techniques are required for optimization.
Optimization Directions
The dual moving average crossover strategy can be optimized in the following aspects:
-
Increase verification indicators to improve signal quality. Other indicators like KDJ and BOLL can be tested to form a multi-indicator verification system to reduce false signals.
-
Increase machine learning models to identify optimal entry and exit points, collecting large amounts of historical data to build models that determine the best trading timing, lowering timing risks.
-
Optimize EMA period parameters and test impacts on the strategy. Different parameter combinations can be grid searched to find the optimal set and improve stability.
-
Add adaptive stop loss mechanisms based on market regime. Dynamically track the stop loss level. Relax stop loss range appropriately during special market conditions to improve win rate.
-
Optimize take profit levels by researching the optimal profit ratio, such as setting up dynamic take profit targets, appropriately setting trailing stops during bull markets etc.
Conclusion
The dual moving average crossover strategy has a complete framework, reasonable indicator selections and parameter settings. It is a suitable trend following short-term trading strategy for highly volatile stocks. But there is room for optimization, including increasing judgment indicators, adding machine learning, and parameters optimization to further improve strategy performance.
[/trans]
Strategy Arguments
| Argument | Default | Description |
|---|---|---|
| v_input_1 | 12 | fastLength |
| v_input_2 | 26 | slowLength |
| v_input_3 | 100 | baseLength |
| v_input_4 | 9 | MACDLength |
| v_input_5 | 12 | MACDfast |
| v_input_6 | 26 | MACDslow |
| v_input_7 | 8 | Gain % |
| v_input_8 | 5 | Stop Loss % |
| v_input_9 | 40 | Profit % |
Source (PineScript)
/*backtest
start: 2022-11-28 00:00:00
end: 2023-12-04 00:00:00
period: 1d
basePeriod: 1h
exchanges: [{"eid":"Futures_Binance","currency":"BTC_USDT"}]
*/

//@version=3
strategy("Volatile Stocks", overlay=true)

//Trading Strategy for Highly Volitile Stocks//
// by @ShanghaiCrypto //

////EMA////
fastLength = input(12)
slowLength = input(26)
baseLength = input(100)
price = close

emafast = ema(price, fastLength)
emaslow = ema(price, slowLength)
emabase = ema(price, baseLength)

///MACD////
MACDLength = input(9)
MACDfast = input(12)
MACDslow = input(26)
MACD = ema(close, MACDfast) - ema(close, MACDslow)
aMACD = ema(MACD, MACDLength)
delta = MACD - aMACD

////PUMP////
OneCandleIncrease = input(8, title='Gain %')
pump = OneCandleIncrease/100

////Profit Capture and Stop Loss//////
stop = input(5.0, title='Stop Loss %', type=float)/100
profit = input(40.0, title='Profit %', type=float)/100
stop_level = strategy.position_avg_price * (1 - stop)
take_level = strategy.position_avg_price * (1 + profit)

////Entries/////
if crossover(emafast, emaslow)
    strategy.entry("Cross", strategy.long, comment="BUY")

if (crossover(delta, 0))
    strategy.entry("MACD", strategy.long, comment="BUY")

if close > (open + open*pump)
    strategy.entry("Pump", strategy.long, comment="BUY")

/////Exits/////
strategy.exit("SELL","Cross", stop=stop_level, limit=take_level)
strategy.exit("SELL","MACD", stop=stop_level, limit=take_level)
strategy.exit("SELL","Pump", stop=stop_level, limit=take_level)

////Plots////
plot(emafast, color=green)
plot(emaslow, color=red)
plot(emabase, color=yellow)
plot(take_level, color=blue)
plot(stop_level, color=orange)
Detail
https://www.fmz.com/strategy/434293
Last Modified
2023-12-05 10:46:05