
10 KiB
Name
双向MA追踪止损策略Dual-Moving-Average-Tracking-Stop-Loss-Strategy
Author
ChaoZhang
Strategy Description
 [trans]
概述
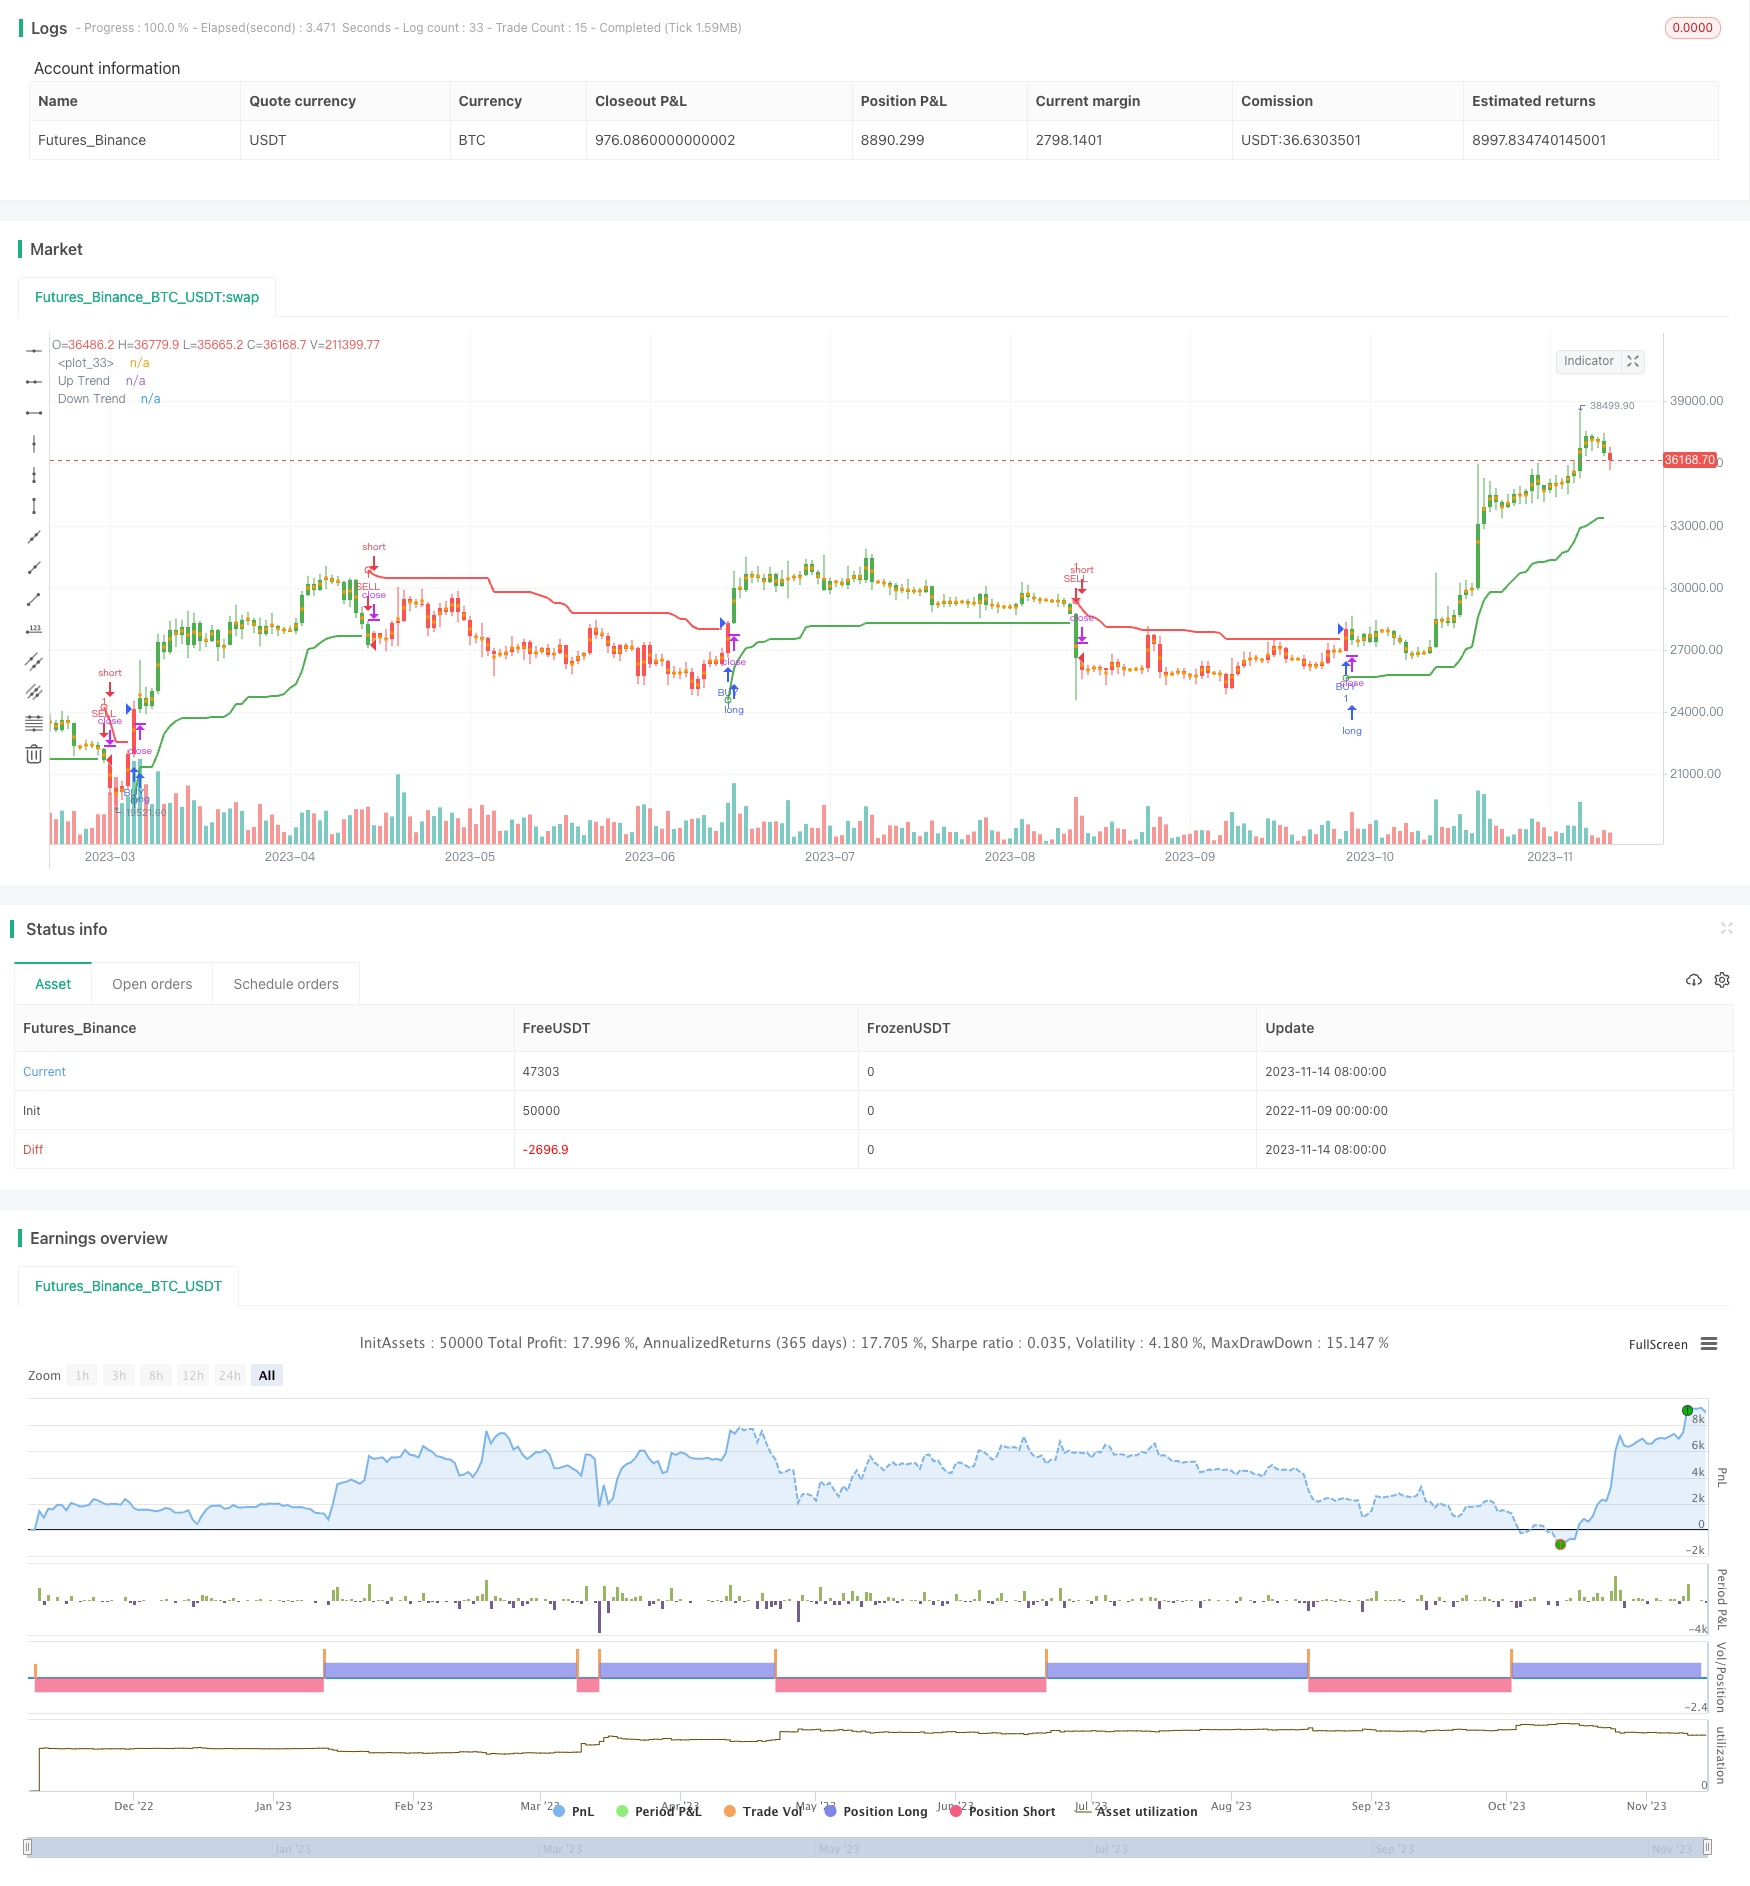
本策略通过双向移动平均线构建多空信号,实现追踪止损,其核心思想是使用移动平均线判断趋势方向,在趋势方向做多做空,并使用ATR计算止损位,实现追踪止损。
策略原理
本策略使用hl2作为源价格,计算一定周期的ATR作为止损幅度。根据ATR值乘以特定倍数计算上轨和下轨。当价格上穿上轨时产生买入信号做多,当价格下穿下轨时产生卖出信号做空。
在开仓后,根据ATR的实时变化调整止损位,实现止损追踪。具体来说,当做多之后,下轨根据最新低点不断上调,实现止损追踪;当做空之后,上轨根据最新高点不断下调,实现止损追踪。
这样,本策略充分利用了移动平均线判断趋势方向的功能,又增加了基于ATR的止损追踪机制,既保证了交易方向的正确性,也控制了交易风险。
策略优势
本策略最大的优势在于风险控制。传统的移动平均线策略只考虑方向判断,很容易爆仓。而本策略加入ATR计算的追踪止损,可以根据市场波动幅度动态调整止损位,有效控制交易风险。
此外,本策略融合多空双向交易。相比单边策略,能够在趋势转折时及时调整仓位方向,避免被困在同一方向,提高策略收益。
策略风险
本策略主要风险在于ATR周期和倍数的设置。如果ATR周期过短或倍数过大,止损幅度将过小,无法有效控制风险;如果ATR周期过长或倍数过小,则止损过于宽松,难以获利。此外,价格突破移动平均线触发建仓信号时,也可能出现假突破的风险。
可以通过优化参数周期和倍数,平衡止损收益;结合其他指标过滤假突破,提高信号质量,降低风险。
优化方向
本策略可以从以下几个方面进行优化:
-
优化移动平均线周期,寻找最佳参数组合
-
增加其他指标过滤,如MACD、KDJ等,提高信号质量
-
增加仓位管理策略,如固定份额、马丁格尔等,提高策略收益
-
可以研究不同品种的参数差异,进行参数优化
-
可以结合机器学习方法如遗传算法等对参数进行训练优化
总结
本策略全面考虑了趋势判断和风险控制,在追求收益的同时注重降低回撤。通过参数优化和组合等方法,可以将策略收益进一步提升。总的来说,本策略思路明确,易于实施,是一种可靠稳定的量化交易策略。
||
Overview
This strategy generates long and short signals through dual moving averages and implements tracking stop loss. The core idea is to determine the trend direction with moving averages, go long or short along the trend, and use ATR to calculate the stop loss for tracking stop loss.
Strategy Logic
This strategy uses hl2 as the source price and calculates ATR of a certain period as the stop loss range. The upper and lower bands are calculated based on ATR multiplied by a certain factor. When the price breaks above the upper band, a buy signal is generated to go long. When the price breaks below the lower band, a sell signal is generated to go short.
After opening positions, the stop loss is adjusted in real-time based on the changes in ATR to achieve tracking stop loss. Specifically, after going long, the lower band is raised progressively based on the latest low to track the stop loss. After going short, the upper band is lowered progressively based on the latest high to track the stop loss.
In this way, this strategy makes full use of moving averages’ capability of determining trend direction, and also incorporates the tracking stop loss mechanism based on ATR to ensure trading direction and risk control.
Advantages
The biggest advantage of this strategy lies in risk control. Traditional moving average strategies only consider directional judgments and can easily blow up accounts. By incorporating ATR for tracking stop loss, this strategy can dynamically adjust stop loss based on market volatility to effectively control trading risks.
In addition, this strategy combines dual-directional trading. Compared to single-direction strategies, it can promptly adjust position directions when trends reverse, avoiding being trapped in one direction and improving strategy profitability.
Risks
The main risks of this strategy come from the parameter settings of ATR period and multiplier. If ATR period is too short or multiplier too large, the stop loss range would be too small to effectively control risks. If ATR period is too long or multiplier too small, the stop loss would be too loose to profit. Also, there are risks of false breakouts when prices penetrating moving averages.
The risks can be managed by optimizing the ATR period and multiplier to balance between stop loss and profit targets, and incorporating other indicators to filter false breakouts and improve signal quality.
Enhancement Opportunities
This strategy can be enhanced from the following aspects:
-
Optimize moving average periods to find the best parameter combination.
-
Add other indicators like MACD, KDJ etc. to filter signals and improve quality.
-
Incorporate position sizing like fixed fraction, Martingale etc. to improve profitability.
-
Research parameters differences between various products for optimization.
-
Apply machine learning like genetic algorithms for parameter training and optimization.
Conclusion
This strategy fully considers trend judging and risk control, pursuing profits while lowering drawdowns. Further enhancement through parameter optimization and portfolio methods can help improve strategy profitability. In summary, this is a robust and stable quantitative trading strategy with clear logic and easy implementation.
[/trans]
Strategy Arguments
| Argument | Default | Description |
|---|---|---|
| v_input_1 | 10 | ATR Period |
| v_input_2_hl2 | 0 | Source: hl2 |
| v_input_3 | 3 | ATR Multiplier |
| v_input_4 | true | Change ATR Calculation Method ? |
| v_input_5 | false | Show Buy/Sell Signals ? |
| v_input_6 | true | Highlighter On/Off ? |
| v_input_7 | true | Bar Coloring On/Off ? |
| v_input_8 | 9 | From Month |
| v_input_9 | true | From Day |
| v_input_10 | 2018 | From Year |
| v_input_11 | true | To Month |
| v_input_12 | true | To Day |
| v_input_13 | 9999 | To Year |
Source (PineScript)
/*backtest
start: 2022-11-09 00:00:00
end: 2023-11-15 00:00:00
period: 1d
basePeriod: 1h
exchanges: [{"eid":"Futures_Binance","currency":"BTC_USDT"}]
*/

// This source code is subject to the terms of the Mozilla Public License 2.0 at https://mozilla.org/MPL/2.0/
// © KivancOzbilgic


//@version=4
strategy("Trenbolone Strategy", overlay = true)
Periods = input(title="ATR Period", type=input.integer, defval=10)
src = input(hl2, title="Source")
Multiplier = input(title="ATR Multiplier", type=input.float, step=0.1, defval=3.0)
changeATR= input(title="Change ATR Calculation Method ?", type=input.bool, defval=true)
showsignals = input(title="Show Buy/Sell Signals ?", type=input.bool, defval=false)
highlighting = input(title="Highlighter On/Off ?", type=input.bool, defval=true)
barcoloring = input(title="Bar Coloring On/Off ?", type=input.bool, defval=true)
atr2 = sma(tr, Periods)
atr= changeATR ? atr(Periods) : atr2
up=src-(Multiplier*atr)
up1 = nz(up[1],up)
up := close[1] > up1 ? max(up,up1) : up
dn=src+(Multiplier*atr)
dn1 = nz(dn[1], dn)
dn := close[1] < dn1 ? min(dn, dn1) : dn
trend = 1
trend := nz(trend[1], trend)
trend := trend == -1 and close > dn1 ? 1 : trend == 1 and close < up1 ? -1 : trend
upPlot = plot(trend == 1 ? up : na, title="Up Trend", style=plot.style_linebr, linewidth=2, color=color.green)
buySignal = trend == 1 and trend[1] == -1
plotshape(buySignal ? up : na, title="UpTrend Begins", location=location.absolute, style=shape.circle, size=size.tiny, color=color.green, transp=0)
plotshape(buySignal and showsignals ? up : na, title="Buy", text="Buy", location=location.absolute, style=shape.labelup, size=size.tiny, color=color.green, textcolor=color.white, transp=0)
dnPlot = plot(trend == 1 ? na : dn, title="Down Trend", style=plot.style_linebr, linewidth=2, color=color.red)
sellSignal = trend == -1 and trend[1] == 1
plotshape(sellSignal ? dn : na, title="DownTrend Begins", location=location.absolute, style=shape.circle, size=size.tiny, color=color.red, transp=0)
plotshape(sellSignal and showsignals ? dn : na, title="Sell", text="Sell", location=location.absolute, style=shape.labeldown, size=size.tiny, color=color.red, textcolor=color.white, transp=0)
mPlot = plot(ohlc4, title="", style=plot.style_circles, linewidth=0)
longFillColor = highlighting ? (trend == 1 ? color.green : color.white) : color.white
shortFillColor = highlighting ? (trend == -1 ? color.red : color.white) : color.white
fill(mPlot, upPlot, title="UpTrend Highligter", color=longFillColor)
fill(mPlot, dnPlot, title="DownTrend Highligter", color=shortFillColor)
FromMonth = input(defval = 9, title = "From Month", minval = 1, maxval = 12)
FromDay   = input(defval = 1, title = "From Day", minval = 1, maxval = 31)
FromYear  = input(defval = 2018, title = "From Year", minval = 999)
ToMonth   = input(defval = 1, title = "To Month", minval = 1, maxval = 12)
ToDay     = input(defval = 1, title = "To Day", minval = 1, maxval = 31)
ToYear    = input(defval = 9999, title = "To Year", minval = 999)
start     = timestamp(FromYear, FromMonth, FromDay, 00, 00)
finish    = timestamp(ToYear, ToMonth, ToDay, 23, 59)
window()  => time >= start and time <= finish ? true : false
longCondition = buySignal
if (longCondition)
    strategy.entry("BUY", strategy.long, when = window())
shortCondition = sellSignal
if (shortCondition)
    strategy.entry("SELL", strategy.short, when = window())
buy1 = barssince(buySignal)
sell1 = barssince(sellSignal)
color1 = buy1[1] < sell1[1] ? color.green : buy1[1] > sell1[1] ? color.red : na
barcolor(barcoloring ? color1 : na)
Detail
https://www.fmz.com/strategy/432355
Last Modified
2023-11-16 17:18:59