
12 KiB
Name
动量趋势追踪策略Momentum-Trend-Tracking-Strategy
Author
ChaoZhang
Strategy Description
 [trans]
概述
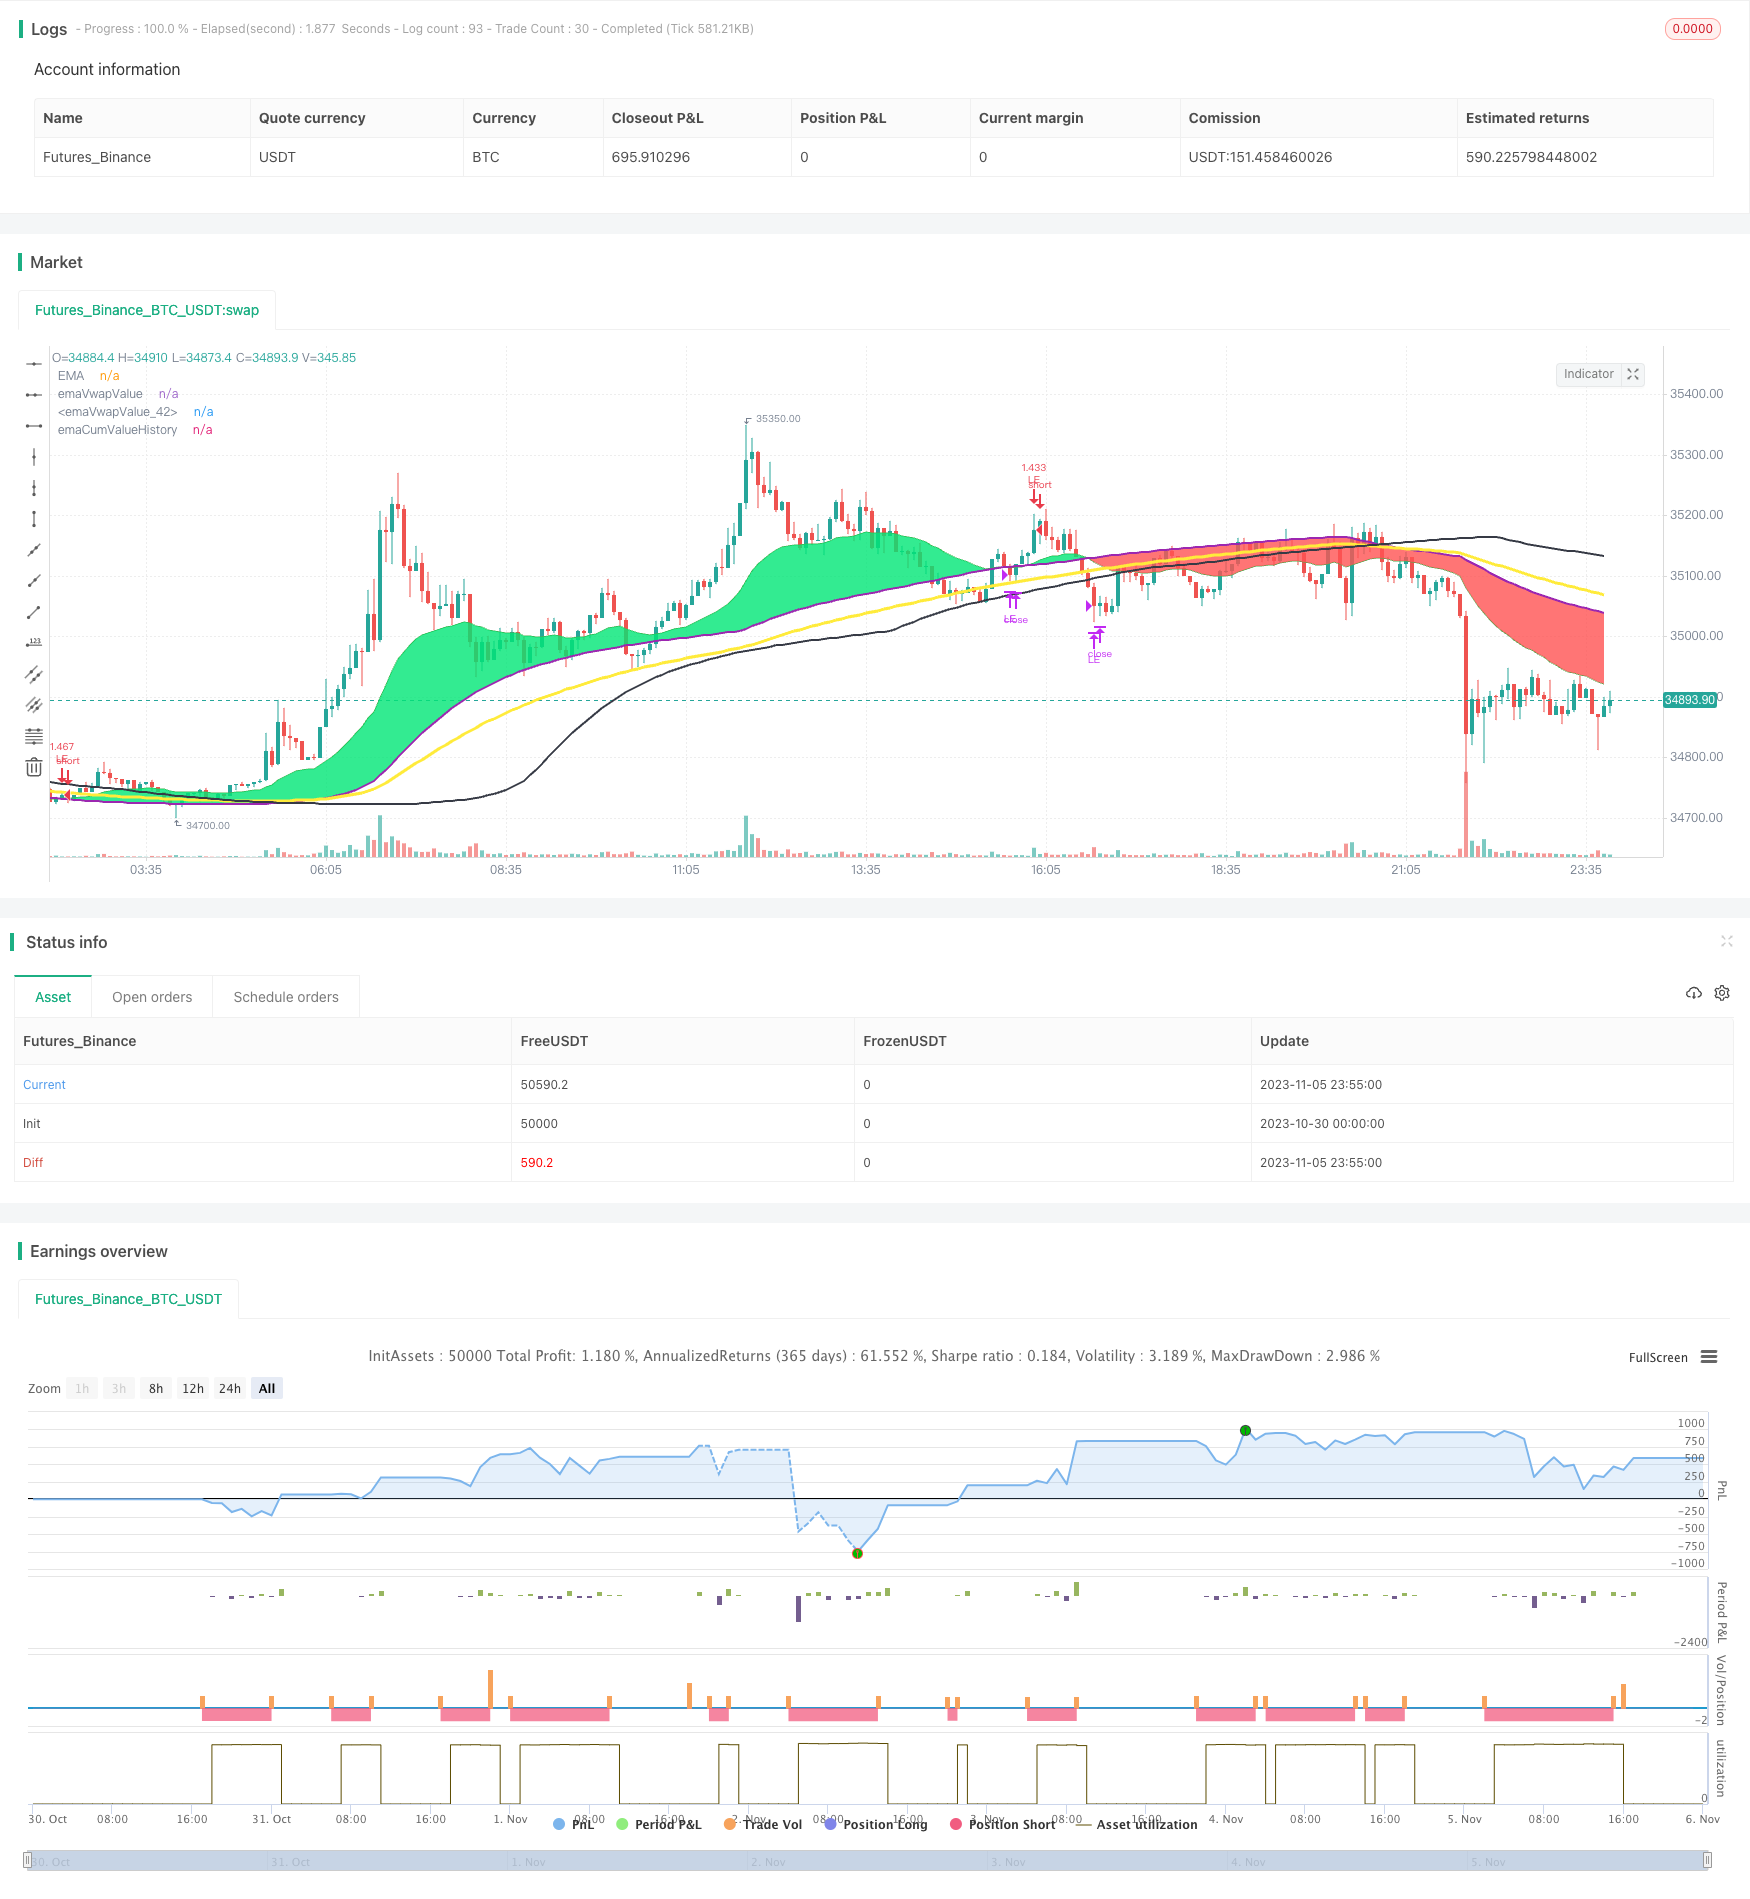
该策略基于移动平均线和成交量的趋势分析,设定动量指标,并以追踪趋势的方式进行买卖操作。
策略原理
- 计算close价格的EMA均线和成交量的累积EMA均线
- 当close上穿EMA时判断为上升趋势,作多头操作
- 当继续上升时,close上穿累积EMA的2倍均线时,追加多仓
- 设置RSI指标,当RSI超过90时平掉1/3头寸获利了结
- 当close下穿EMA时判断为下降趋势,平掉全部多头仓位
- 当close下穿EMA时判断为下降趋势,做空操作
- 设置止损线,止损线为进入价格的固定百分比
- 空头获利方式与多头相同
优势分析
该策略主要优势有:
- 使用EMA均线判断趋势,可以有效跟踪趋势
- 采用成交量的累积EMA来判断真实的趋势变化
- 追踪动量指标RSI来获利了结
- 风险控制到位,有止损线
- 可以适应不同行情,灵活调整参数
风险分析
该策略主要风险有:
- EMA均线生成滞后,可能错过转折点
- 成交量不一定能反映真实趋势
- 固定百分比止损可能过于机械化
- PARAMETERS太多,调参难度大
- 交易频繁,交易费用成本较高
风险解决思路:
- 优化EMA参数,降低滞后性
- 结合其他指标确认成交量信号
- 根据市场情况优化止损点
- 简化参数,仅保留主要设置
- 适当放宽止损线和交易频率
优化方向
该策略可以从以下几个方面进行优化:
- 测试不同EMA参数设置,找到最优参数组合
- 增加 VOLUME 倍数作为入场信号强弱判定
- 结合MACD,KD等其他指标确认入场
- 根据特定股票特点优化止损百分比
- 优化交易频率,降低交易费用
总结
该策略整体来说是一个基于均线系统的趋势追踪策略。核心思路是使用EMA判定趋势方向,并配合VOLUME动量指标来确认入场。可以通过参数优化不断优化,并辅助其他指标进一步确认。总体来说是一个灵活的趋势追踪策略,在熟练运用后可以获得不错的回报。
||
Overview
This strategy is based on trend analysis of moving averages and volume, sets momentum indicators, and makes buy and sell operations by tracking trends.
Strategy Principles
- Calculate the EMA of close price and the cumulative EMA of volume
- When close crosses above EMA, it is judged as an upward trend and long position is taken
- When continues going up, close crosses above 2 times of cumulative EMA, add to long position
- Set RSI indicator, when RSI exceeds 90, close 1/3 position for profit taking
- When close crosses below EMA, it is judged as downward trend, close all long positions
- When close crosses below EMA, it is judged as downward trend, take short position
- Set stop loss line at fixed percentage of entry price
- Profit taking of short position is the same as long position
Advantage Analysis
The main advantages of this strategy are:
- Using EMA to judge trends can effectively track trends
- Using cumulative EMA of volume to judge true trend changes
- Tracking momentum indicator RSI for profit taking
- Good risk control with stop loss
- Can adapt to different market conditions, parameters can be adjusted flexibly
Risk Analysis
The main risks of this strategy are:
- EMA has lagging, may miss turning points
- Volume may not always reflect real trend
- Fixed percentage stop loss may be too mechanistic
- Too many parameters make parameter tuning difficult
- High trading frequency leads to high trading costs
Risk Solutions:
- Optimize EMA parameters to reduce lagging
- Combine with other indicators to confirm volume signals
- Optimize stop loss points based on market conditions
- Simplify parameters, keep main settings only
- Relax stop loss and trading frequency appropriately
Optimization Directions
This strategy can be optimized in the following aspects:
- Test different EMA parameter settings to find optimal combination
- Add volume multiples as signal strength judgment for entry
- Combine with MACD, KD and other indicators to confirm entry
- Optimize stop loss percentage according to characteristics of specific stocks
- Optimize trading frequency to reduce trading costs
Summary
In summary, this is a trend tracking strategy based on moving average system. The core idea is to use EMA to determine trend direction, and confirm entry with VOLUME momentum indicator. It can be continuously optimized through parameter tuning, and assisted by other indicators for further confirmation. Overall it is a flexible trend tracking strategy, which can yield good returns after proficient use.
[/trans]
Strategy Arguments
| Argument | Default | Description |
|---|---|---|
| v_input_1 | 25 | EMA Length |
| v_input_2 | 100 | cumulative volume Period |
| v_input_3 | 10 | Risk % of capital |
| v_input_4 | 8 | Stop Loss |
| v_input_5 | true | take partial profits (percentage same as stop loss) |
| v_input_6 | 0 | Trade Direction: LONG |
Source (PineScript)
/*backtest
start: 2023-10-30 00:00:00
end: 2023-11-06 00:00:00
period: 5m
basePeriod: 1m
exchanges: [{"eid":"Futures_Binance","currency":"BTC_USDT"}]
*/

// This source code is subject to the terms of the Mozilla Public License 2.0 at https://mozilla.org/MPL/2.0/
// © mohanee

//@version=4
strategy("EMA_cumulativeVolume_crossover[Strategy]", overlay=true, pyramiding=5, default_qty_type=strategy.percent_of_equity,  default_qty_value=20, initial_capital=10000)


emaLength= input(25, title="EMA Length", minval=1, maxval=200)
cumulativePeriod = input(100,  title="cumulative volume Period", minval=1, maxval=200)


riskCapital = input(title="Risk % of capital", defval=10, minval=1)
stopLoss=input(8,title="Stop Loss",minval=1)
takePartialProfits=input(true, title="take partial profits  (percentage same as stop loss)")

tradeDirection=input(title="Trade Direction", defval="LONG", options=["LONG", "SHORT"])

avgPrice = (high + low + close) / 3
avgPriceVolume = avgPrice * volume

cumulPriceVolume = sum(avgPriceVolume, cumulativePeriod)
cumulVolume = sum(volume, cumulativePeriod)

cumValue = cumulPriceVolume / cumulVolume

emaVal=ema(close, emaLength)

emaCumValue1=ema(cumValue, emaLength)
emaCumValue2=ema(cumValue, emaLength*2)

emaCumValueHistory=ema(cumValue[emaLength], emaLength)


//vwapVal1=vwap(hlc3)

rsiVal=rsi(close,5)

plotEma=plot(emaVal, title="EMA", color=color.green,  transp=25)
//plot(vwapValue, title="Cumulate Volumne", color=color.orange,  linewidth=2, transp=25)
//plot(vwapVal1, title="vwapVal1", color=color.purple,  linewidth=1, transp=25)
plotCum=plot(emaCumValue1, title="emaVwapValue", color=color.purple,  linewidth=2, transp=35)
plot(emaCumValue2, title="emaVwapValue", color=color.yellow,  linewidth=3, transp=25)
fill(plotEma,plotCum, color=emaVal>emaCumValue1 ? color.lime : color.red, transp=35, title="ema and cum area")

plot(emaCumValueHistory, title="emaCumValueHistory", color=color.black,  linewidth=2, transp=25)


//bgcolor(emaVal>vwapValue?color.blue:color.purple)

//Entry--
//Echeck how many units can be purchased based on risk manage ment and stop loss
qty1 = (strategy.equity  * riskCapital / 100 ) /  (close*stopLoss/100)

//check if cash is sufficient  to buy qty1  , if capital not available use the available capital only
qty1:= (qty1 * close >= strategy.equity ) ? (strategy.equity / close) : qty1

//strategy.entry(id="LE",comment="LE", long=true, qty=qty1, when=crossover(emaVal, vwapValue)  and (tradeDirection=="LONG") )    //emaVal>vwapValue and crossover(close , emaVal)

strategy.entry(id="LE",comment="LE", long=true, qty=qty1, when=strategy.position_size==0 and crossover(emaVal, emaCumValue1)  and (tradeDirection=="LONG") )    //emaVal>vwapValue and crossover(close , emaVal)

//re-entry
rentryCondition1=strategy.position_size>1 and emaVal > emaCumValue1 and emaCumValue1>emaCumValue2 and crossover(close, emaCumValue2) and close>open and  (tradeDirection=="LONG")
strategy.entry(id="LE",comment="LE RE", long=true, qty=qty1, when=rentryCondition1 )

rentryCondition2=strategy.position_size>1 and emaVal > emaCumValue1 and emaCumValue1>emaCumValueHistory and crossover(close, emaCumValueHistory) and close>open and  (tradeDirection=="LONG")
//strategy.entry(id="LE",comment="LE RE", long=true, qty=qty1, when=rentryCondition2 )


//stoploss
stopLossVal=  strategy.position_size>=1 ?  (strategy.position_avg_price * (1-(stopLoss*0.01) )) : 0.00

//draw initil stop loss
//plot(strategy.position_size>=1 ? stopLossVal : na, color = color.purple , style=plot.style_linebr,  linewidth = 2, title = "stop loss")

//partial exits
takeProfit=  strategy.position_size>=1 ?  (strategy.position_avg_price * (1+(1*0.01) )) : ( close[1] * 2 )
//if(takePartialProfits==true)
    //strategy.close(id="LE", comment="Partial"+tostring(close-strategy.position_avg_price, "###.##") , qty=strategy.position_size/3 , when = (tradeDirection=="LONG" ) and close>takeProfit and crossunder(close, emaVal) )    //close<close[1] and close[1]<close[2] and close[2]<close[3])

strategy.close(id="LE", comment="PExit Points=>"+tostring(close-strategy.position_avg_price, "###.##") , qty=strategy.position_size/3 , when = (tradeDirection=="LONG" ) and  takePartialProfits == true and close>=takeProfit and crossunder(rsiVal,90) )

profitVal=    strategy.position_size>=1 ?  (strategy.position_avg_price * (1+(1*0.01) )) : ( close[1] * 2 )

//strategy.close(id="LE" , comment="LE Exit Points="+tostring(close-strategy.position_avg_price, "###.##"), when=crossunder(emaVal, vwapValue) and (tradeDirection=="LONG") )

strategy.close(id="LE" , comment="Exit Points=>"+tostring(close-strategy.position_avg_price, "###.##"), when=  crossunder(emaVal, emaCumValue1) and (tradeDirection=="LONG") )


strategy.close(id="LE" , comment="SL Exit Loss="+tostring(close-strategy.position_avg_price, "###.##"), when= close < stopLossVal   and (tradeDirection=="LONG") )


//for short  you dont have to wait crossodown of ema, falling is speed , so just check if close crossing down vwapVal
strategy.entry(id="SE",comment="SE", long=false, qty=qty1, when=crossunder(emaVal, emaCumValue1) and (tradeDirection=="SHORT") )    //emaVal>vwapValue and crossover(close , emaVal)


//stoploss
stopLossValUpside=  abs(strategy.position_size)>=1 and tradeDirection=="SHORT" ?  (strategy.position_avg_price * (1+(stopLoss*0.01) )) : 0.00

//draw initil stop loss
//plot(abs(strategy.position_size)>=1 and tradeDirection=="SHORT" ? stopLossValUpside : na, color = color.purple , style=plot.style_linebr,  linewidth = 2, title = "stop loss")

//partial exits
shortTakeProfit=  abs(strategy.position_size)>=1 and tradeDirection=="SHORT" ?  (strategy.position_avg_price * (1-(stopLoss*0.01) )) : 0.00
if(takePartialProfits==true)
    strategy.close(id="SE", comment="Partial" , qty=strategy.position_size/3 , when = (tradeDirection=="SHORT"   ) and  crossover(rsiVal,15) )  //close<takeProfit and (emaVal - close)>8 )

//strategy.close(id="SE" , comment="SE Exit Points="+tostring(close-strategy.position_avg_price, "###.##"), when=crossover(emaVal, vwapValue) and (tradeDirection=="SHORT") )
//strategy.close(id="SE" , comment="SE Exit Points="+tostring(close-strategy.position_avg_price, "###.##"), when= abs(strategy.position_size)>=1 and ( (emaVal<emaCumValue1 and close>emaCumValue1 and open>emaCumValue1 and close>open )   or (crossover(emaVal,emaCumValue1))  ) and (tradeDirection=="SHORT") )

//strategy.close(id="SE" , comment="SL Exit Loss="+tostring(close-strategy.position_avg_price, "###.##"), when= abs(strategy.position_size)>=1 and  close > stopLossValUpside   and (tradeDirection=="SHORT"   ) )
strategy.close(id="SE" , comment="SL Exit Loss="+tostring(close-strategy.position_avg_price, "###.##"), when= abs(strategy.position_size)>=1 and  crossover(emaVal, emaCumValue1)   and (tradeDirection=="SHORT"   ) )
Detail
https://www.fmz.com/strategy/431417
Last Modified
2023-11-07 16:49:49