
9.6 KiB
Name
动量突破策略Momentum-Breakout-Strategy
Author
ChaoZhang
Strategy Description
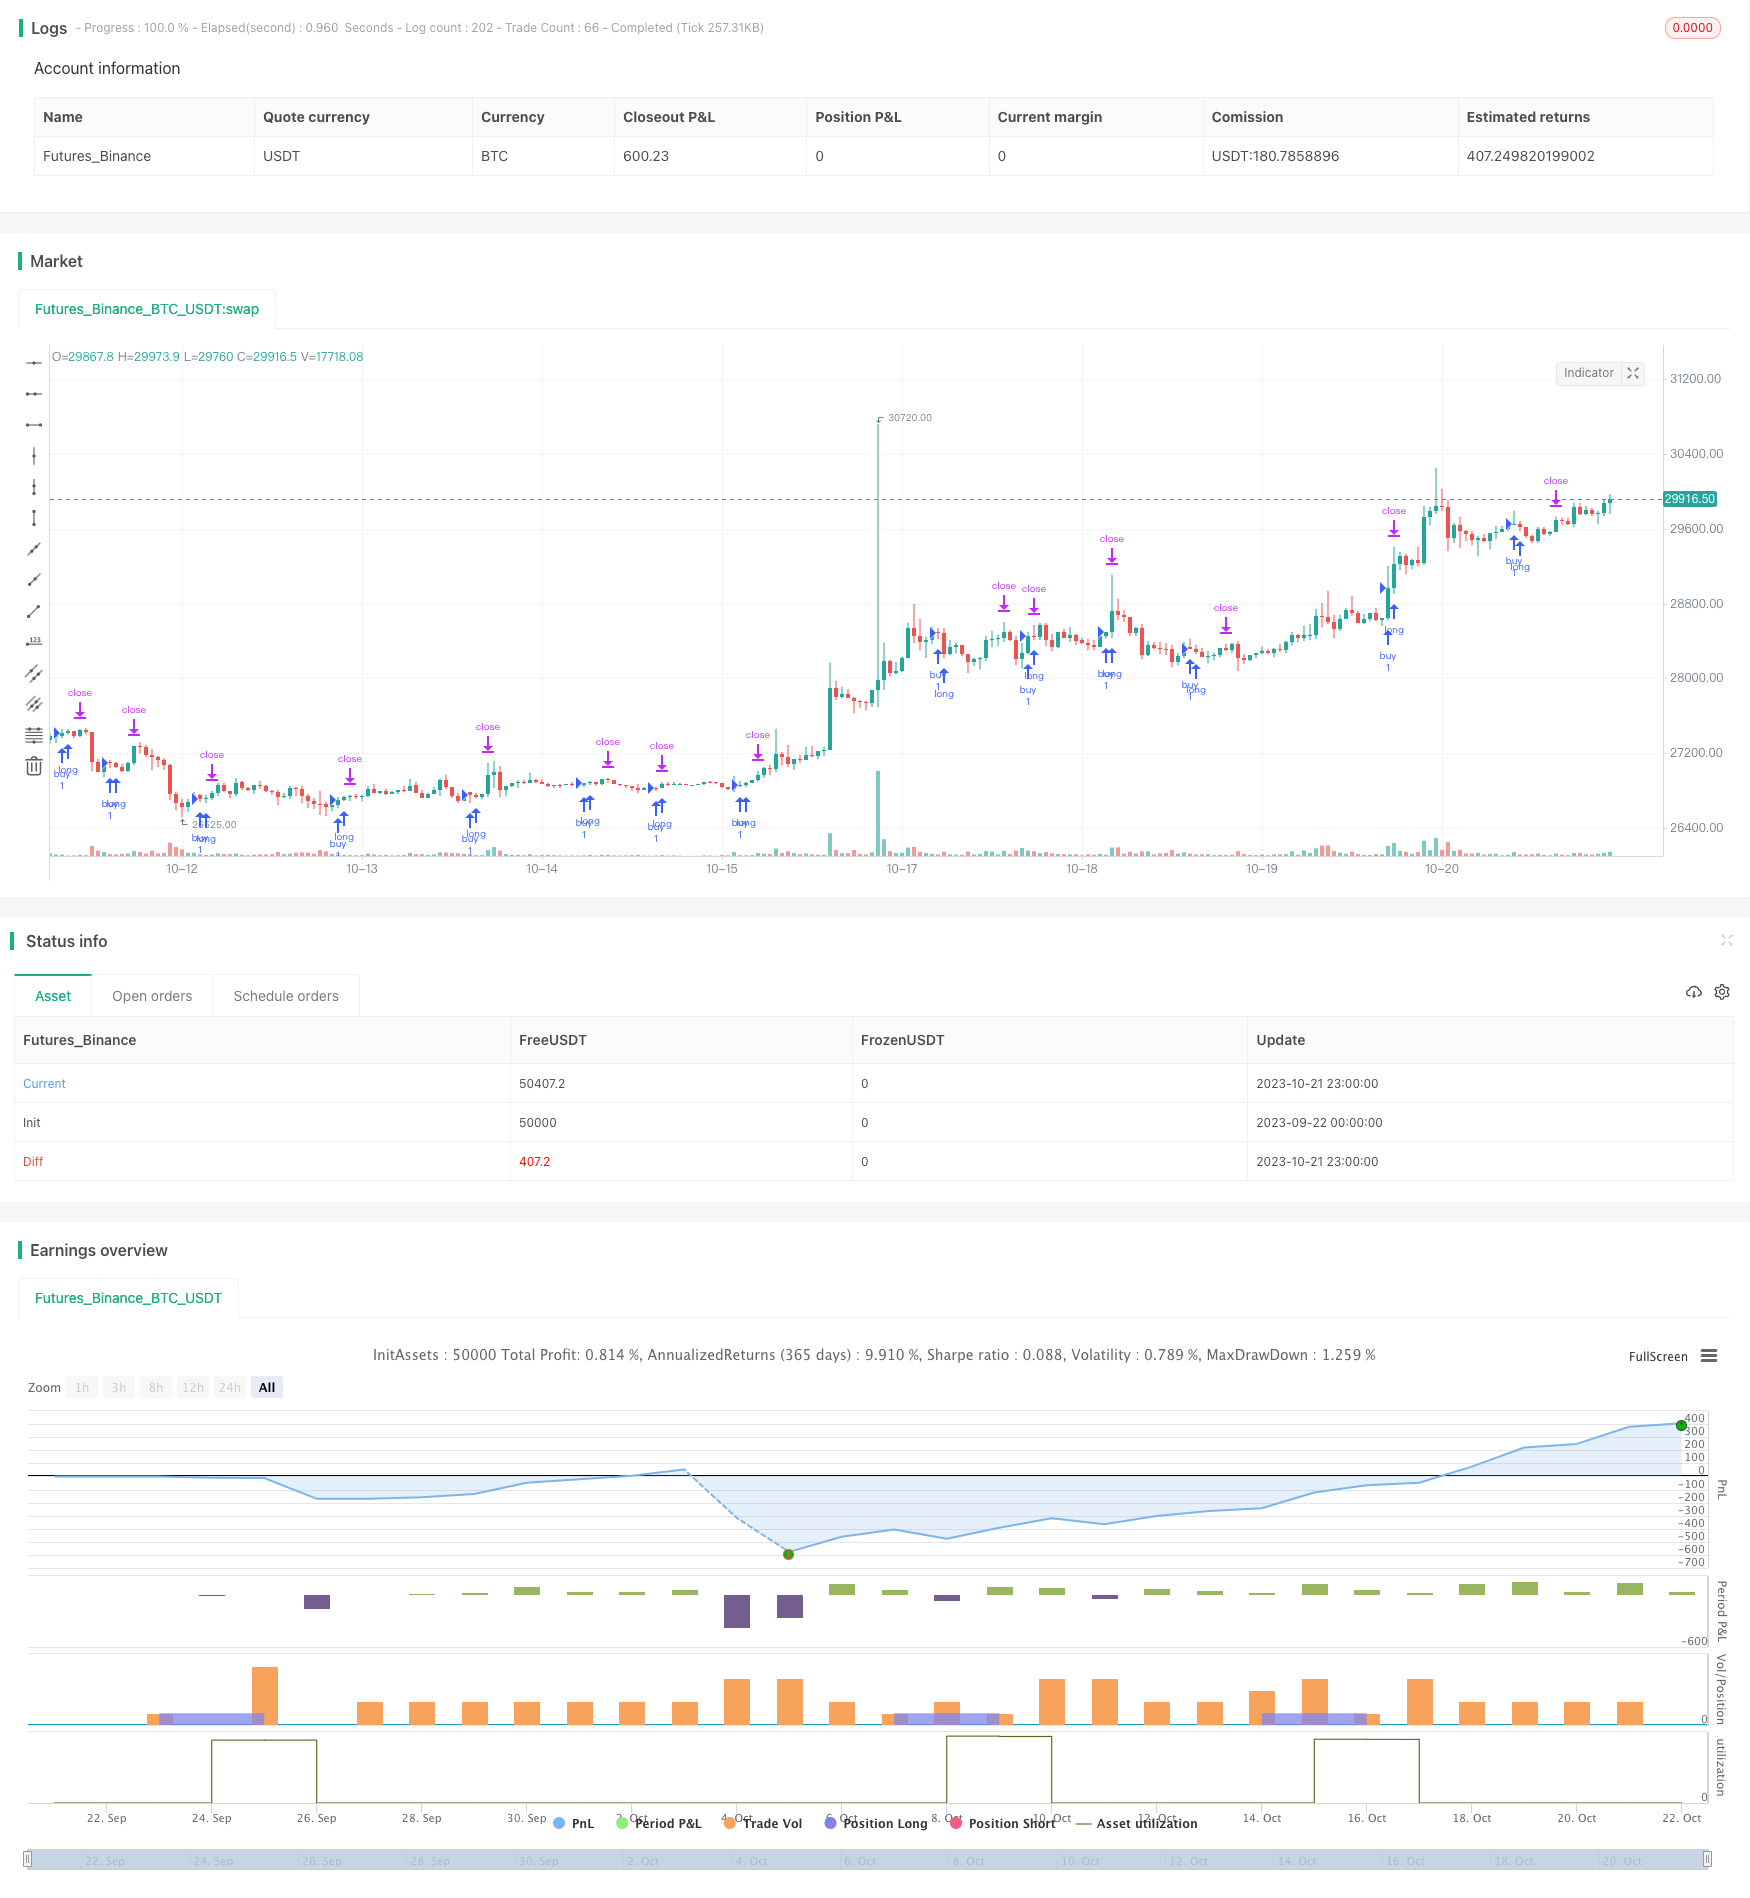
[trans]
概述
该策略是一个基于随机震荡指标K线和D线的动量突破交易策略。它利用K线从超卖区域回落进入超买区作为买入信号,以追踪止损方式止损。
策略原理
该策略主要由以下几部分组成:
-
指标设置
使用RSI指标的14周期Smoothed Stoch指标的K线和D线,分别对其做3周期的SMA平滑处理。
-
信号生成
当K线上穿20作为买入信号时,进行买入开仓。
-
止损方式
采用追踪止损方式,设置固定跟踪止损距离。同时设置回测期内20周期内最低点作为止损位。
-
仓位计算
根据回测期内20周期内最低点和当前收盘价计算出止损点之间的点数距离。再根据可承受的美元止损金额和点数距离计算出每个点的值。最后根据点值计算出具体的仓位大小。
这样,该策略利用超买区反转的动量突破作为入场信号,采用精确计算的仓位管理和追踪止损,实现了动量反转交易,有效控制了风险。
策略优势
该策略具有以下几点优势:
-
入场信号明确,突破超卖区域,动量较强。
-
采用追踪止损,可以根据行情走势灵活止损。
-
根据精确计算的仓位入场,有效控制了单笔损失。
-
回测周期内计算止损位,实现精准止损。
-
仓位计算方式简单清晰,易于操作。
-
策略逻辑简单清晰,容易理解实现。
-
代码结构清晰,易于阅读和二次开发。
策略风险
该策略也存在一些风险:
-
股票本身波动风险。如遇剧烈行情,止损可能触发较多。
-
可能存在过量交易的风险。
-
单边持仓,无法利用反方向行情。
-
无法有效过滤行情背景。如在震荡行情中,可能出现止损频繁被触发。
可以通过以下方式优化管理风险:
-
优化参数,调整入场条件,避免过于频繁交易。
-
采用期限分散,分批建仓的方式,降低单边风险。
-
增加对大级别行情背景的判断,避免在不利行情高频交易。
-
优化止损策略,防止止损过于敏感。
策略优化
该策略可以从以下几个方向进行优化:
-
优化止损策略,可以考虑动态追踪止损、分批止损、移动止损等方式,使止损更加平滑。
-
增加对大级别趋势的判断,避免交易震荡趋势。可以结合均线、通道突破等方式判断趋势。
-
可以考虑双向持仓,加入反向头寸,利用反弹行情获利。
-
可以通过机器学习等方式对参数自动优化,使参数更好地适应不同阶段行情。
-
优化仓位管理策略,可以考虑固定比例、固定资金等 OTHER方式,使资金利用更加合理。
-
增加更多过滤条件,在更优质机会下进行交易。如结合成交量,布林线等指标进行优化。
总结
该策略整体是一个较为简单清晰的动量突破策略。它采取了较为谨慎的止损方式,有效控制了单笔损失。但仍需针对具体市场行情进行优化调整,使策略参数更好地适应市场,过滤无效交易信号,在回报与风险之间取得更好平衡。同时增强对大级别趋势的判断和仓位管理也是该策略需要优化的方向。整体来说,该策略作为一个基础的动量突破策略还是较为实用的,值得进一步研究优化,以适应具体交易品种的行情特点。
||
Overview
This is a momentum breakout trading strategy based on K and D lines of Smoothed Stochastic Oscillator indicator. It uses crossover of K line into oversold area as buy signal and trailing stop as stop loss.
Strategy Logic
The strategy consists of following parts:
-
Indicator Settings
Using 14-period RSI to generate K and D lines of Smoothed Stochastic Oscillator indicator, with 3-period SMA applied on K and D lines.
-
Signal Generation
When K line crosses over 20 level, a buy signal is generated for long entry.
-
Stop Loss
Trailing stop loss is used with fixed trailing stop distance. Also the lowest low in past 20 periods is used as stop loss price.
-
Position Sizing
The number of points between stop loss price and current close is calculated using past 20-period lowest low. Then position size is calculated based on dollar amount at risk per trade and value per point.
This way, the strategy identifies momentum breakout on oversold reversal as entry signal, and adopts accurate position sizing and trailing stop loss to trade momentum reversal, with effective risk control.
Advantages
The strategy has following advantages:
-
Clear entry signal on breakout of overbought zone with strong momentum.
-
Flexible trailing stop moves with market swings.
-
Precise position sizing controls single trade risk.
-
Accurate stop loss based on historical low.
-
Simple and clear position sizing logic.
-
Simple and clear strategy logic, easy to understand.
-
Clean code structure, easy to read and modify.
Risks
There are some risks to the strategy:
-
Underlying price fluctuations. Frequent stop loss triggers during volatile market.
-
Potential over trading.
-
One directional holding, unable to profit from reverse price move.
-
Ineffective market condition filtering. Frequent stop loss triggers during ranging market.
Below optimisations can help manage the risks:
-
Optimize parameters to avoid over trading.
-
Use staged entries to lower one directional risk.
-
Add analysis of larger time frame trend to avoid trading in unfavourable market conditions.
-
Optimise stop loss strategy to prevent excessive sensitivity.
Optimization
Below aspects of the strategy can be optimized:
-
Optimise stop loss to use dynamic trailing stop, staged stop loss, moving average etc to make it more smooth.
-
Add analysis of larger time frame trend to avoid trading in sideways markets. Can incorporate trend analysis with moving averages, channel breakouts etc.
-
Consider two directional holdings to profit from pullbacks.
-
Use machine learning for auto parameter optimization to find optimal parameters for changing market conditions.
-
Optimize position sizing by using fixed percentage, fixed capital etc to improve capital utilization.
-
Add more filters with indicators like volume, Bollinger Bands to improve quality of trading signals.
Summary
Overall this is a simple and clear momentum breakout strategy. It adopts a prudent stop loss approach to effectively control single trade risk. But optimizations are still needed to adapt the strategy better to specific market conditions, filter ineffective signals, and achieve a better balance between return and risk. Enhancing analysis of larger time frame trends and position sizing are important optimization directions for this strategy. In summary, as a basic momentum breakout strategy, it is still practical and worth researching further to adapt it to the market conditions of specific trading instruments.
[/trans]
Strategy Arguments
| Argument | Default | Description |
|---|---|---|
| v_input_1 | 3 | smoothK |
| v_input_2 | 3 | smoothD |
| v_input_3 | 14 | lengthRSI |
| v_input_4 | 14 | lengthStoch |
| v_input_5_close | 0 | RSI Source: close |
| v_input_6 | 80 | overbought |
| v_input_7 | 20 | oversold |
| v_input_8 | 1500 | stop |
| v_input_9 | 20 | stop_dentro_de_los_ultimos_lows |
| v_input_10 | 500 | trail_points |
| v_input_11 | 100 | trail_offset |
| v_input_12 | 1000 | profit |
| v_input_13 | 15 | riesgo_en_dolares |
Source (PineScript)
//@version=2
//descripcion:
//entrada en saturacion oscilador estocastico
//salida por trailing
strategy("MomentumBreak#1", overlay=true,calc_on_every_tick=true,
     default_qty_type=strategy.fixed,currency="USD")
//entradas y variables de indicadores
smoothK = input(3, minval=1)
smoothD = input(3, minval=1)
lengthRSI = input(14, minval=1)
lengthStoch = input(14, minval=1)
src = input(close, title="RSI Source")
rsi1 = rsi(src, lengthRSI)
k = sma(stoch(rsi1, rsi1, rsi1, lengthStoch), smoothK)
d = sma(k, smoothD)
overbought=input(80)
oversold=input(20)
//entradas de stop , trail, profit
stop=input(1500)
stop_dentro_de_los_ultimos_lows=input(20)
trail_points=input(500)
trail_offset=input(100)
profit=input(1000)
riesgo_en_dolares=input(15)

//condicion de compra: k>80
buycondition=crossover(k,oversold)
//entrada a la posicion
posicionabierta=0
if year>2015
    if buycondition
        stoplow=lowest(stop_dentro_de_los_ultimos_lows)
        riesgo_en_pips = (close - stoplow)
        valor_del_pip = (riesgo_en_dolares / riesgo_en_pips)
        tamanio_de_la_posicion= ( valor_del_pip)              //la posicion la esta calculando bien
        strategy.entry("buy",strategy.long)
        strategy.exit("salida","buy",trail_points=trail_points,trail_offset=trail_offset,stop=stoplow,comment=tostring(stoplow))

//////////////////////////////////condicion de stop por drodown 10% equity
//strategy.risk.max_drawdown(15,strategy.cash)
// condicion de stop por perdida mayor a $15 en op abierta
//strategy.risk.max_intraday_loss(15,strategy.cash)
//formas de tomar stop:
// cuando llega a una media movil: strategy.close o strategyentry o strategy.exit o strategy.order
// determinado por un numero de pips strategy.exit
// determinado por el calculo de la posicion:
//tomar el minimo minimo de los ultimos 20 periodos, guardarlo como nivel de stop
//calcular la posicion en base a ese stop:
//prcio de entrada - precio de stop = pips_en-reisgo
//riesgo_e_dolares / pips_en_riesgo = pip_value
//position_size=10000 * pip_value
Detail
https://www.fmz.com/strategy/429950
Last Modified
2023-10-23 15:17:45