
12 KiB
Name
动量熔断MACD策略Momentum-Breakdown-MACD-Strategy
Author
ChaoZhang
Strategy Description
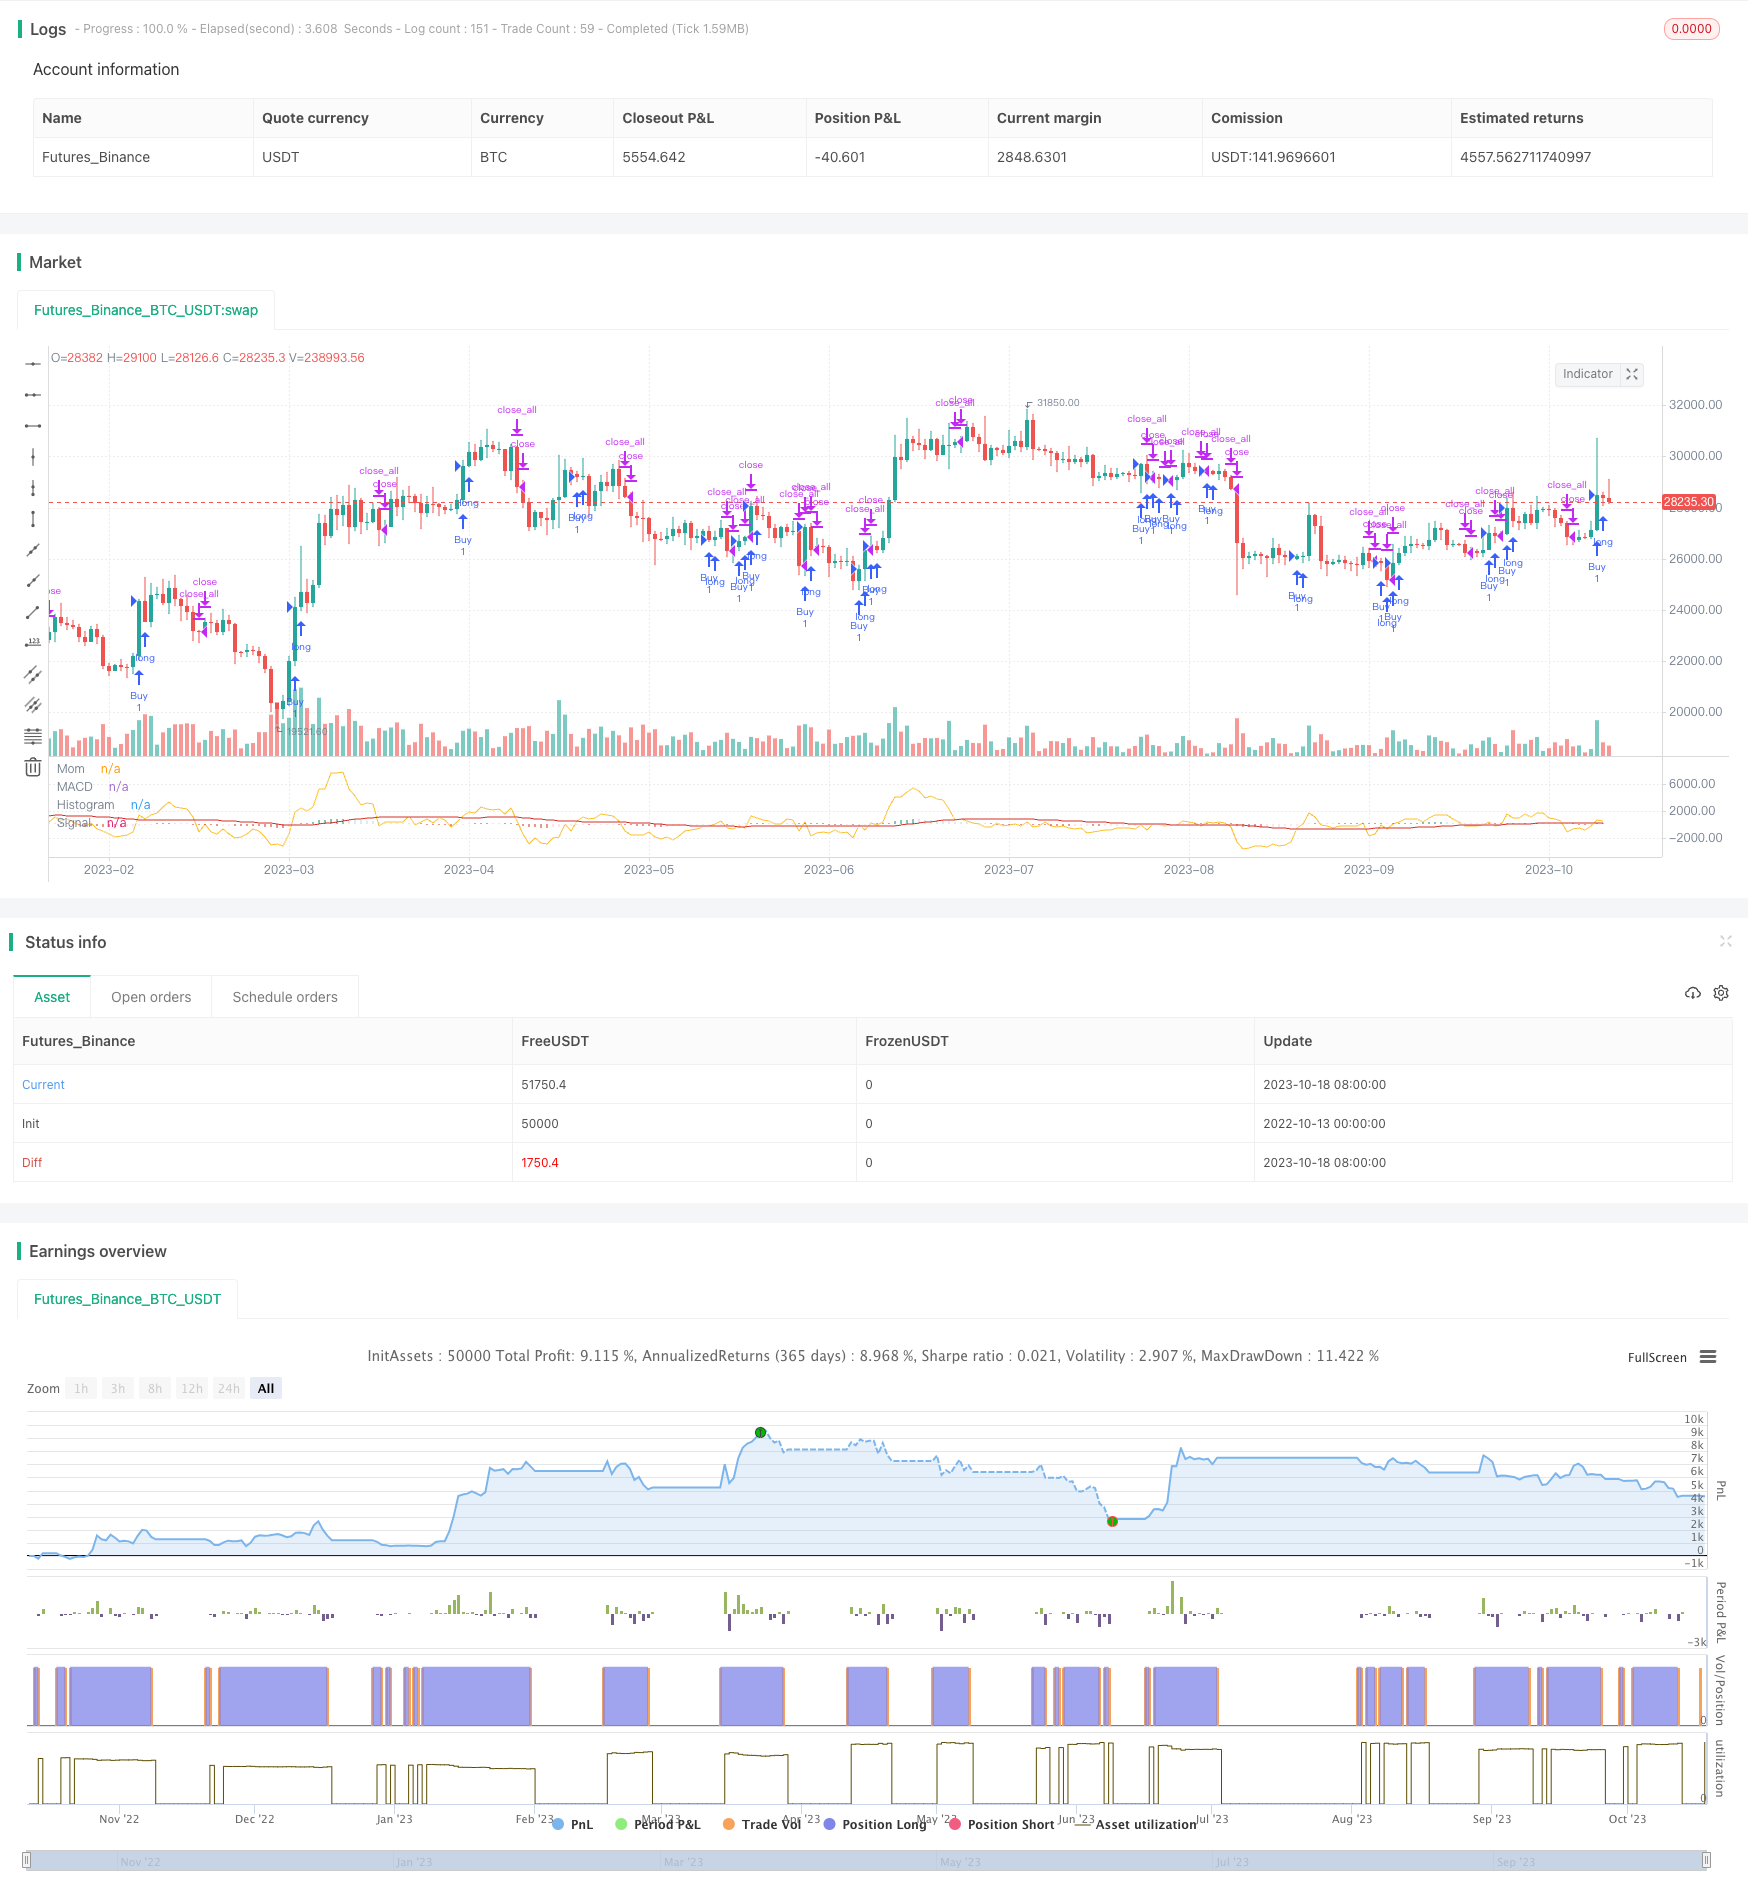
[trans]
概述
动量熔断MACD策略主要是利用MACD指标和动量指标的组合,形成交易信号,属于趋势跟踪策略。该策略首先计算快线EMA和慢线EMA,然后计算MACD值,再计算MACD的信号线。同时计算价格的动量值。当动量值和MACD差值形成零轴上方交叉时产生买入信号;当动量值和MACD差值形成零轴下方交叉时产生卖出信号,属于双重确认形成交易信号的策略。
策略原理
该策略主要基于MACD和动量指标的组合使用。
MACD指标是一种趋势跟踪型指标,由快线EMA、慢线EMA和MACD柱状图组成。快线EMA参数通常为12日,慢线EMA参数为26日,计算公式为:
快线EMA = EMA(收盘价,12)
慢线EMA = EMA(收盘价,26)
MACD = 快线EMA - 慢线EMA
信号线 = EMA(MACD,9)
当快线上穿慢线时,说明短期上升势头强于长期,为入场信号;当快线下穿慢线时,说明长期下跌势头强于短期,为出场信号。
动量指标是反映股票价格变动速度的技术指标,计算公式为:
动量值 = 今日收盘价 - N日前收盘价
其中N一般取10。当今日收盘价上涨超过N日前时,动量值为正,股票处于上涨趋势;当今日收盘价下跌低于N日前时,动量值为负,股票处于下跌趋势。
该策略将MACD指标与动量指标组合使用,形成交易信号的判定标准是:当MACD差值和动量差值的差值上穿零轴时产生买入信号,形成零轴上方交叉;当MACD差值和动量差值的差值下穿零轴时产生卖出信号,形成零轴下方交叉。这属于一种双重确认的交易信号生成机制,可以过滤掉一些假信号,实现趋势跟踪。
策略优势分析
该策略具有以下优势:
-
MACD指标与动量指标的组合,实现了趋势跟踪,避免了资产价格仅有震荡缺乏方向性的时候无效交易的发生。
-
基于双重确认机制生成交易信号,可以过滤掉一些噪音,避免假信号的干扰。
-
MACD指标参数可调,可以根据不同品种和交易周期进行参数优化,适应性强。
-
采用了买入和卖出双向交易机制,可以实现趋势的双向捕捉。
-
策略理解简单,参数较少,适合初学者学习。
策略风险分析
该策略也存在一些风险:
-
MACD和动量指标都属于趋势跟踪型指标,当市场出现剧烈波动或者没有明显趋势时,可能会产生较多无效交易。
-
双重指标组合虽然可以过滤假信号,但也可能错过交易机会,应适当调整参数以平衡风险。
-
大周期趋势出现反转时,MACD指标会有滞后,从而导致交易亏损。
-
交易频率可能较高,需要注意资金管理和手续费控制。
-
参数不当可能导致过于灵敏或者过于滞后,需要根据市场情况不断测试优化。
策略优化方向
该策略可以从以下方面进行优化:
-
优化MACD指标的参数,根据不同交易品种和周期找到最优参数组合。
-
优化动量指标的天数参数,平衡灵敏度与过滤噪音。
-
增加止损機制,以控制单笔交易的最大亏损。
-
增加仓位管理模块,让交易规模能够跟随趋势的走势。
-
增加陡峭度指标等过滤器,避免曲折行情下的错误交易。
-
结合其它指标,如布林带、RSI等形成多重确认的交易信号。
-
添加优化循环,使参数能够不断迭代和优化。
总结
动量熔断MACD策略运用MACD指标和动量指标的 Strengths 实现了趋势跟踪交易。其双重确认机制能够有效滤掉市场噪音,避免无效交易的发生。该策略较为简单直接,易于理解使用,特别适合初学者学习。但也需要注意MACD指标的滞后性,以及在震荡盘整阶段的无效交易风险。通过不断优化指标参数和增加辅助技术指标可形成更强健的策略系统。
||
Overview
The Momentum Breakdown MACD strategy mainly utilizes the combination of the MACD indicator and the Momentum indicator to generate trading signals, belonging to a trend-following strategy. This strategy first calculates the fast EMA and slow EMA, then computes the MACD value, and further calculates the signal line of MACD. At the same time, it calculates the momentum value of price. When the momentum value crosses above the zero level together with the MACD difference, it generates a buy signal. When the momentum value crosses below the zero level together with the MACD difference, it generates a sell signal. This belongs to a double confirmation mechanism to produce trading signals.
Strategy Logic
This strategy is mainly based on the combination of MACD and Momentum indicators.
The MACD indicator is a trend-following indicator, consisting of the fast EMA, slow EMA, and MACD histogram. The fast EMA usually has a parameter of 12 days, and the slow EMA has a parameter of 26 days. The calculation formulas are:
Fast EMA = EMA(close price, 12)
Slow EMA = EMA(close price, 26)
MACD = Fast EMA - Slow EMA
Signal Line = EMA(MACD, 9)
When the fast EMA crosses above the slow EMA, it means the short-term uptrend is stronger than the long-term trend, which is a buy signal. When the fast EMA crosses below the slow EMA, it means the long-term downtrend is stronger than the short-term trend, which is a sell signal.
The Momentum indicator reflects the speed of price movement, and its calculation formula is:
Momentum = Today's closing price - Closing price N days ago
Where N is usually set to 10. When today's closing price rises above that of N days ago, the momentum value is positive, indicating an uptrend. When today's closing price falls below that of N days ago, the momentum value is negative, indicating a downtrend.
This strategy combines the MACD indicator with the Momentum indicator. The criteria for generating trading signals is: when the difference between the MACD difference and the momentum difference crosses above the zero level, it generates a buy signal, forming an above-zero crossover. When the difference crosses below the zero level, it generates a sell signal, forming a below-zero crossover. This belongs to a dual confirmation mechanism for producing trading signals, which can filter out some false signals and achieve trend following.
Advantage Analysis
The advantages of this strategy include:
-
The combination of the MACD and Momentum indicators achieves trend following, avoiding ineffective trading when the asset price just oscillates without a clear direction.
-
Based on the dual confirmation mechanism, it can filter out some noise and avoid interference from false signals.
-
The MACD parameters are adjustable, which can be optimized for different products and trading cycles, making it highly adaptable.
-
It adopts both buy and sell trading mechanisms to capture trends in both directions.
-
The strategy is easy to understand with fewer parameters, suitable for beginners to learn.
Risk Analysis
This strategy also has some risks:
-
Both the MACD and Momentum belong to trend-following indicators. They may generate more inefficient trading when the market sees violent fluctuations or lacks a clear trend.
-
Although the dual indicator combination can filter out false signals, it may also miss some trading opportunities. Parameters should be adjusted to balance the risk.
-
When major cycle trends reverse, the MACD indicator may lag, leading to trading losses.
-
The trading frequency may be high, requiring attention to capital management and commission control.
-
Improper parameters may lead to too much sensitivity or lagging. Constant testing and optimization are needed based on market conditions.
Optimization Directions
The strategy can be optimized in the following aspects:
-
Optimize the MACD parameters to find the best parameter combination for different trading products and cycles.
-
Optimize the period parameter of the Momentum indicator to balance sensitivity and noise filtering.
-
Add stop loss mechanisms to control maximum loss per trade.
-
Add position management modules to scale the trade size along the trend.
-
Add filters like the ATR indicator to avoid wrong trades in choppy markets.
-
Incorporate other indicators like Bollinger Bands and RSI to form multi-confirmation trading signals.
-
Add optimization loops for continuous parameters iteration and optimization.
Summary
The Momentum Breakdown MACD strategy implements trend-following trading using the strengths of the MACD and Momentum indicators. Its dual confirmation mechanism can effectively filter out market noise and avoid inefficient trading. This strategy is relatively simple and easy to understand, especially suitable for beginners. But the lagging of the MACD and the risk of inefficient trading during range-bound markets should be noted. The strategy can be made more robust by continuously optimizing parameters and incorporating auxiliary technical indicators.
[/trans]
Strategy Arguments
| Argument | Default | Description |
|---|---|---|
| v_input_1 | 12 | Fast Length |
| v_input_2 | 26 | Slow Length |
| v_input_3 | 10 | Momentum |
| v_input_4_close | 0 | Source MACD: close |
| v_input_5_close | 0 | Source MOMENTUM: close |
| v_input_6 | 14 | Signal Smoothing |
| v_input_7 | false | Simple MA(Oscillator) |
| v_input_8 | false | Simple MA(Signal Line) |
| v_input_9 | 2001 | From Year |
| v_input_10 | true | From Month |
| v_input_11 | true | From Day |
| v_input_12 | 9999 | To Year |
| v_input_13 | 12 | To Month |
| v_input_14 | 31 | To Day |
Source (PineScript)
/*backtest
start: 2022-10-13 00:00:00
end: 2023-10-19 00:00:00
period: 1d
basePeriod: 1h
exchanges: [{"eid":"Futures_Binance","currency":"BTC_USDT"}]
*/

//@version=4
strategy(title="MACD MOMENTUM TEST", shorttitle="MACD MOM TEST")

// Getting inputs
fast_length = input(title="Fast Length", type=input.integer, defval=12)
slow_length = input(title="Slow Length", type=input.integer, defval=26)
len = input(title="Momentum", type=input.integer, defval=10)
src1 = input(title="Source MACD", type=input.source, defval=close)
src2 = input(title="Source MOMENTUM", type=input.source, defval=close)
signal_length = input(title="Signal Smoothing", type=input.integer, minval = 1, maxval = 50, defval = 14)
sma_source = input(title="Simple MA(Oscillator)", type=input.bool, defval=false)
sma_signal = input(title="Simple MA(Signal Line)", type=input.bool, defval=false)

// Plot colors
col_grow_above = #0c8e61
col_grow_below = #ffcdd2
col_fall_above = #b2dfdb
col_fall_below = #d42f28
col_macd = #ffffff
col_signal = #d42f28
col_mom = #fbc02d

// Calculating
fast_ma = sma_source ? sma(src1, fast_length) : ema(src1, fast_length)
slow_ma = sma_source ? sma(src1, slow_length) : ema(src1, slow_length)
macd = fast_ma - slow_ma
signal = sma_signal ? sma(macd, signal_length) : ema(macd, signal_length)
hist = macd - signal
mom = src2 - src2[len]


ma(s,l) => ema(s,l)
sema = ma( src1, fast_length )
lema = ma( src1, slow_length )
i1 = sema + mom + ma( src1 - sema, fast_length )
i2 = lema + mom + ma( src1 - lema, slow_length )
macdl = i1 - i2
macd1 =sema - lema

delta = mom - macd1

// Strategy
    // Backtest
FromYear  = input(defval = 2001, title = "From Year", minval = 2009)
FromMonth = input(defval = 1, title = "From Month", minval = 1, maxval = 12)
FromDay   = input(defval = 1, title = "From Day", minval = 1, maxval = 31)
ToYear    = input(defval = 9999, title = "To Year", minval = 2009)
ToMonth   = input(defval = 12, title = "To Month", minval = 1, maxval = 12)
ToDay     = input(defval = 31, title = "To Day", minval = 1, maxval = 31)

    // Function exampel
start     = timestamp(FromYear, FromMonth, FromDay, 00, 00)  // backtest start window
finish    = timestamp(ToYear, ToMonth, ToDay, 23, 59)        // backtest finish window
window()  => time >= start and time <= finish ? true : false // create function "within window of time"

if (crossover(delta, 0))
    strategy.entry("Buy", true, when=window(), comment="Buy")

if (crossunder(delta, 0))
    strategy.close_all(when=window())

// Plot
//plot(strategy.equity, title="equity", color=red, linewidth=2, style=areabr)
plot(hist, title="Histogram", style=plot.style_histogram, color=(hist>=0 ? (hist[1] < hist ? col_grow_above : col_fall_above) : (hist[1] < hist ? col_grow_below : col_fall_below) ), transp=0 )
plot(macd, title="MACD", color=col_macd, transp=0)
plot(signal, title="Signal", color=col_signal, transp=0)
plot(mom, color=col_mom, title="Mom")
Detail
https://www.fmz.com/strategy/429784
Last Modified
2023-10-20 17:12:31