
12 KiB
Name
动量均衡通道趋势追踪策略-Momentum-Equilibrium-Channel-Trend-Tracking-Strategy
Author
ChaoZhang
Strategy Description
 [trans]
概述
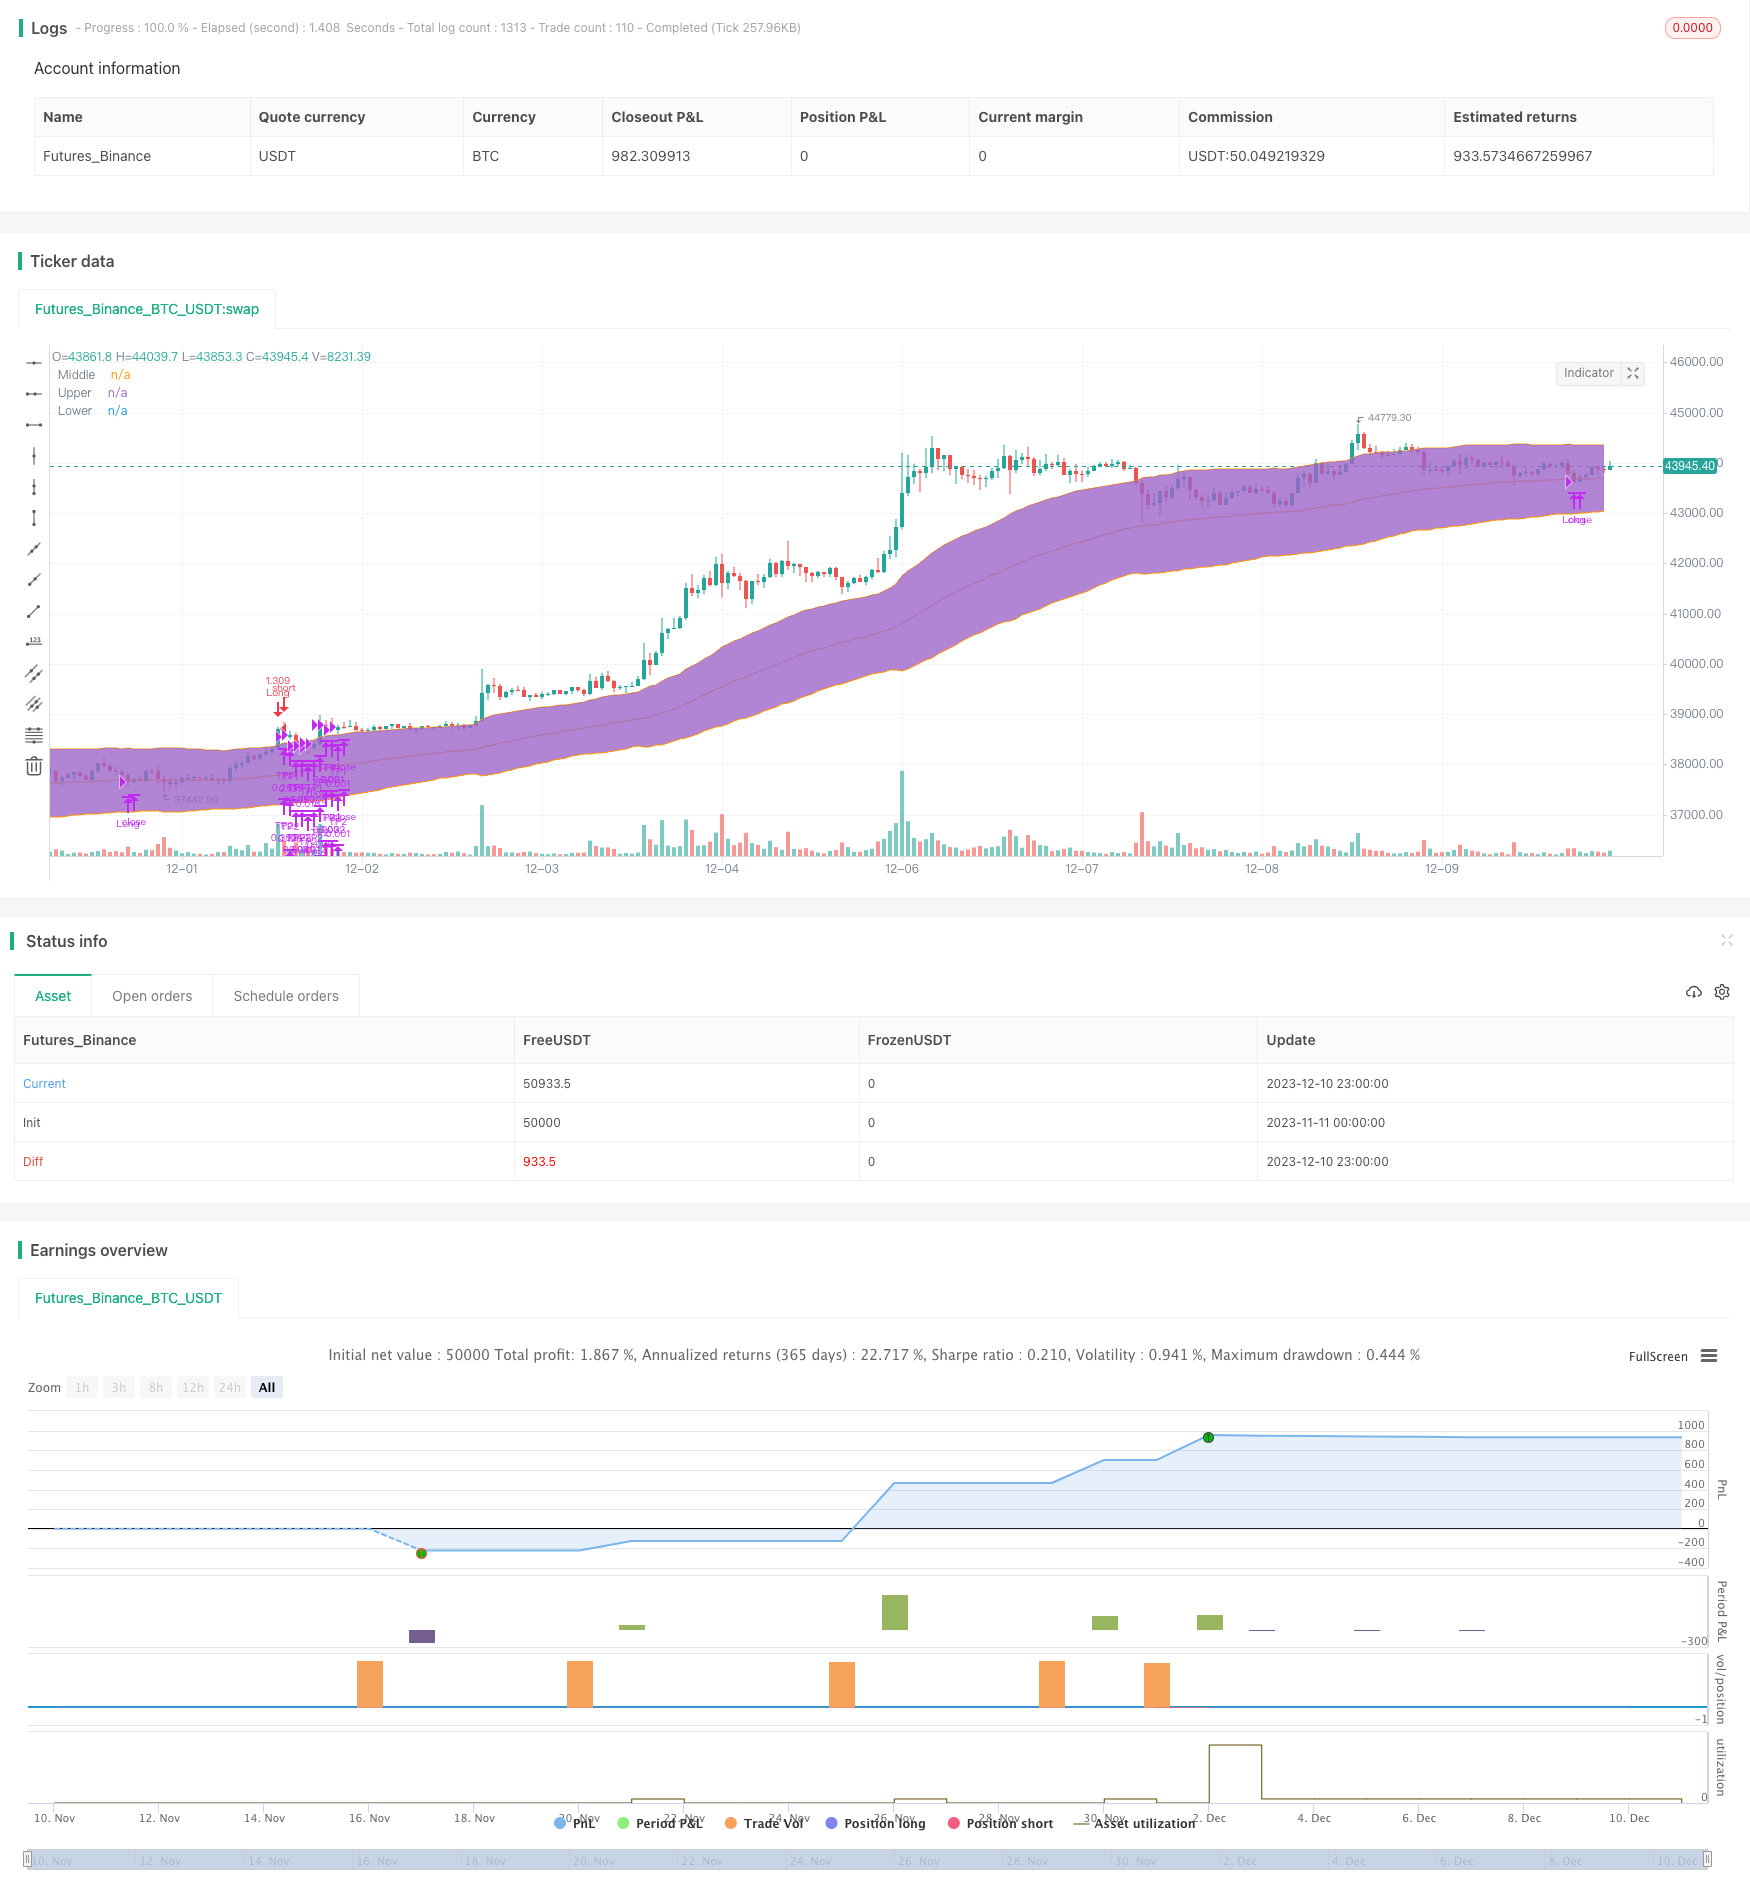
该策略通过计算通道和动量指标,识别趋势形态,实现趋势追踪交易。具体来说,它结合了动量指标和均衡通道指标,利用两者配合使用,在介入 long 期趋势的同时,利用均衡通道来锁定多头获利区域。
策略原理
该策略主要使用以下两个指标进行判断:
-
动量指标(DMI):判断市场多空趋势,指标大于设置阈值时产生交易信号。
-
均衡通道(Keltner Channel):判断趋势区域,价格突破上轨时为买入时机,价格跌破中轨时为平仓信号。
具体交易逻辑为:当+DI动量指标大于设置阈值(默认32)时,判断为多头趋势形成,此时如价格突破均衡通道上轨,产生买入信号;之后利用均衡通道中轨作为止损线,跟踪止损,实现获利保护。
该策略综合运用两个指标的优势,利用动量指标判断趋势方向,利用均衡通道判断入场时机和止损区域。双重指标组合,使策略能够在发现趋势早期高效入场,同时利用通道指标锁定盈利和止损。
优势分析
-
策略利用动量指标判断市场趋势的早期,比简单移动平均线等滞后指标更加高效。
-
运用均衡通道判断具体交易区间,能够有效锁定获利区域。
-
指标参数和交易规则严谨合理,回测数据表现良好,实盘验证效果。
-
策略较为简单清晰,容易理解实现,适合量化交易初学者学习。
-
策略风险可控,采用中轨均线动态止损,有效控制单笔损失。
风险分析
-
策略仅适用于趋势行情,不适用于盘整波动市场,如遇QtCore通道增大,中轨止损过于宽松,无法控制损失。
-
DMI指标存在一定滞后,无法确定趋势确认,可能较早介入趋势带来损失。
-
固定百分比止损方式存在风险,大幅震荡后无法重新介入趋势,错过后续行情。
-
回测数据充足,但实盘仍需长时间运行验证参数稳定性。
优化方向
-
可以测试不同止损方式,如ATR止损、移动止损等方式替换固定百分比止损。
-
可以加入次级确认指标,如成交量放大,确保趋势确认后入场。
-
可以测试不同参数组合优化,寻找最佳参数组合。
-
可以通过步进优化和游动回测验证参数稳健性。
总结
本策略运用双重指标判断,实现了对趋势行情的高效捕捉。策略较为简单直观,逻辑清晰,回测表现较好,可作为量化交易的入门策略之一。但仍需充分验证实盘数据和优化参数,降低实盘跑输风险,将是未来的重点工作。
||
Overview
This strategy identifies trend formations by calculating channels and momentum indicators to achieve trend tracking trading. Specifically, it combines momentum indicators and equilibrium channel indicators, and takes advantage of both to intervene in long-term trends while using equilibrium channels to lock in long profit areas.
Strategy Principle
The strategy mainly uses the following two indicators for judgment:
-
Momentum Indicator (DMI): Judge the long and short trend in the market and generate trading signals when the index is greater than the set threshold.
-
Equilibrium Channel (Keltner Channel): Determine the trend area. When the price breaks through the upper rail, it is time to buy, and when the price falls below the middle rail, it is a signal to close the position.
The specific trading logic is: When the +DI momentum indicator is greater than the set threshold (default 32), it is determined that a bullish trend has formed. At this time, if the price breaks through the upper rail of the equilibrium channel, a buy signal is generated; after that, the equilibrium channel is used. The middle rail is used as a stop loss line to track the stop loss and achieve profit protection.
This strategy combines the advantages of two indicators, uses momentum indicators to determine trend direction, and uses equilibrium channels to determine entry timing and stop loss areas. The double indicator combination allows the strategy to efficiently enter early in the discovery of a trend, while using channel indicators to lock in profits and stops.
Advantage Analysis
-
The strategy uses momentum indicators to determine the early stage of market trends, which is more efficient than lagging indicators such as simple moving averages.
-
Using the equilibrium channel to determine the specific trading range can effectively lock the profit zone.
-
The indicator parameters and trading rules are rigorous and reasonable, and the backtest data performs well and verifies the actual combat effect.
-
The strategy is relatively simple and clear, easy to understand and implement, and suitable for quantitative trading beginners to learn.
-
The risk of the strategy is controllable, and it adopts dynamic stop loss with the median line to effectively control single loss.
Risk analysis
-
The strategy is only suitable for trending markets and not suitable for consolidating and fluctuating markets. If the QtCore channel increases and the middle rail stop loss is too loose, it cannot control the loss.
-
The DMI indicator has a certain lag and cannot determine trend confirmation. It may cause losses by intervening in the trend earlier.
-
The fixed percentage stop loss method has risks. It is unable to re-intervene in trends after a sharp fluctuation, thus missing subsequent trends.
-
There are sufficient backtest data, but long-term running is still required to verify parameter stability in real trading.
Optimization
-
Different stop loss methods can be tested, such as ATR stop loss, moving stop loss and so on to replace fixed percentage stop loss.
-
Secondary confirmation indicators can be added, such as volume amplification, to ensure entry after trend confirmation.
-
Different parameter combinations can be tested to find the optimal parameter combination.
-
The robustness of parameters can be verified through stepwise optimization and walk forward testing.
Summary
This strategy achieves efficient capturing of trending markets by using double indicator judgments. The strategy is relatively simple and intuitive with clear logic and good backtest performance. It can serve as one of the entry strategies for quantitative trading. But sufficient verification of real trading data and parameter optimization is still required to reduce real trading losses. This will be the focus of future work.
[/trans]
Strategy Arguments
| Argument | Default | Description |
|---|---|---|
| v_input_1 | true | Enable Ribbon Filter |
| v_input_2 | 30 | Ribbon Period |
| v_input_3 | true | useTrueRange |
| v_input_4 | 80 | KELTNER Period |
| v_input_5 | 3 | KELTNER Multiple |
| v_input_6 | 14 | ADX Smoothing |
| v_input_7 | 14 | DI Length |
| v_input_8 | 32 | +DI Trigger Level |
| v_input_9 | 2019 | Backtest Start Year |
| v_input_10 | true | Backtest Start Month |
| v_input_11 | true | Backtest Start Day |
| v_input_12 | 2030 | Backtest Stop Year |
| v_input_13 | 12 | Backtest Stop Month |
| v_input_14 | 31 | Backtest Stop Day |
| v_input_15 | 8 | Long Take Profit 1 Target % |
| v_input_16 | 20 | Long Take Profit 1 Qty % |
| v_input_17 | 16 | Long Take Profit 2 Target % |
| v_input_18 | 30 | Long Take Profit 2 Qty % |
Source (PineScript)
/*backtest
start: 2023-11-11 00:00:00
end: 2023-12-11 00:00:00
period: 1h
basePeriod: 15m
exchanges: [{"eid":"Futures_Binance","currency":"BTC_USDT"}]
*/

//Original Idea by: @Wunderbit


//@version=4
strategy("Keltner Channel [LINKUSDT] 1H", overlay=true, initial_capital=3000,pyramiding = 0, currency="USD", default_qty_type=strategy.percent_of_equity, default_qty_value=100,  commission_type=strategy.commission.percent,commission_value=0.1)


/// TREND
trend_cond = input(true, title="Enable Ribbon Filter")
ribbon_period = input(30, "Ribbon Period", step=1)

leadLine1 = ema(close, ribbon_period)
leadLine2 = sma(close, ribbon_period)

// p3 = plot(leadLine1, color= #53b987, title="EMA", transp = 50, linewidth = 1)
// p4 = plot(leadLine2, color= #eb4d5c, title="SMA", transp = 50, linewidth = 1)
// fill(p3, p4, transp = 60, color = leadLine1 > leadLine2 ? #53b987 : #eb4d5c)

//Upward Trend
UT=leadLine2 < leadLine1
DT=leadLine2 > leadLine1

///////////////////////////////////////INDICATORS

// KELTNER //
source       = close
useTrueRange = input(true)
length       = input(80, "KELTNER Period", step=1, minval=1)
mult         = input(3.0,"KELTNER Multiple", step=0.1)

// Calculate Keltner Channel
ma      = ema(source, length)
range   = useTrueRange ? tr : high - low
rangema = ema(range, length)
upper = ma + rangema * mult
lower = ma - rangema * mult

plot(ma, title="Middle", color=color.orange)
p1=plot(upper, title="Upper", color=color.orange)
p2=plot(lower, title="Lower", color=color.orange)
fill(p1,p2)


// DMI INDICATOR //

lensig = input(14, title="ADX Smoothing", minval=1, maxval=50)
len = input(14, minval=1, title="DI Length")
up = change(high)
down = -change(low)
plusDM = na(up) ? na : (up > down and up > 0 ? up : 0)
minusDM = na(down) ? na : (down > up and down > 0 ? down : 0)
trur = rma(tr, len)
plus = fixnan(100 * rma(plusDM, len) / trur)
minus = fixnan(100 * rma(minusDM, len) / trur)
sum = plus + minus
adx = 100 * rma(abs(plus - minus) / (sum == 0 ? 1 : sum), lensig)

trig_level=input(title="+DI Trigger Level", defval=32, minval=1,step=1)
//trig_level_adx=input(title="ADX Trigger Level", defval=30, minval=1,step=1)

//plot(adx, color=#FF006E, title="ADX")
//plot(plus, color=#0094FF, title="+DI")
//plot(minus, color=#FF6A00, title="-DI")
// plot(trig_level, color=color.white, title="Key Level")

///////////////////////////////////////////////////////////


////////////////////////////////////////////////////Component Code Start

testStartYear = input(2019, "Backtest Start Year")
testStartMonth = input(1, "Backtest Start Month")
testStartDay = input(1, "Backtest Start Day")
testPeriodStart = timestamp(testStartYear,testStartMonth,testStartDay,0,0)

testStopYear = input(2030, "Backtest Stop Year")
testStopMonth = input(12, "Backtest Stop Month")
testStopDay = input(31, "Backtest Stop Day")
testPeriodStop = timestamp(testStopYear,testStopMonth,testStopDay,0,0)

testPeriod() =>
    time >= testPeriodStart and time <= testPeriodStop ? true : false

///// Component Code Stop //////////////////////////////////////////

//////////////// STRATEGY EXECUTION //////////////////////////

// STRATEGY CONDITION
// LONG

long = ((open > lower and open < upper) and close > upper) and plus > minus and plus > trig_level and volume[0] > volume[1]
entry_long = trend_cond ? long and UT : long
exit_long = (close < ma) //or low < SL_long

//LONG SET UP
// Take Profit / Stop Loss

entry_price_long=valuewhen(entry_long,close,0)
//SL_long = entry_price_long * (1 - long_sl_inp)

long_tp1_inp = input(8, title='Long Take Profit 1 Target %', step=0.1)/100
long_tp1_qty = input(20, title="Long Take Profit 1 Qty %", step=1)

long_tp2_inp = input(16, title='Long Take Profit 2 Target %', step=0.1)/100
long_tp2_qty = input(30, title="Long Take Profit 2 Qty %", step=1)

long_take_level_1 = strategy.position_avg_price * (1 + long_tp1_inp)
long_take_level_2 = strategy.position_avg_price * (1 + long_tp2_inp)

//long_sl_inp = input(4, title='Long Stop Loss %', step=0.1)/100
//long_stop_level = strategy.position_avg_price * (1 - long_sl_inp)


// STRATEGY EXECUTION
if testPeriod()

    // LONG

    strategy.entry(id="Long", long=true, when=entry_long, comment = "INSERT ENTRY LONG COMMAND")
    strategy.exit("TP1","Long", qty_percent=long_tp1_qty, limit=long_take_level_1) // PLACE TAKE PROFIT IN WBT BOT SETTINGS
    strategy.exit("TP2","Long", qty_percent=long_tp2_qty, limit=long_take_level_2) // PLACE TAKE PROFIT IN WBT BOT SETTINGS
    strategy.close(id="Long", when=exit_long, comment= "INSERT EXIT LONG COMMAND")


//PLOT FIXED SLTP LINE
// LONG POSITION
plot(strategy.position_size > 0 ? long_take_level_1 : na, style=plot.style_linebr, color=color.green, linewidth=1, title="1st Long Take Profit")
plot(strategy.position_size > 0 ? long_take_level_2 : na, style=plot.style_linebr, color=color.green, linewidth=1, title="2nd Long Take Profit")
//plot(strategy.position_size > 0 ? long_stop_level : na, style=plot.style_linebr, color=color.red, linewidth=1, title="Long Stop Loss")
Detail
https://www.fmz.com/strategy/435167
Last Modified
2023-12-12 18:07:31