
8.2 KiB
Name
动态ATR追踪止损策略Dynamic-ATR-Trailing-Stop-Loss-Strategy
Author
ChaoZhang
Strategy Description
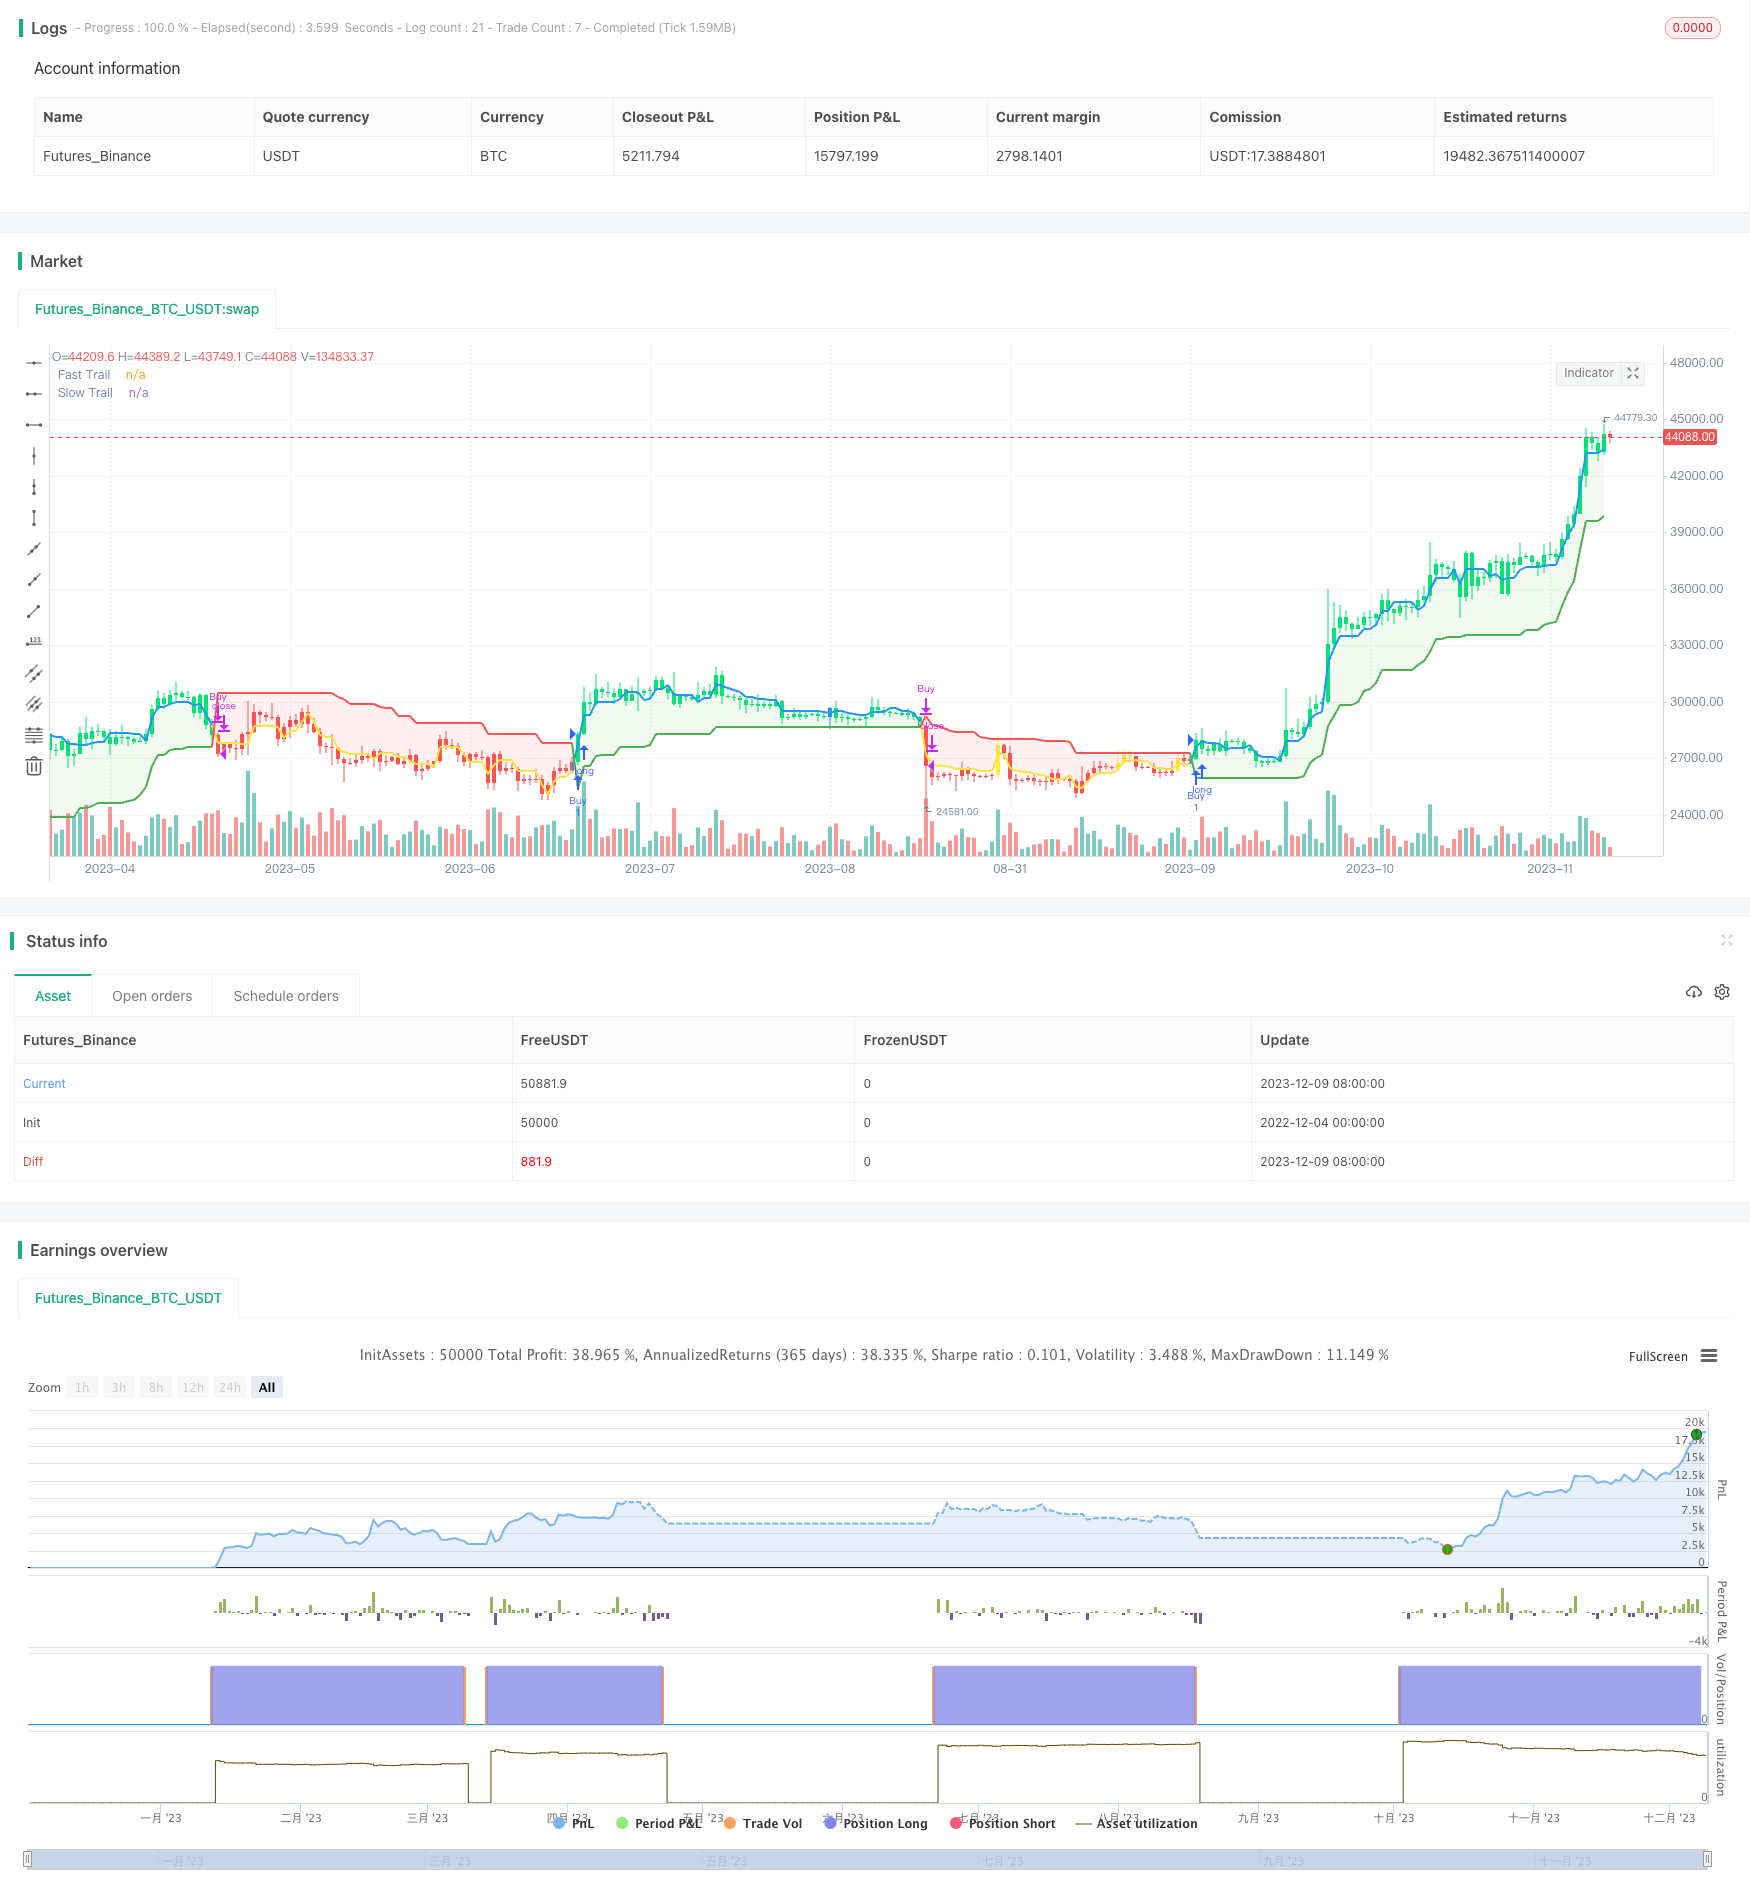 [trans]
概述
本策略是基于ATR指标设计的动态追踪止损机制,可以在保证止损的同时,实时调整止损位置,争取更大盈利。
策略原理
策略使用快速ATR周期5和慢速ATR周期10构建双层动态追踪止损。当价格运行向有利方向时,快速层会第一时间启动追踪,收紧止损位置;当价格短期回调时,慢速层的止损位置可以避免过早止损。同时,快慢速层之间的交叉作为交易信号。
具体来说,快速层的止损距离为0.5倍5周期ATR,慢速层的止损距离为3倍10周期ATR。当快速层向上突破慢速层时产生买入信号;当快速层向下跌破慢速层时产生卖出信号。止损线也会实时更新,并画在价格曲线之下。
优势分析
该策略最大的优势是可以动态调整止损位置,在保证止损的前提下,最大限度争取更多盈利。相比固定止损距离,动态ATR止损线可以根据市场波动程度作出调整,降低止损被激活的概率。
此外,双层ATR设计可以平衡止损的灵敏度。快速层响应迅速,慢速层则可以过滤掉短期噪音,避免过早止损。
风险分析
该策略主要的风险在于止损距离设定是否合理。如果ATR倍数设置过大,止损幅度将跟不上价格运行。如果ATR倍数过小,则容易被短期噪音止损。所以需要根据不同品种的特点调整参数。
此外,在盘整行情中,ATR值较小,止损线靠得较近,容易被频繁止损。所以该策略更适合具有一定波动率的品种。
优化方向
可以尝试不同的ATR周期参数组合,寻找最佳平衡。此外可以考虑和其他指标配合使用,例如趋势指标判断市场阶段,从而动态调整ATR倍数的大小。
也可以研究替代ATR指标的可能性。将ATR改为DKVOL、HRANGE或ATR百分比等指标值,可能可以获得更好的止损效果。
总结
本策略基于ATR指标设计了双层动态追踪机制,既可争取更大盈利,有可避免过度止损。适合对止损要求较高的用户。该策略可根据市场和品种特点灵活调整参数,从而达到最佳止损效果。
||
Overview
This strategy is based on the dynamic trailing stop loss mechanism designed with the ATR indicator to adjust the stop loss in real time while ensuring effective stop loss to maximize profits.
Strategy Logic
The strategy uses fast ATR period 5 and slow ATR period 10 to build a dual-layer dynamic trailing stop loss. When price runs in a favorable direction, the fast layer will activate trailing stop first to tighten the stop loss; when there is a short-term pullback, the slow layer stop loss can avoid premature stop out. Meanwhile, the crossover between the fast and slow layers serves as the trading signal.
Specifically, the stop loss distance of the fast layer is 0.5 times the 5-period ATR, and the stop loss distance of the slow layer is 3 times the 10-period ATR. A buy signal is generated when the fast layer breaks above the slow layer, and a sell signal is generated when the fast layer breaks below the slow layer. The stop loss line is also updated in real time and plotted below the price curve.
Advantage Analysis
The biggest advantage of this strategy is that it can dynamically adjust the stop loss position to maximize profits while ensuring effective stop loss. Compared with fixed stop loss distance, the dynamic ATR stop loss line can make adjustments based on the fluctuation of the market to reduce the probability of stop loss being triggered.
In addition, the dual-layer ATR design balances the sensitivity of stop loss. The fast layer responds quickly and the slow layer can filter out short-term noise to avoid premature stop loss.
Risk Analysis
The main risk of this strategy lies in whether the setting of stop loss distance is reasonable. If the ATR multiplier is set too high, the stop loss range will not keep up with the price movement. If the ATR multiplier is too small, it is prone to be stopped out by short-term noises. Therefore, parameters need to be adjusted according to the characteristics of different varieties.
In addition, in a range-bound market, the ATR value is smaller and the stop loss line is closer, which can easily lead to frequent stop loss. Therefore, this strategy is more suitable for varieties with certain volatility.
Optimization Directions
Different combinations of ATR cycle parameters can be tried to find the optimal balance. It can also consider combining with other indicators, such as trend indicators to judge the market stage, so as to dynamically adjust the size of ATR multiplier.
It is also possible to study alternatives to the ATR indicator, replacing ATR with DKVOL, HRANGE or ATR Percentage, etc may achieve better stop loss effect.
Summary
This strategy designs a dual-layer dynamic trailing mechanism based on the ATR indicator to maximize profits while avoiding excessive stop loss. It is suitable for users who have higher requirements for stop loss. This strategy can flexibly adjust parameters according to market and variety characteristics to achieve optimal stop loss effect.
[/trans]
Strategy Arguments
| Argument | Default | Description |
|---|---|---|
| v_input_1_close | 0 | Source: close |
| v_input_2 | 5 | Fast ATR period |
| v_input_3 | 0.5 | Fast ATR multiplier |
| v_input_4 | 10 | Slow ATR period |
| v_input_5 | 3 | Slow ATR multiplier |
| v_input_6 | true | Paint color on chart |
Source (PineScript)
/*backtest
start: 2022-12-04 00:00:00
end: 2023-12-10 00:00:00
period: 1d
basePeriod: 1h
exchanges: [{"eid":"Futures_Binance","currency":"BTC_USDT"}]
*/

//@version=4
strategy("ATR Trailing Stop Strategy by ceyhun", overlay=true)

/////////notes////////////////////////////////////////
// This is based on the ATR trailing stop indicator //
// width addition of two levels of stops and        //
// different interpretation.                        //
// This is a fast-reacting system and is better     //
// suited for higher volatility markets             //
//////////////////////////////////////////////////////

SC = input(close, "Source", input.source)

// Fast Trail //
AP1 = input(5, "Fast ATR period", input.integer)  // ATR Period
AF1 = input(0.5, "Fast ATR multiplier", input.float)  // ATR Factor
SL1 = AF1 * atr(AP1)  // Stop Loss
Trail1 = 0.0
Trail1 := iff(SC > nz(Trail1[1], 0) and SC[1] > nz(Trail1[1], 0), max(nz(Trail1[1], 0), SC - SL1), iff(SC < nz(Trail1[1], 0) and SC[1] < nz(Trail1[1], 0), min(nz(Trail1[1], 0), SC + SL1), iff(SC > nz(Trail1[1], 0), SC - SL1, SC + SL1)))

// Slow Trail //
AP2 = input(10, "Slow ATR period", input.integer)  // ATR Period
AF2 = input(3, "Slow ATR multiplier", input.float)  // ATR Factor
SL2 = AF2 * atr(AP2)  // Stop Loss
Trail2 = 0.0
Trail2 := iff(SC > nz(Trail2[1], 0) and SC[1] > nz(Trail2[1], 0), max(nz(Trail2[1], 0), SC - SL2), iff(SC < nz(Trail2[1], 0) and SC[1] < nz(Trail2[1], 0), min(nz(Trail2[1], 0), SC + SL2), iff(SC > nz(Trail2[1], 0), SC - SL2, SC + SL2)))

// Bar color for trade signal //
Green = Trail1 > Trail2 and close > Trail2 and low > Trail2
Blue = Trail1 > Trail2 and close > Trail2 and low < Trail2
Red = Trail2 > Trail1 and close < Trail2 and high < Trail2
Yellow = Trail2 > Trail1 and close < Trail2 and high > Trail2

// Signals //
Bull = barssince(Green) < barssince(Red)

Buy = crossover(Trail1, Trail2)
Sell = crossunder(Trail1, Trail2)

TS1 = plot(Trail1, "Fast Trail", style=plot.style_line, color=Trail1 > Trail2 ? color.blue : color.yellow, linewidth=2, display=display.none)
TS2 = plot(Trail2, "Slow Trail", style=plot.style_line, color=Trail1 > Trail2 ? color.green : color.red, linewidth=2)
fill(TS1, TS2, Bull ? color.new(color.green, 90) : color.new(color.red, 90))

plotcolor = input(true, "Paint color on chart", input.bool)

bcl = iff(plotcolor == 1, Blue ? color.blue : Green ? color.lime : Yellow ? color.yellow : Red ? color.red : color.white, na)
barcolor(bcl)

if Buy
    strategy.entry("Buy", strategy.long, comment="Buy")

if Sell
    strategy.close("Buy")
Detail
https://www.fmz.com/strategy/434976
Last Modified
2023-12-11 14:24:18