
8.2 KiB
Name
动态ATR止损中心线策略Dynamic-ATR-Stop-Loss-Center-Line-Strategy
Author
ChaoZhang
Strategy Description
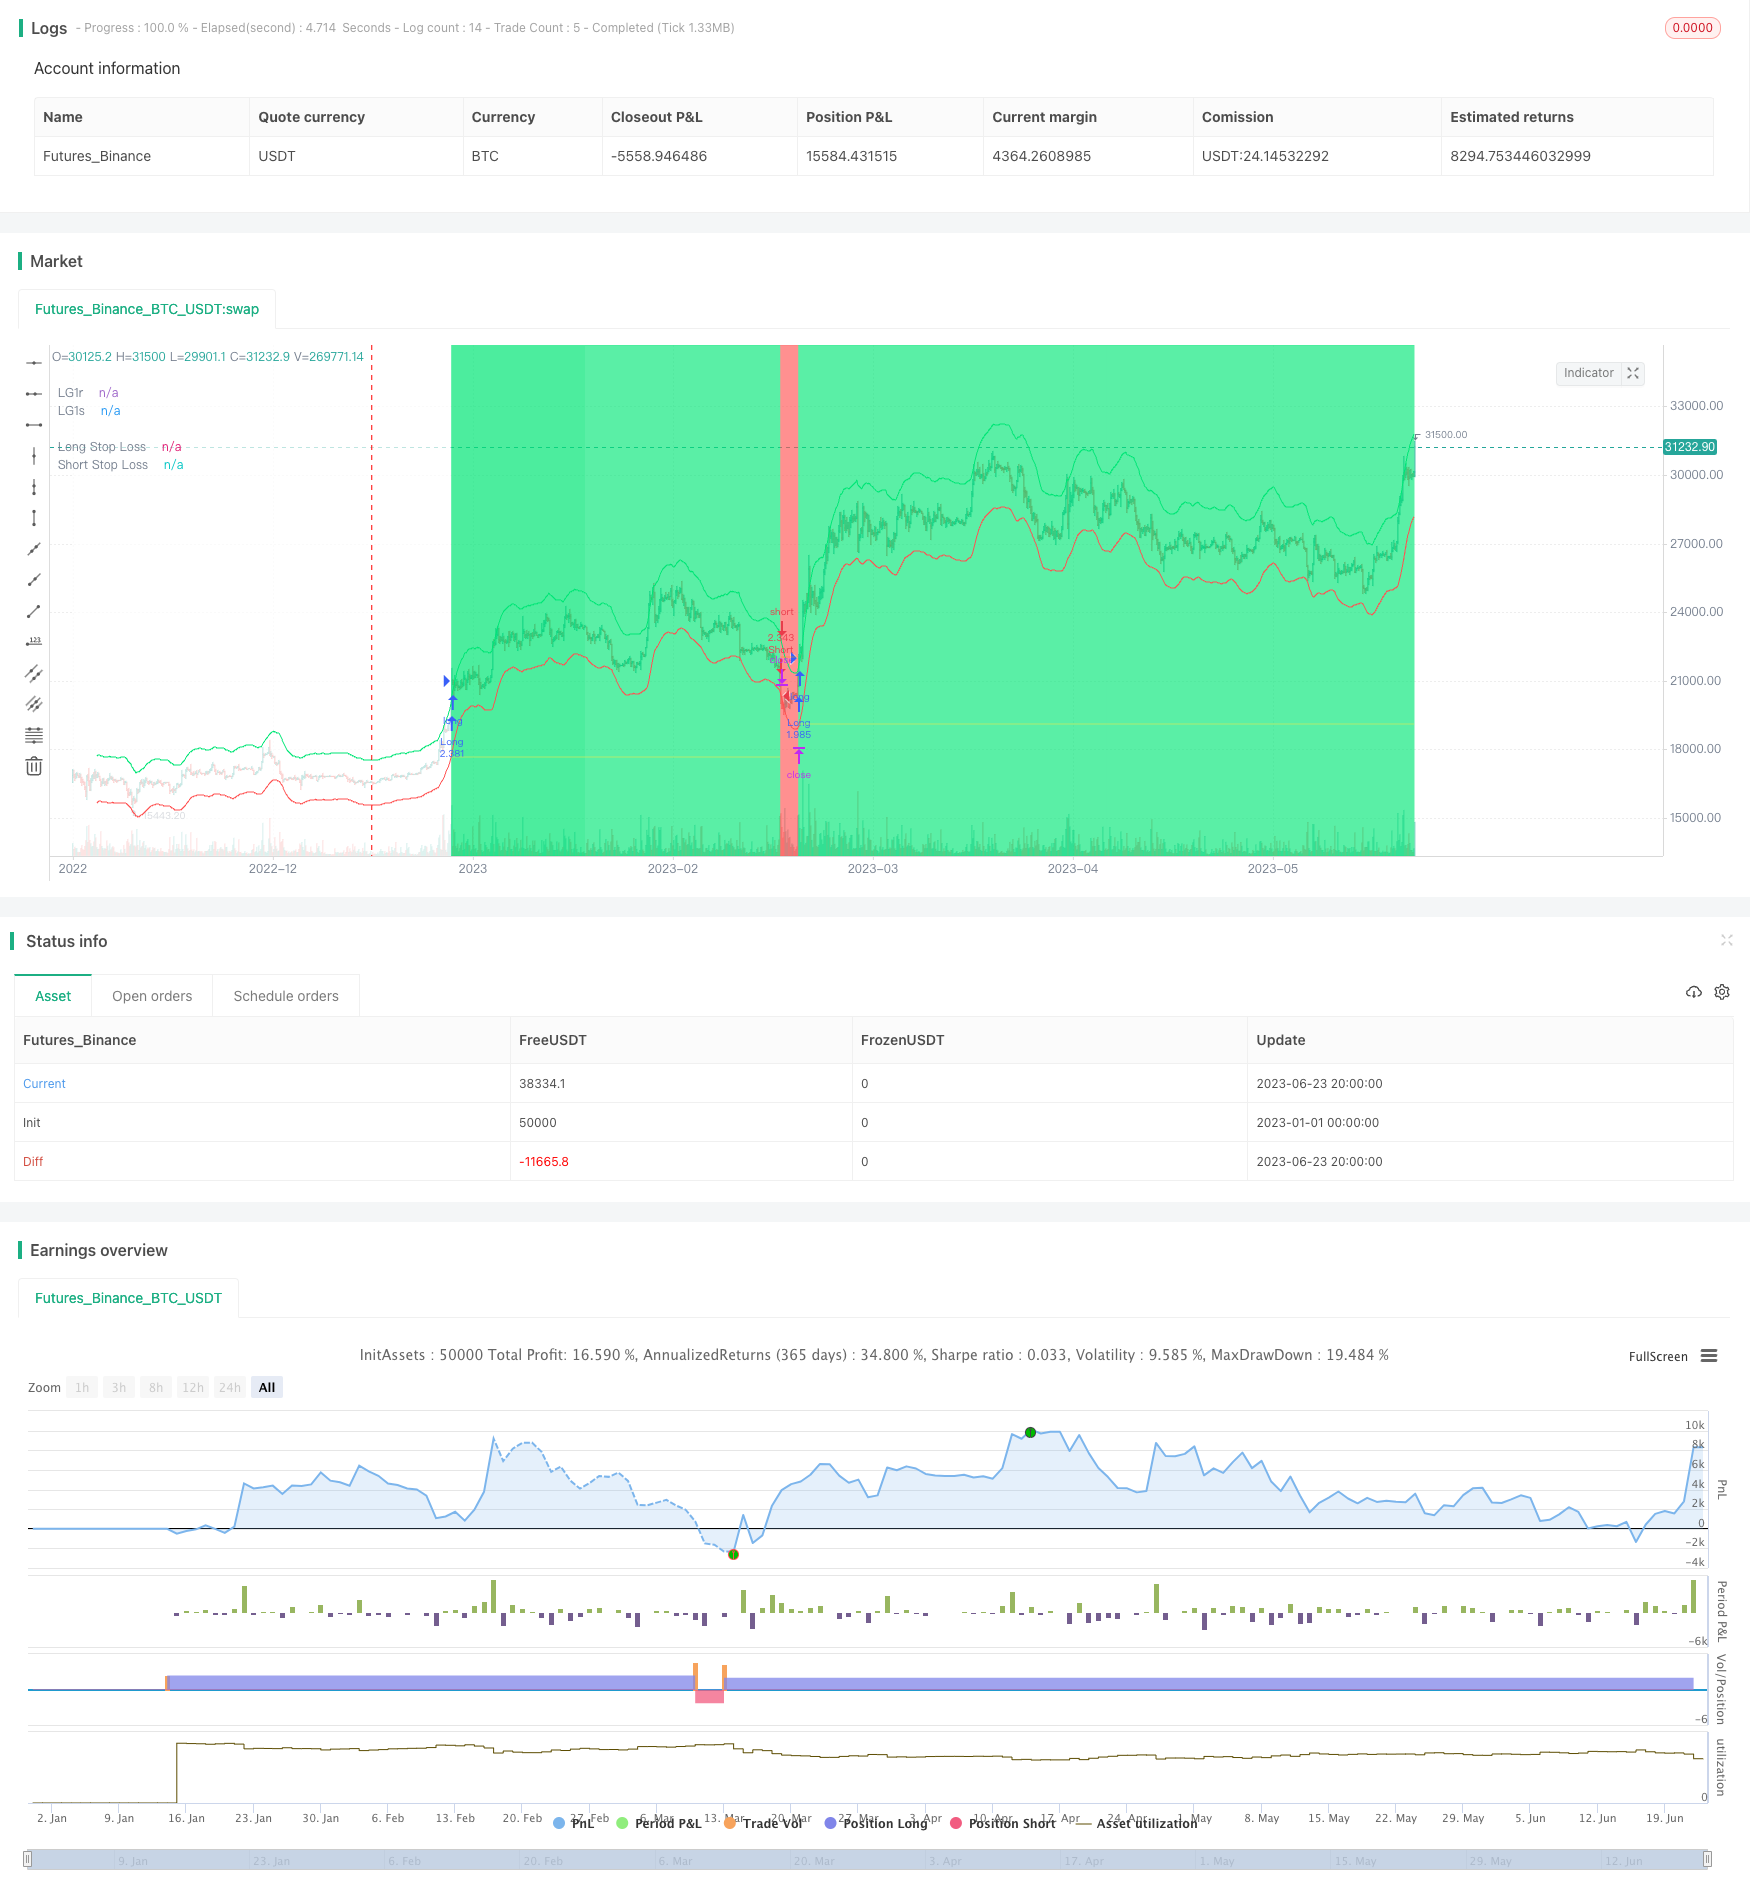
[trans]
概述
这个策略利用线性回归函数和最小二乘法计算出价格通道,通道由两条绿色和红色线组成。它采用基于近期ATR的动态止损来放置止损单。
策略原理
该策略使用长度为25,平移5的线性回归计算出中心线xLG。然后在中心线上下各取价格的6%做为通道范围,通道上线是xLG1r,通道下线是xLG1s。
当价格高于xLG1r时,做多;当价格低于xLG1s时,做空。并记录最后做多和做空的时间。当最后做多时间大于最后做空时间时产生做多信号;当最后做空时间大于最后做多时间时产生做空信号。
动态ATR止损使用ATR周期1,倍数2来计算。在做多时,止损线为收盘价减去ATR值与倍数的乘积;在做空时,止损线为收盘价加上ATR值与倍数的乘积。
优势分析
- 使用线性回归通道,能跟踪长期趋势
- 基于ATR计算止损,可以动态调整,避免止损过大过小
- 采用价格突破产生信号,可以减少虚假信号
风险及改进
- 线性回归通道参数需要优化,现在的通道范围可能过窄
- ATR倍数也需要测试以获得最佳参数
- 可以考虑在突破时增加确认机制,避免假突破
优化思路
- 测试不同的回归长度周期,找到较优的参数
- 尝试不同的ATR周期和ATR止损倍数
- 在突破信号时,增加额外确认条件,如交易量突破
总结
该策略整合了趋势跟踪、动态止损和突破信号等多种技术指标,形成一个具有较强适应性的趋势跟踪体系。通过优化参数和增加信号过滤,可以进一步增强策略稳定性和盈利能力。该策略可以为量化交易者提供一个非常有价值的思路。
||
Overview
This strategy uses a linear regression function and least squares method to calculate a price channel, consisting of two green and red lines. It employs a dynamic stop loss based on recent ATR.
Strategy Logic
The strategy calculates the center line xLG using linear regression with length 25 and shift 5. Then it takes 6% above and below the center line as channel range, with xLG1r as the upper line and xLG1s as the lower line.
When price is above xLG1r, it goes long. When price is below xLG1s, it goes short. It records the last long and short time. A long signal is generated when the last long time is greater than the last short time. A short signal is generated when the last short time is greater than the last long time.
The dynamic ATR stop loss uses ATR period of 1 and multiplier of 2. For long trades, the stop loss is closing price minus ATR value times multiplier. For short trades, the stop loss is closing price plus ATR value times multiplier.
Advantage Analysis
- Uses linear regression channel to track long term trends
- ATR-based stop loss adjusts dynamically to avoid stops being too wide or too tight
- Price breakout signals help avoid false signals
Risks and Improvements
- Regression channel parameters need optimization, current range may be too narrow
- ATR multiplier also needs testing to find optimal parameter
- Consider adding confirmation on breakout to avoid false breakouts
Optimization Directions
- Test different regression period lengths to find better parameters
- Try different ATR periods and stop loss multipliers
- Add additional confirmation on breakout signals, like volume breakout
Conclusion
This strategy combines multiple techniques like trend following, dynamic stops and breakout signals to create an adaptive trend tracking system. Further enhancements in parameter optimization and signal filtering can improve robustness and profitability. It provides a valuable approach for quant traders.
[/trans]
Strategy Arguments
| Argument | Default | Description |
|---|---|---|
| v_input_1 | 2017 | Backtest Start Year |
| v_input_2 | true | Backtest Start Month |
| v_input_3 | true | Backtest Start Day |
| v_input_4 | 2019 | Backtest Stop Year |
| v_input_5 | 12 | Backtest Stop Month |
| v_input_6 | 31 | Backtest Stop Day |
| v_input_7 | 25 | Length |
| v_input_8 | 5 | m |
| v_input_9 | 6 | COG % |
| v_input_10 | true | ATR Stop Period |
| v_input_11 | 2 | ATR Stop Multiplier |
Source (PineScript)
/*backtest
start: 2023-01-01 00:00:00
end: 2023-06-24 00:00:00
period: 4h
basePeriod: 15m
exchanges: [{"eid":"Futures_Binance","currency":"BTC_USDT"}]
*/

//@version=4
// Thanks to HPotter for the original code for Center of Gravity Backtest
strategy("Center of Gravity BF ?", overlay=true, initial_capital=10000, default_qty_type=strategy.percent_of_equity, default_qty_value=100, commission_type=strategy.commission.percent, commission_value=0.15)

/////////////// Time Frame ///////////////
testStartYear = input(2017, "Backtest Start Year")
testStartMonth = input(1, "Backtest Start Month")
testStartDay = input(1, "Backtest Start Day")
testPeriodStart = timestamp(testStartYear,testStartMonth,testStartDay, 0, 0)

testStopYear = input(2019, "Backtest Stop Year")
testStopMonth = input(12, "Backtest Stop Month")
testStopDay = input(31, "Backtest Stop Day")
testPeriodStop = timestamp(testStopYear,testStopMonth,testStopDay, 0, 0)

testPeriod() => true

///////////// Center of Gravity /////////////
Length = input(25, minval=1)
m = input(5, minval=0)
Percent = input(6, minval=0, title="COG %")

xLG = linreg(close, Length, m)
xLG1r = xLG + ((close * Percent) / 100)
xLG1s = xLG - ((close * Percent) / 100)

pos = 0.0
pos := iff(close > xLG1r, 1, iff(close < xLG1s, -1, nz(pos[1], 0)))
possig = iff(pos == 1, 1, iff(pos == -1, -1, pos))

/////////////// Srategy ///////////////
long = possig == 1
short = possig == -1

last_long = 0.0
last_short = 0.0
last_long := long ? time : nz(last_long[1])
last_short := short ? time : nz(last_short[1])

long_signal = crossover(last_long, last_short)
short_signal = crossover(last_short, last_long)

last_open_long_signal = 0.0
last_open_short_signal = 0.0
last_open_long_signal := long_signal ? open : nz(last_open_long_signal[1])
last_open_short_signal := short_signal ? open : nz(last_open_short_signal[1])

last_long_signal = 0.0
last_short_signal = 0.0
last_long_signal := long_signal ? time : nz(last_long_signal[1])
last_short_signal := short_signal ? time : nz(last_short_signal[1])

in_long_signal = last_long_signal > last_short_signal
in_short_signal = last_short_signal > last_long_signal

last_high = 0.0
last_low = 0.0
last_high := not in_long_signal ? na : in_long_signal and (na(last_high[1]) or high > nz(last_high[1])) ? high : nz(last_high[1])
last_low := not in_short_signal ? na : in_short_signal and (na(last_low[1]) or low < nz(last_low[1])) ? low : nz(last_low[1])

since_longEntry = barssince(last_open_long_signal != last_open_long_signal[1])
since_shortEntry = barssince(last_open_short_signal != last_open_short_signal[1])

/////////////// Dynamic ATR Stop Losses ///////////////
atrLkb = input(1, minval=1, title='ATR Stop Period')
atrMult = input(2, step=0.25, title='ATR Stop Multiplier')
atr1 = atr(atrLkb)

longStop = 0.0
longStop :=  short_signal ? na : long_signal ? close - (atr1 * atrMult) : longStop[1]
shortStop = 0.0
shortStop := long_signal ? na : short_signal ? close + (atr1 * atrMult) : shortStop[1]

/////////////// Execution ///////////////
if testPeriod()
    strategy.entry("Long",  strategy.long, when=long)
    strategy.entry("Short", strategy.short, when=short)
    strategy.exit("Long SL", "Long", stop=longStop, when=since_longEntry > 0)
    strategy.exit("Short SL", "Short", stop=shortStop, when=since_shortEntry > 0)

/////////////// Plotting ///////////////
plot(xLG1r, color=color.lime, title="LG1r")
plot(xLG1s, color=color.red, title="LG1s")
plot(strategy.position_size <= 0 ? na : longStop, title="Long Stop Loss", color=color.yellow, style=plot.style_circles, linewidth=1)
plot(strategy.position_size >= 0 ? na : shortStop, title="Short Stop Loss", color=color.orange, style=plot.style_circles, linewidth=1)
bgcolor(strategy.position_size > 0 ? color.lime : strategy.position_size < 0 ? color.red : color.white, transp=90)
bgcolor(long_signal ? color.lime : short_signal ? color.red : na, transp=60)
Detail
https://www.fmz.com/strategy/429390
Last Modified
2023-10-16 16:20:06