
13 KiB
Name
动态价格通道突破策略Dynamic-Price-Channel-Breakout-Strategy
Author
ChaoZhang
Strategy Description
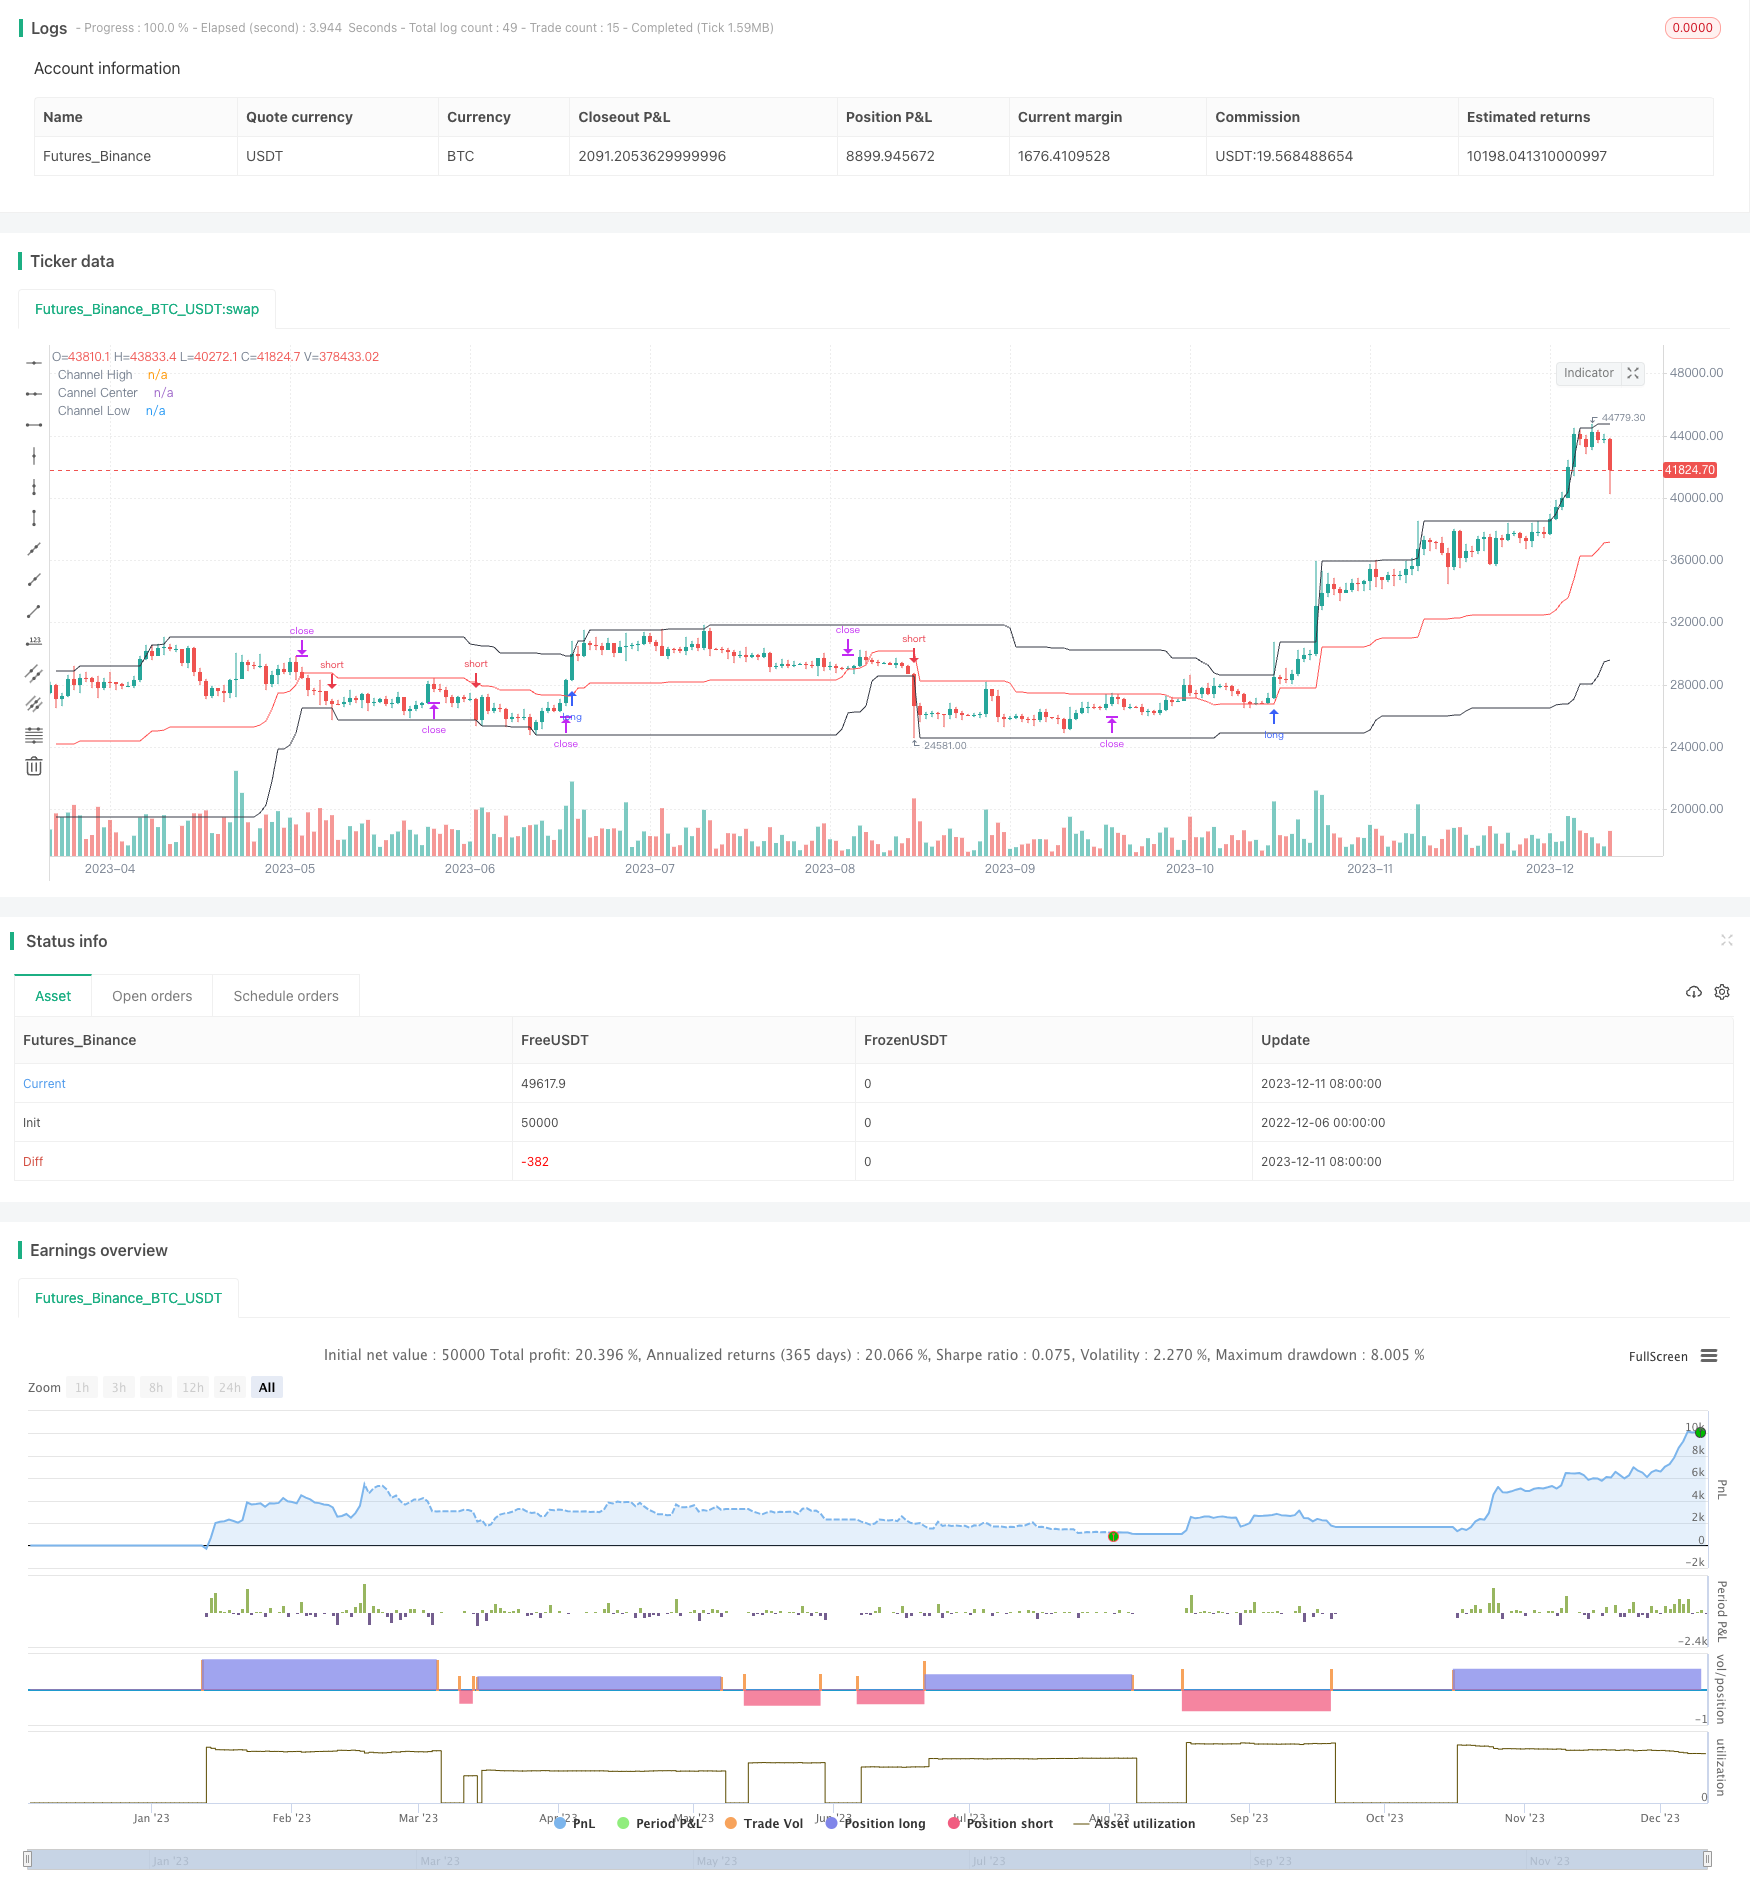
[trans]
概述
动态价格通道突破策略是一种基于Donchian价格通道指标的量化交易策略。该策略根据价格通道的上限线和下限线来判断市场趋势方向,在价格突破通道时建立做多或做空仓位。
本策略的主要思想是Using breakouts of the Donchan price channel.当价格突破通道上限时,建立做多头寻求趋势;当价格跌破通道下限时,建立做空头寻求趋势。
策略原理
指标计算
价格通道由以下公式计算:
上限线 = 最高价的N周期最高值
下限线 = 最低价的N周期最低值
中线 = (上限线 + 下限线)/2
其中N代表通道周期长度,本策略中默认为50。
入场规则
当最新K线的最高价突破通道上限线时,建立做多仓位;
当最新K线的最低价跌破通道下限线时,建立做空仓位。
示例:
上一根K线高点未超过通道上限; 当前K线高点突破通道上限; ==> 建立做多仓位
出场规则
出场规则有两种可选:
- 通道出场
平多:止损价格为通道下限;
平空:止损价格为通道上限;
- 中心线出场
无论多头仓位还是空头仓位,当价格重新跌破通道中线时,平掉所有仓位。
风险控制
风险控制采用比例止损方式,根据通道幅度和设置的可承受风险百分比计算具体止损距离。
做多止损距离 = 入场价 * (1 - 可承受风险百分比)
做空止损距离 = 入场价 * (1 + 可承受风险百分比)
例如设置做多风险为2%,入场价为10,000美元,则多单止损线为10,000 * (1 - 2%) = 9,800美元。
优势分析
捕捉趋势突破
当价格突破通道上下限时,很大概率开始新的方向性趋势。这时入场可以捕捉到较大幅度的价格变动。
风险可控
采用比例止损可以将单次损失控制在可承受范围内。
参数优化空间大
通道周期长度、风险比例、止损方式等参数可以进行优化组合,适应更多市场环境。
风险分析
突破失败
价格突破通道上下限不意味着必然形成趋势,存在失败突破的概率,这时容易止损。
震荡行情
当市场处于宽幅震荡时,价格可能频繁触发通道上下限,导致过于频繁交易而增加交易费用和滑点损失。
优化方向
动态通道
可以考虑将价格通道的长度做成一个变量,根据市场波动率自动调整。市场震荡时增大通道长度,趋势明确时减小通道长度。
优化入场机会
结合其他指标过滤入场时机,例如量能指标、移动平均线等,避免在震荡行情中无效突破。
参数规整
使用更多历史数据对参数组合进行测试优化,确定最优参数以适应更广泛的市场情况。
总结
动态价格通道策略总的来说是一个较简单直观的趋势追踪策略。它的优势在于标志明确,容易掌握;风险控制比较合理。但也存在一些问题有待进一步优化,如失败突破和震荡市的处理等。本策略更适合作为趋势交易的辅助工具,和其他技术指标或模型组合使用效果会更好。
||
Overview
The Dynamic Price Channel Breakout Strategy is a quantitative trading strategy based on the Donchian Price Channel indicator. The strategy judges market trend direction according to the upper and lower lines of the price channel, and establishes long or short positions when prices break through the channel.
The main idea of this strategy is Using breakouts of the Donchan price channel. When the price breaks through the upper limit of the channel, establish a long position to seek the trend; When the price breaks through the lower limit of the channel, establish a short position to seek the trend.
Strategy Principle
Indicator Calculation
The price channel is calculated by the following formulas:
Upper Line = Highest high over the past N periods
Lower Line = Lowest low over the past N periods
Middle Line = (Upper Line + Lower Line) / 2
Where N represents the length of the channel cycle. The default is 50 for this strategy.
Entry Rules
When the highest price of the latest K-line breaks through the upper limit of the channel, establish a long position;
When the lowest price of the latest K-line breaks through the lower limit of the channel, establish a short position.
Example:
The high point of the previous K-line did not exceed the upper limit of the channel;
The high point of the current K-line breaks through the upper limit of the channel;
==> Establish a long position
Exit Rules
There are two optional exit rules:
- Channel Exit
Close long position: Stop loss price is the lower limit of the channel;
Close short position: Stop loss price is the upper limit of the channel;
- Middle Line Exit
No matter long or short positions, close all positions when prices fall back below the middle line of the channel.
Risk Control
Risk control adopts proportional stop loss to calculate specific stop loss distance based on channel amplitude and acceptable risk percentage.
Long stop loss distance = Entry price * (1 - Acceptable risk percentage)
Short stop loss distance = Entry price * (1 + Acceptable risk percentage)
For example, if the acceptable risk is set at 2%, the entry price is $10,000, then the stop loss line for long position is 10,000 * (1 - 2%) = $9,800.
Advantage Analysis
Capture Trend Breakouts
When prices break through the upper and lower limits of the channel, it is highly probable that a new directional trend begins. Taking positions at this time can capture relatively large price movements.
Controllable Risks
The use of proportional stop loss can keep single losses within an acceptable range.
Large Parameter Optimization Space
Parameters like channel cycle, risk ratio, stop loss method can be optimized and combined to adapt more market environments.
Risk Analysis
Failed Breakouts
Price breakouts of channel limits do not necessarily form a trend, there is a probability of failed breakouts, which is likely to cause a stop loss.
Range-bound Market
When the market is range-bound, prices may frequently touch the upper and lower limits of the channel, resulting in excessive frequent trading, thus increasing transaction costs and slippage losses.
Optimization Directions
Dynamic Channel
Consider making the length of the price channel a variable that automatically adjusts based on market volatility. Increase the channel length when the market oscillates and decrease the channel length when the trend is clear.
Optimize Entry Opportunities
Combine other indicators to filter entry timing, such as volume indicators, moving averages, etc. to avoid ineffective breakouts in oscillating markets.
Parameter Optimization
Use more historical data to test and optimize parameter combinations to determine the optimal parameters to adapt to wider market conditions.
Summary
The Dynamic Price Channel Strategy is generally a relatively simple and intuitive trend tracking strategy. Its advantages are clear signals and easy to grasp; The risk control is relatively reasonable. But there are still some problems to be further optimized, such as handling failed breakouts and oscillating markets. This strategy is more suitable as an auxiliary tool for trend trading, and the effect will be better when combined with other technical indicators or models.
[/trans]
Strategy Arguments
| Argument | Default | Description |
|---|---|---|
| v_input_1 | true | Long |
| v_input_2 | true | Short |
| v_input_3 | 2 | Risk size for long, % |
| v_input_4 | 2 | Risk size for short, % |
| v_input_5 | 0 | Stop-loss type: Center |
| v_input_6 | 100 | Lot, % |
| v_input_7 | 50 | Price Channel Length |
| v_input_8 | true | Show lines |
| v_input_9 | true | Show offset |
| v_input_10 | true | Show label (drawdown) |
| v_input_11 | false | Show background |
| v_input_12 | 1900 | From Year |
| v_input_13 | 2100 | To Year |
| v_input_14 | true | From Month |
| v_input_15 | 12 | To Month |
| v_input_16 | true | From day |
| v_input_17 | 31 | To day |
Source (PineScript)
/*backtest
start: 2022-12-06 00:00:00
end: 2023-12-12 00:00:00
period: 1d
basePeriod: 1h
exchanges: [{"eid":"Futures_Binance","currency":"BTC_USDT"}]
*/

//Noro

//@version=4
strategy(title = "Noro's RiskChannel Strategy", shorttitle = "RiskChannel str", overlay = true, default_qty_type = strategy.percent_of_equity, initial_capital = 100, default_qty_value = 100, pyramiding = 0, commission_value = 0.1)

//Settings
needlong  = input(true, defval = true, title = "Long")
needshort = input(true, defval = true, title = "Short")
risklong  = input(2.0, minval = 0.0, maxval = 99.9, title = "Risk size for long, %")
riskshort = input(2.0, minval = 0.0, maxval = 99.9, title = "Risk size for short, %")
stoptype  = input(defval = "Center", options = ["Channel", "Center"], title = "Stop-loss type")
lotsize   = input(100, defval = 100, minval = 1, maxval = 10000, title = "Lot, %")
pclen     = input(50, minval = 1, title = "Price Channel Length")
showll    = input(true, defval = true, title = "Show lines")
showof    = input(true, defval = true, title = "Show offset")
showdd    = input(true, defval = true, title = "Show label (drawdown)")
showbg    = input(false, defval = false, title = "Show background")
fromyear  = input(1900, defval = 1900, minval = 1900, maxval = 2100, title = "From Year")
toyear    = input(2100, defval = 2100, minval = 1900, maxval = 2100, title = "To Year")
frommonth = input(01, defval = 01, minval = 01, maxval = 12, title = "From Month")
tomonth   = input(12, defval = 12, minval = 01, maxval = 12, title = "To Month")
fromday   = input(01, defval = 01, minval = 01, maxval = 31, title = "From day")
today     = input(31, defval = 31, minval = 01, maxval = 31, title = "To day")

//Price Channel
h = highest(high, pclen)
l = lowest(low, pclen)
center = (h + l) / 2

//Stop-loss
needstop = stoptype == "Center" or needlong == false or needshort == false
sl = center

//Lines
pccol = showll ? color.black : na
slcol = showll and stoptype == "Center" ? color.red : na
offset = showof ? 1 : 0
plot(h, offset = offset, color = pccol, title = "Channel High")
plot(center, offset = offset, color = slcol, title = "Cannel Center")
plot(l, offset = offset, color = pccol, title = "Channel Low")

//Background
size = strategy.position_size
bgcol = showbg == false ? na : size > 0 ? color.lime : size < 0 ? color.red : na
bgcolor(bgcol, transp = 70)

//Var
loss = 0.0
maxloss = 0.0
equity = 0.0
truetime = time > timestamp(fromyear, frommonth, fromday, 00, 00) and time < timestamp(toyear, tomonth, today, 23, 59)

//Lot size
risksizelong = -1 * risklong
risklonga = stoptype == "Center" ? ((center / h) - 1) * 100 : ((l / h) - 1) * 100
coeflong = abs(risksizelong / risklonga)
lotlong = (strategy.equity / close) * coeflong
risksizeshort = -1 * riskshort
riskshorta = stoptype == "Center" ? ((center / l) - 1) * 100 : ((h / l) - 1) * 100
coefshort = abs(risksizeshort / riskshorta)
lotshort = (strategy.equity / close) * coefshort

//Trading
if h > 0
    strategy.entry("Long", strategy.long, lotlong, stop = h, when = strategy.position_size <= 0 and needlong and truetime)
    strategy.entry("Short", strategy.short, lotshort, stop = l, when = strategy.position_size >= 0 and needshort and truetime)
sl := sl != 0 ? sl : size > 0 ? l : size < 0 ? h : na
if size > 0 and needstop
    strategy.exit("Stop Long", "Long", stop = sl)
if size < 0 and needstop
    strategy.exit("Stop Short", "Short", stop = sl)
if time > timestamp(toyear, tomonth, today, 23, 59)
    strategy.close_all()
    strategy.cancel("Long")
    strategy.cancel("Short")

if showdd

    //Drawdown
    max = 0.0
    max := max(strategy.equity, nz(max[1]))
    dd = (strategy.equity / max - 1) * 100
    min = 100.0
    min := min(dd, nz(min[1]))

    //Max loss size
    equity := strategy.position_size == 0 ? strategy.equity : equity[1]
    loss := equity < equity[1] ? ((equity / equity[1]) - 1) * 100 : 0
    maxloss := min(nz(maxloss[1]), loss)

    //Label
    min := round(min * 100) / 100
    maxloss := round(maxloss * 100) / 100
    labeltext = "Drawdown: " + tostring(min) + "%" + "\nMax.loss " + tostring(maxloss) + "%"
    var label la = na
    label.delete(la)
    tc = min > -100 ? color.white : color.red
    osx = timenow + round(change(time)*10)
    osy = highest(100)
    // la := label.new(x = osx, y = osy, text = labeltext, xloc = xloc.bar_time, yloc = yloc.price, color = color.black, style = label.style_labelup, textcolor = tc)
Detail
https://www.fmz.com/strategy/435259
Last Modified
2023-12-13 16:03:37