
7.0 KiB
Name
三EMA叉加Stochastic-RSI策略3EMA-with-Stochastic-RSI-Strategy
Author
ChaoZhang
Strategy Description
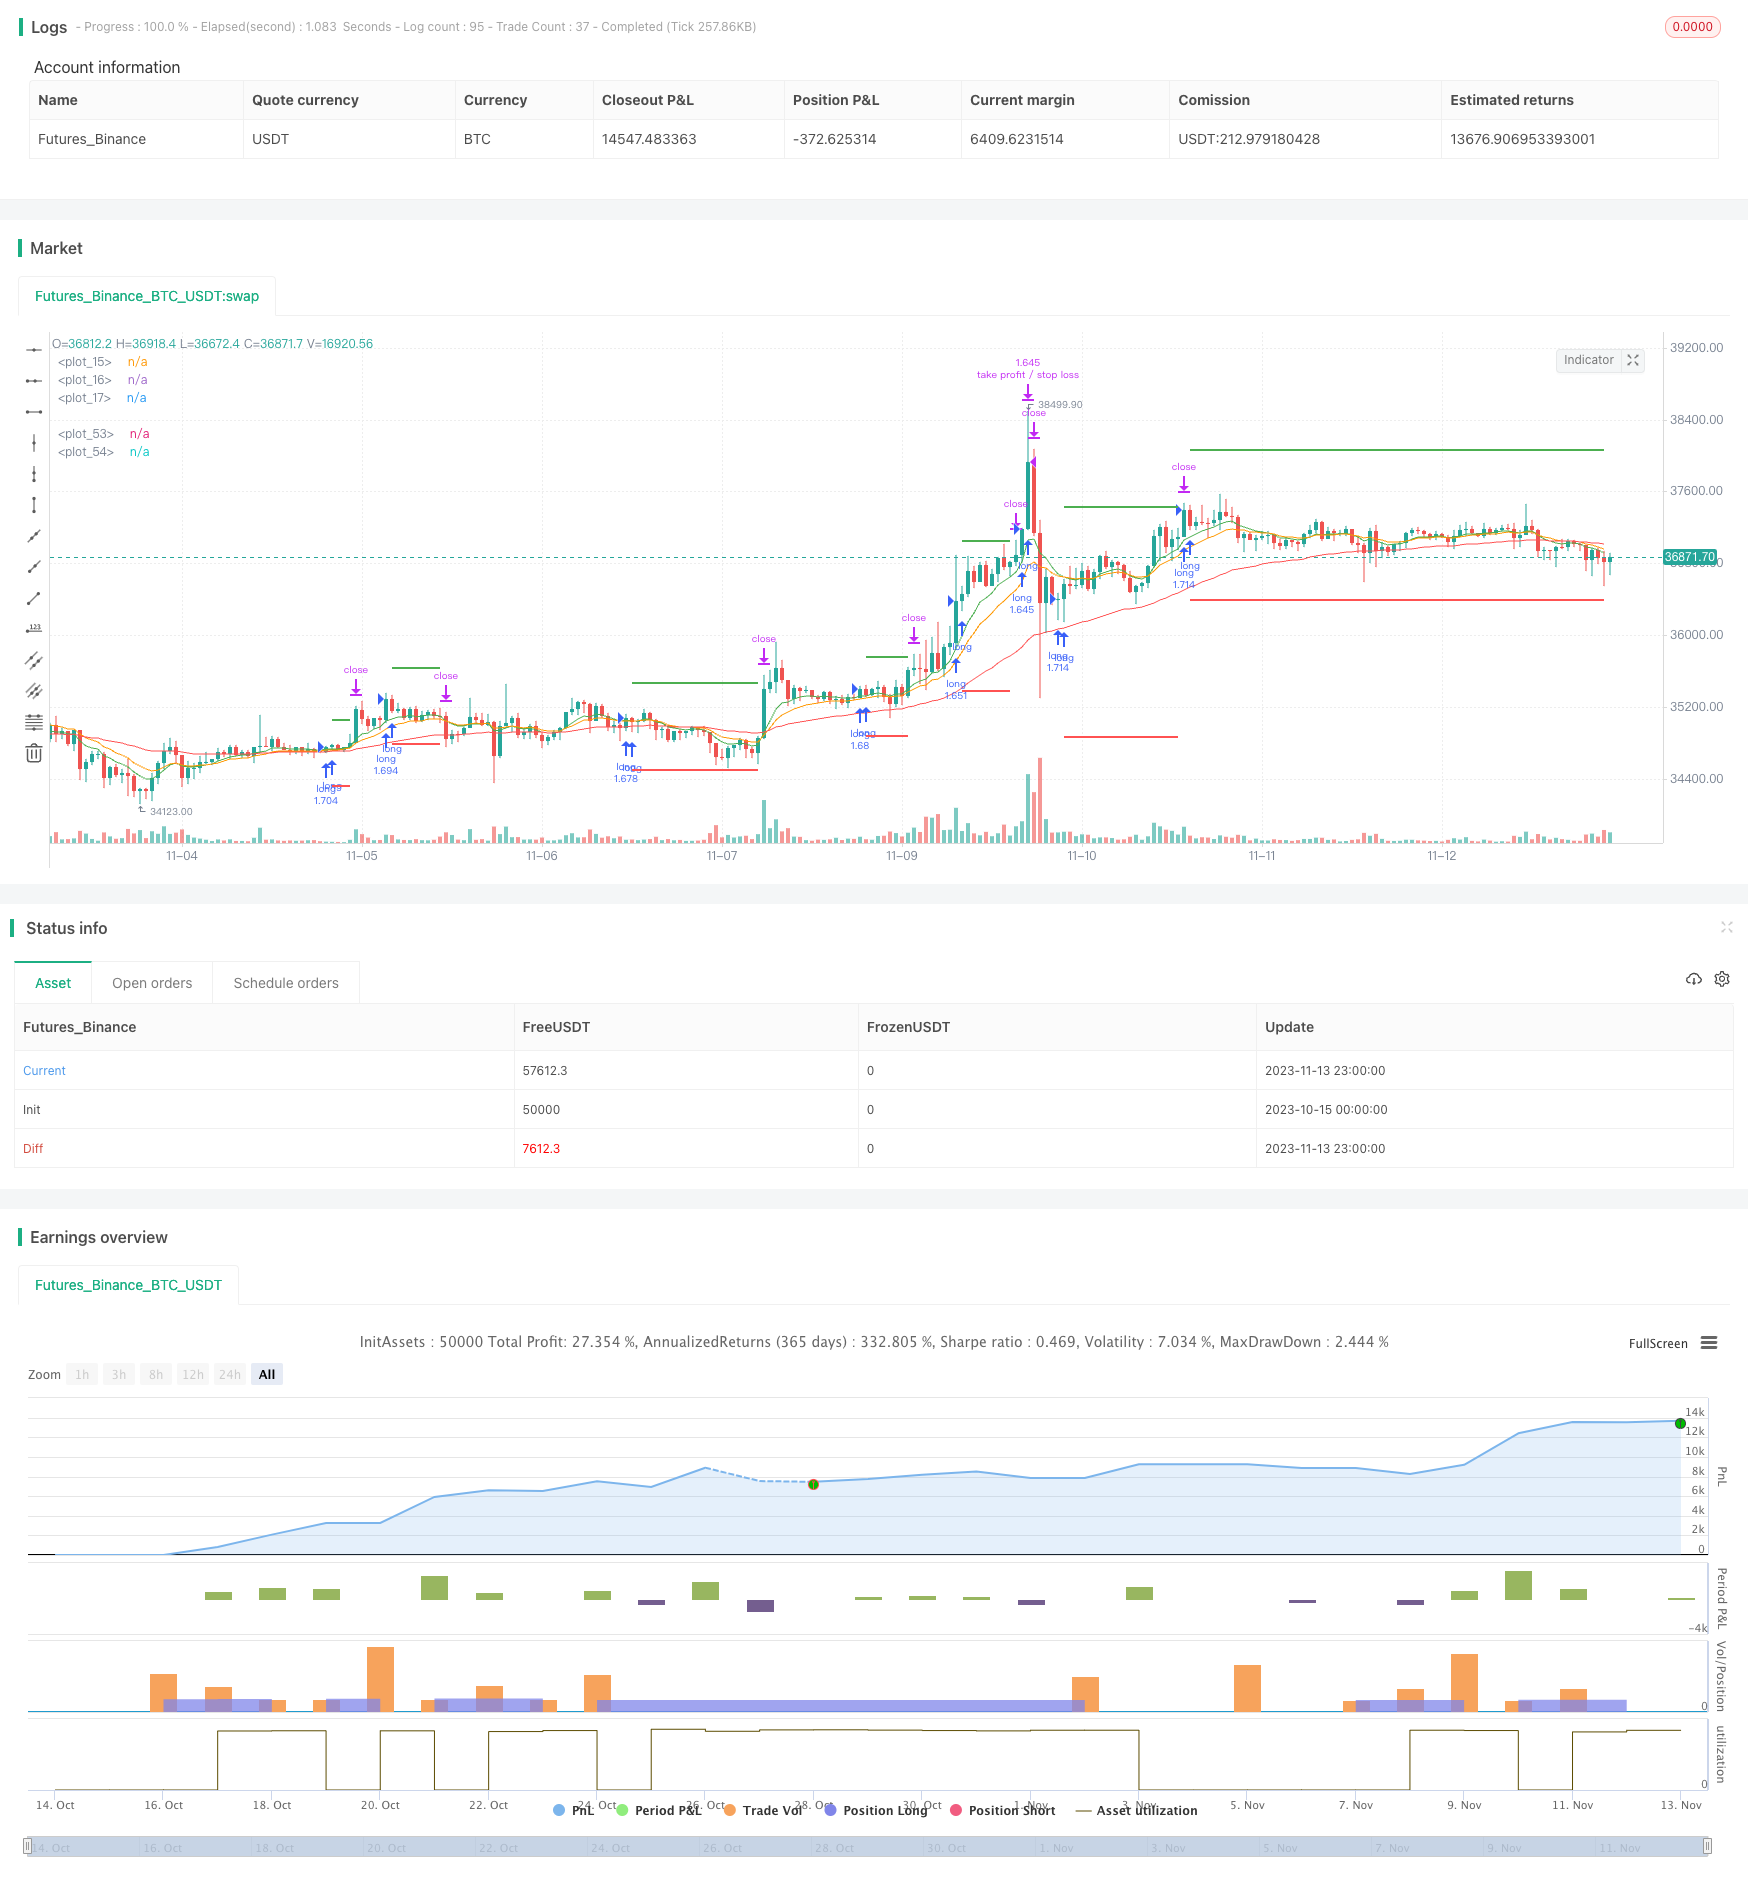 [trans]
概述
这是一个结合多种指标的趋势跟踪策略。它同时使用三个不同周期的EMA,Stochastic RSI和ATR来识别趋势方向和建立仓位。当快周期EMA上穿慢周期EMA时开仓做多,止损位于最近ATR的值的3倍下方,止盈为2倍最近ATR的值。
原理
该策略使用三个EMA均线,分别是8周期、14周期和50周期的EMA。它们分别代表了不同时间段内的价格趋势。当8周期EMA上穿14周期EMA,14周期EMA上穿50周期EMA时,说明目前处于趋势开始阶段,可以选择建立做多仓位。
Stochastic RSI指标结合RSI和Stochastic计算方法,可以发现超买超卖现象。当Stochastic RSI的K线从下方上穿D线时,说明市场正在从超卖状态转为看涨,可以选做多。
ATR代表最近的波动范围。策略使用ATR的3倍作为止损距离,2倍作为止盈距离,以锁定盈利并控制风险。
优势
- 使用EMA均线可以滤除价格数据中的部分噪音,识别出趋势方向
- Stochastic RSI指标可以发现反转机会
- ATR动态跟踪止损止盈,可以根据市场波动幅度来设定合理的盈亏距离
风险
- 多重指标组合可能出现错误信号
- 固定的止损止盈倍数无法适应市场的变化
- 短周期做多容易受反转影响
可以通过调整EMA周期参数来优化指标的敏感度。也可以使ATR的止损止盈倍数可调,根据市场情况来设定合适参数。此外,可以考虑加入其它指标辅助判断,避免出现误信号。
优化方向
- 调整EMA周期参数,优化指标敏感度
- 使ATR止损止盈倍数可调
- 加入其它指标判断,避免误信号
总结
本策略综合考虑了趋势方向、超买超卖现象和波动范围来识别入场时机。EMA均线和Stochastic RSI指标配合使用可以有效识别趋势,ATR动态跟踪止损止盈有助于风险控制。通过参数调整和优化,该策略可以成为一个可靠的趋势跟踪系统。但需要注意防范指标误信号和固定止损止盈的弊端。
||
Overview
This is a trend following strategy combining multiple indicators. It uses three EMAs with different periods, Stochastic RSI and ATR to identify trend direction and establish positions. It goes long when the faster EMA crosses above the slower EMA, with stop loss set at 3 times the recent ATR value and take profit at 2 times the recent ATR.
Principle
The strategy uses three EMA lines - 8-, 14- and 50-period EMAs, representing price trends over different timeframes. When the 8-period EMA crosses above the 14-period EMA, and the 14-period EMA crosses above the 50-period EMA, it signals the start of an uptrend and a long position can be initiated.
The Stochastic RSI indicator incorporates RSI and Stochastic calculations to identify overbought/oversold conditions. When the Stochastic RSI K line crosses above the D line from below, it suggests the market is transitioning from oversold to bullish outlook, allowing a long position.
ATR represents the recent volatility range. The strategy uses 3 times ATR as stop loss distance and 2 times ATR as take profit distance to lock in profits and control risk.
Advantages
- EMAs filter out noise in price data and identify trend direction
- Stochastic RSI identifies reversal opportunities
- ATR dynamically trails stop loss/take profit based on market volatility
Risks
- Multiple indicators may generate conflicting signals
- Fixed stop loss/take profit ratios cannot adapt to changing market conditions
- Short-term longs susceptible to reversals
Optimization can be done by adjusting EMA periods to optimize sensitivity. Making ATR ratios adjustable allows customization based on market conditions. Adding other indicators helps validate signals and avoid mistakes.
Enhancement
- Adjust EMA periods to optimize sensitivity
- Make ATR ratios adjustable
- Add other indicators to avoid false signals
Conclusion
The strategy considers trend, overbought/oversold levels, and volatility range to identify entry timing. EMAs and Stochastic RSI combined effectively identify trends, while ATR's dynamic stop loss/take profit helps risk control. With parameter tuning and optimizations, the strategy can become a reliable trend following system. But false signals and fixed stop loss/take profit caveats need to be watched out for.
[/trans]
Strategy Arguments
| Argument | Default | Description |
|---|---|---|
| v_input_1 | 8 | EMA1 Length |
| v_input_2 | 14 | EMA2 Length |
| v_input_3 | 50 | EMA3 Length |
| v_input_4 | 3 | K |
| v_input_5 | 3 | D |
| v_input_6 | 14 | RSI Length |
| v_input_7 | 14 | Stochastic Length |
| v_input_8_close | 0 | RSI Source: close |
| v_input_9 | 14 | ATR Period |
| v_input_10 | 2 | Take-profit Multiplier |
| v_input_11 | 3 | Stop-loss Multiplier |
Source (PineScript)
/*backtest
start: 2023-10-15 00:00:00
end: 2023-11-14 00:00:00
period: 1h
basePeriod: 15m
exchanges: [{"eid":"Futures_Binance","currency":"BTC_USDT"}]
*/

// This source code is subject to the terms of the Mozilla Public License 2.0 at https://mozilla.org/MPL/2.0/
// © FreddieChopin

//@version=4
strategy("3 x EMA + Stochastic RSI + ATR", overlay = true, default_qty_type = strategy.percent_of_equity, default_qty_value = 100)

// 3x EMA
ema1Length = input(8, "EMA1 Length", minval = 1)
ema2Length = input(14, "EMA2 Length", minval = 1)
ema3Length = input(50, "EMA3 Length", minval = 1)
ema1 = ema(close, ema1Length)
ema2 = ema(close, ema2Length)
ema3 = ema(close, ema3Length)

plot(ema1, color = color.green)
plot(ema2, color = color.orange)
plot(ema3, color = color.red)

// Stochastic RSI
smoothK = input(3, "K", minval=1)
smoothD = input(3, "D", minval=1)
lengthRSI = input(14, "RSI Length", minval=1)
lengthStoch = input(14, "Stochastic Length", minval=1)
src = input(close, title="RSI Source")
rsi1 = rsi(src, lengthRSI)
k = sma(stoch(rsi1, rsi1, rsi1, lengthStoch), smoothK)
d = sma(k, smoothD)

// ATR
atrPeriod = input(14, "ATR Period")
takeProfitMultiplier= input(2.0, "Take-profit Multiplier")
stopLossMultiplier= input(3.0, "Stop-loss Multiplier")
atrSeries = atr(atrPeriod)[1]

longCondition = ema1 > ema2 and ema2 > ema3 and crossover(k, d)
strategy.entry("long", strategy.long, when = longCondition)

float stopLoss = na
float takeProfit = na

if (strategy.position_size > 0)
    if (na(stopLoss[1]))
        stopLoss := strategy.position_avg_price - atrSeries * stopLossMultiplier
    else
        stopLoss := stopLoss[1]
    if (na(takeProfit[1]))
        takeProfit := strategy.position_avg_price + atrSeries * takeProfitMultiplier
    else
        takeProfit := takeProfit[1]

    strategy.exit("take profit / stop loss", limit = takeProfit, stop = stopLoss)

plot(stopLoss, color = color.red, linewidth = 2, style = plot.style_linebr)
plot(takeProfit, color = color.green, linewidth = 2, style = plot.style_linebr)
Detail
https://www.fmz.com/strategy/432178
Last Modified
2023-11-15 10:47:20