
8.9 KiB
Name
三均线交叉策略Triple-Moving-Average-Crossover-Strategy
Author
ChaoZhang
Strategy Description
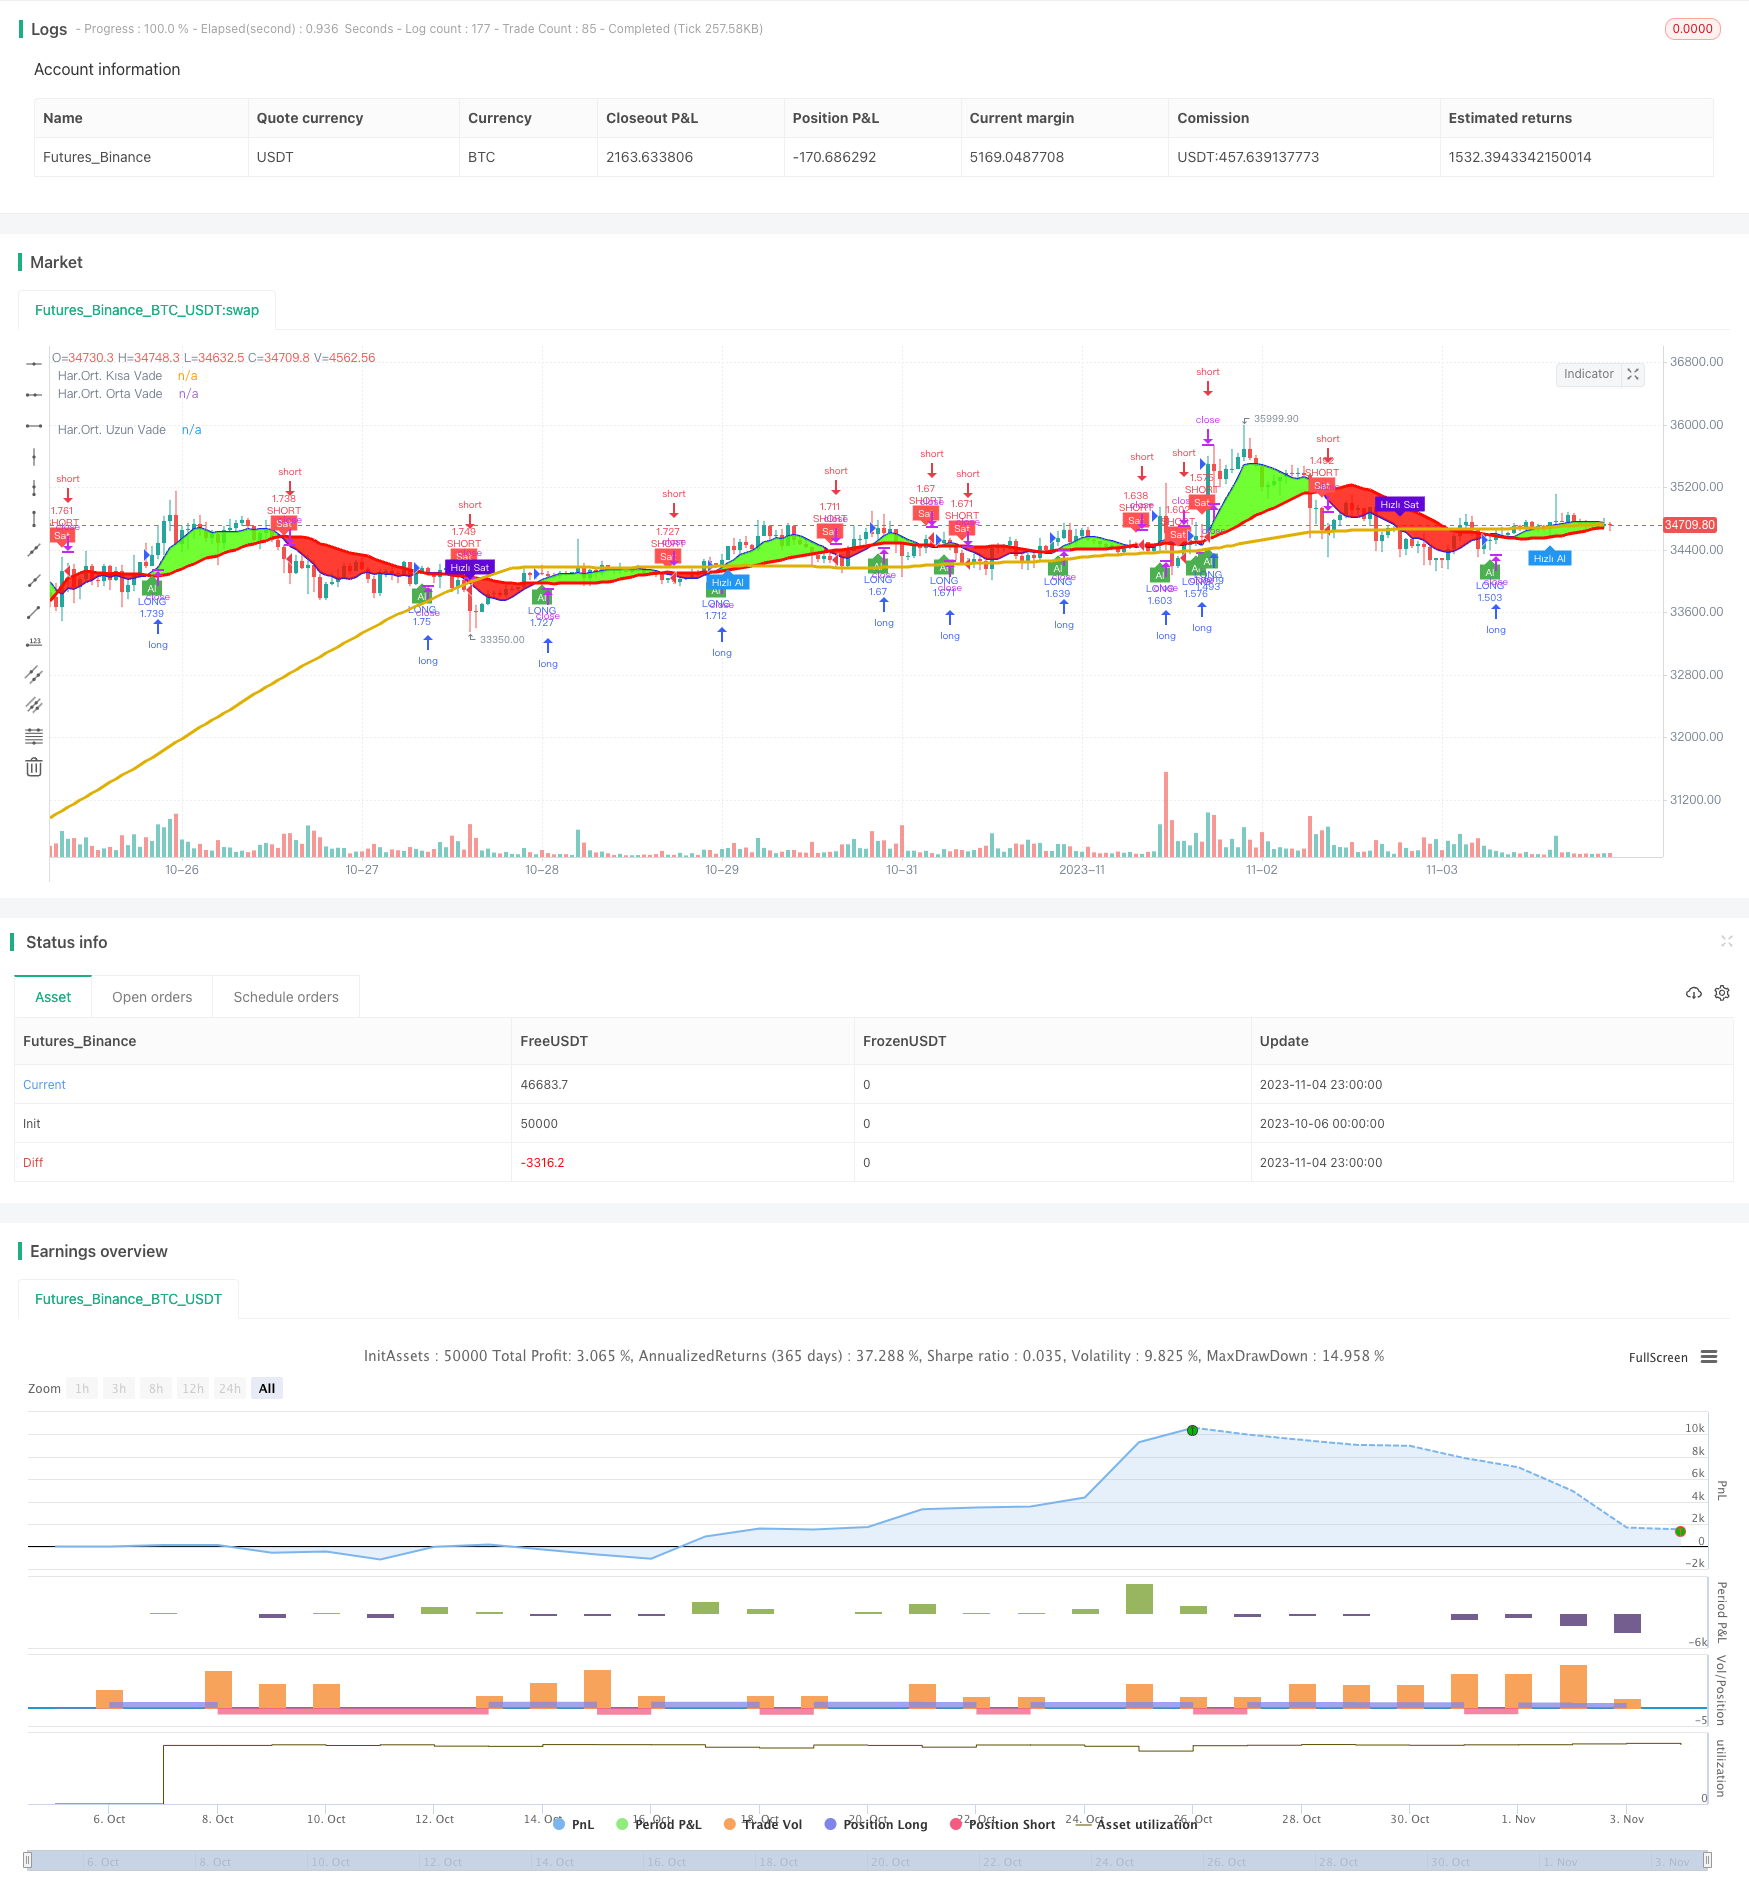 [trans]
概述
三均线交叉策略利用不同时间周期的移动平均线的交叉作为买入和卖出信号,属于趋势跟踪策略。该策略使用三条移动平均线,包括短期移动平均线、中期移动平均线和长期移动平均线,根据它们的交叉形成交易信号。
策略原理
该策略首先计算短期移动平均线(默认7日)、中期移动平均线(默认25日)和长期移动平均线(默认99日),然后根据以下规则产生交易信号:
-
当短期移动平均线上穿中期移动平均线时,产生买入信号。
-
当短期移动平均线下穿中期移动平均线时,产生卖出信号。
-
当短期移动平均线上穿长期移动平均线时,产生快速买入信号。
-
当短期移动平均线下穿长期移动平均线时,产生快速卖出信号。
该策略认为,短期移动平均线上穿中期移动平均线表示市场趋势转为上涨,因此产生买入信号;而短期移动平均线下穿中期移动平均线则表示市场趋势转为下跌,因此产生卖出信号。同理,短期移动平均线与长期移动平均线的交叉也会产生快速的交易信号,以捕捉较长线的趋势变化。
优势分析
- 策略逻辑简单清晰,容易理解和实现。
- 利用多时间周期分析,可以有效捕捉市场趋势的变化。
- 可以通过调整移动平均线的周期,优化策略的参数。
- 可视化的交叉信号,直观地反映趋势的变化。
风险分析
- 移动平均线存在滞后性,可能错过趋势的反转点。
- 多头市场中,短线上穿长线的假信号可能过多。
- 空头市场中,短线下穿长线的假信号可能过多。
- 快速买入和卖出信号可能过于灵敏,增加交易次数和手续费。
可通过适当调整移动平均线周期,或增加过滤条件来优化,减少假信号。也可以适当缩短快速交易周期,降低交易频率。
优化方向
- 增加过滤条件,例如大于某个交易量或者价格变化百分比时才产生信号。
- 结合其他指标过滤,例如MACD,KDJ等,避免在无明确趋势时出错交易。
- 优化移动平均线周期的组合,降低假信号。
- 区分多头和空头市场,优化买入和卖出的参数。
- 考虑交易成本,调整快速交易的参数,控制交易频率。
总结
三均线交叉策略整体比较简单直接,通过不同时间周期均线的交叉判定趋势方向,以产生交易信号。该策略易于实现,参数调整灵活,可以捕捉趋势的变化。但也存在移动平均线滞后的问题,以及假信号过多的风险。可以通过添加过滤条件,优化参数组合等方法来改进策略的效果。该策略适合对趋势交叉感兴趣的交易者进行优化应用。
||
Overview
The triple moving average crossover strategy uses the crossover of moving averages over different time periods as trading signals, belonging to trend-following strategies. It uses three moving averages, including short-term, medium-term, and long-term moving averages, to generate trading signals based on their crossovers.
Strategy Logic
Firstly, the strategy calculates the short-term (default 7 days), medium-term (default 25 days), and long-term (default 99 days) moving averages. Then it generates trading signals according to the following rules:
-
When the short-term MA crosses above the medium-term MA, a buy signal is generated.
-
When the short-term MA crosses below the medium-term MA, a sell signal is generated.
-
When the short-term MA crosses above the long-term MA, a fast buy signal is generated.
-
When the short-term MA crosses below the long-term MA, a fast sell signal is generated.
The strategy believes that the short-term MA crossing above the medium-term MA indicates an uptrend, so a buy signal is generated. And the short-term MA crossing below the medium-term MA indicates a downtrend, so a sell signal is generated. Similarly, the crossover between the short-term MA and long-term MA also generates fast trading signals to capture longer-term trend changes.
Advantage Analysis
-
The strategy logic is simple and easy to understand and implement.
-
Using multi-timeframe analysis can effectively capture changes in market trends.
-
The parameters can be optimized by adjusting the MA periods.
-
The visual crossover signals intuitively reflect trend changes.
Risk Analysis
-
MAs have lagging issues and may miss trend reversal points.
-
Too many false signals when the short-term MA crosses above the long-term MA in bull markets.
-
Too many false signals when the short-term MA crosses below the long-term MA in bear markets.
-
Fast trading signals may be too sensitive, increasing trading frequency and commissions.
Proper adjustments of MA periods or adding filter conditions can help optimize and reduce false signals. Shortening fast trading periods may also lower trading frequency.
Optimization Directions
-
Add filter conditions, such as generating signals only when meeting certain trading volumes or price change percentages.
-
Combine with other indicators like MACD, KDJ to avoid erroneous trades when no clear trend.
-
Optimize MA period combinations to reduce false signals.
-
Distinguish bull and bear markets, optimize buy and sell parameters separately.
-
Consider trading costs, adjust fast trading parameters to control frequency.
Summary
The triple MA crossover strategy is relatively simple, judging the trend direction through crossover of different timeframe MAs to generate trading signals. It is easy to implement with flexible parameter adjustments to capture trend changes. But it also has the issues of MA lagging and excessive false signals. Methods like adding filters and optimizing parameter combinations can improve the strategy. It suits traders interested in trend crossovers for optimization and application.
[/trans]
Strategy Arguments
| Argument | Default | Description |
|---|---|---|
| v_input_1 | 7 | Kısa Vade - Gün |
| v_input_2 | 25 | Orta Vade - Gün |
| v_input_3 | 99 | Uzun Vade - Gün |
| v_input_4 | 2020 | Backtest Başlangıç Tarihi |
Source (PineScript)
/*backtest
start: 2023-10-06 00:00:00
end: 2023-11-05 00:00:00
period: 1h
basePeriod: 15m
exchanges: [{"eid":"Futures_Binance","currency":"BTC_USDT"}]
*/

// This source code is subject to the terms of the Mozilla Public License 2.0 at https://mozilla.org/MPL/2.0/
// © dadashkadir

//@version=4
strategy("Üç Hareketli Ortalama Str.", overlay=true, initial_capital=10000, commission_value=0.047, default_qty_type=strategy.percent_of_equity, default_qty_value=100, pyramiding=0, calc_on_order_fills=true)

kisa = input(title = "Kısa Vade - Gün", defval = 7,  minval = 1)
orta = input(title = "Orta Vade - Gün", defval = 25, minval = 1)
uzun = input(title = "Uzun Vade - Gün", defval = 99, minval = 1)

sma7  = sma(close, kisa)
sma25 = sma(close, orta)
sma99  = sma(close, uzun)

alTrend  = plot (sma7, color=#2323F1, linewidth=2, title="Har.Ort. Kısa Vade", transp=0)
satTrend = plot (sma25, color=#FF0C00, linewidth=3, title="Har.Ort. Orta Vade", transp=0)
ort99    = plot (sma99, color=#DFB001, linewidth=3, title="Har.Ort. Uzun Vade", transp=0)

zamanaralik = input (2020, title="Backtest Başlangıç Tarihi")

al  = crossover (sma7, sma25) and zamanaralik <= year
sat = crossover (sma25, sma7) and zamanaralik <= year

hizlial = crossover (sma7, sma99) and zamanaralik <= year
hizlisat = crossover (sma99, sma7) and zamanaralik <= year

alkosul  = sma7 >= sma25
satkosul = sma25 >= sma7

hizlialkosul  = sma7 >= sma99
hizlisatkosul = sma99 >= sma7

plotshape(al,  title = "Buy",  text = 'Al',  style = shape.labelup,   location = location.belowbar, color= color.green, textcolor = color.white, transp = 0, size = size.tiny)
plotshape(sat, title = "Sell", text = 'Sat', style = shape.labeldown, location = location.abovebar, color= color.red,   textcolor = color.white, transp = 0, size = size.tiny)

plotshape(hizlial,  title = "Hızlı Al",  text = 'Hızlı Al',  style = shape.labelup,   location = location.belowbar, color= color.blue, textcolor = color.white, transp = 0, size = size.tiny)
plotshape(hizlisat, title = "Hızlı Sat", text = 'Hızlı Sat', style = shape.labeldown, location = location.abovebar, color= #6106D6 , textcolor = color.white, transp = 0, size = size.tiny)

fill (alTrend, satTrend, color = sma7 >= sma25? #4DFF00 : #FF0C00, transp=80, title="Al-Sat Aralığı")
//fill (ort99, satTrend, color = sma7 >= sma25? #6106D6 : color.blue, transp=80, title="Hızlı Al-Sat Aralığı")

if (al)
    strategy.entry("LONG", strategy.long)
if (sat)
    strategy.entry("SHORT", strategy.short)
//if (hizlial)
//    strategy.entry("My Short Entry Id", strategy.long)
//if (hizlisat)
//    strategy.entry("My Short Entry Id", strategy.short)
Detail
https://www.fmz.com/strategy/431215
Last Modified
2023-11-06 09:48:33