
13 KiB
Name
Stochastic动量突破策略Stochastic-Momentum-Breakout-Strategy
Author
ChaoZhang
Strategy Description
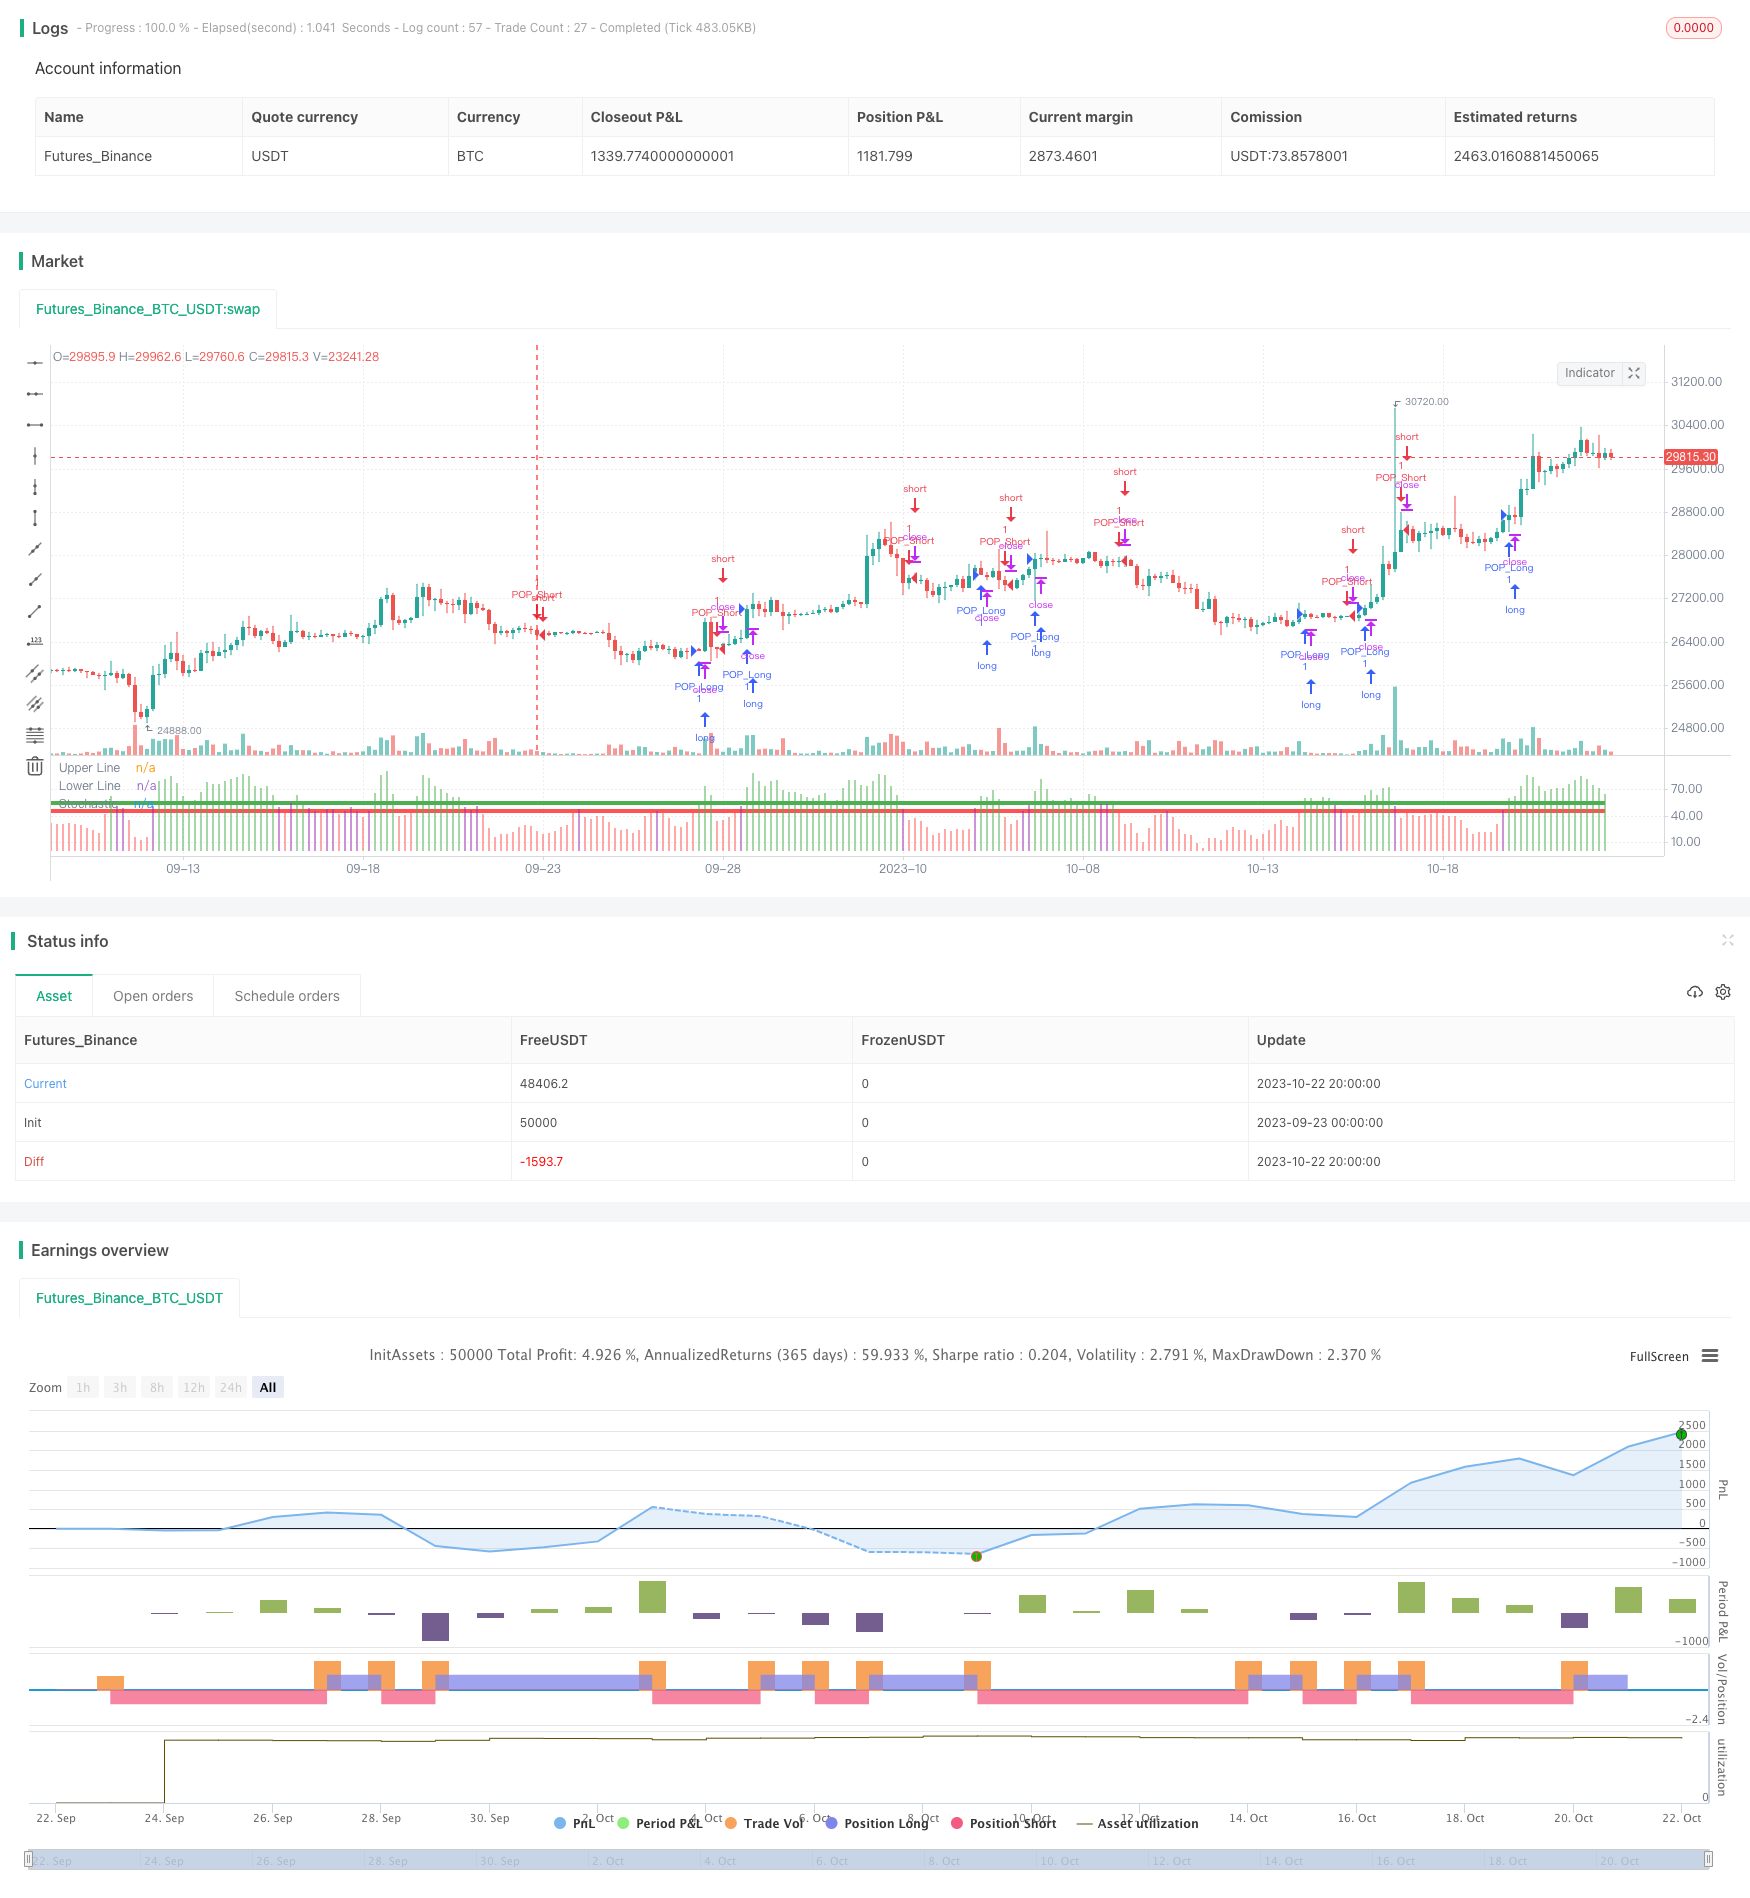
[trans]
概述
动量突破策略主要利用 stochastic oscillator 指标判断市场趋势方向,结合 ADX 指标判断趋势强弱,形成交易信号。该策略主要适用于中长线趋势交易。
策略原理
该策略主要基于两个技术指标:
-
Stochastic oscillator 指标:用于判断市场趋势方向。Stochastic oscillator 的值为 0 到 100,当周期为 14,值在 45 到 55 区间意味着没有明确趋势,Stochastic 在 55 以上为看涨信号,在 45 以下为看跌信号。
-
ADX 指标:用于判断趋势强弱。ADX 在 20 以下表示趋势较弱。
策略首先根据 Stochastic oscillator 的值判断市场目前是否存在明确的上涨或下跌趋势。当 Stochastic 在 55 以上时,认为存在看涨趋势;当 Stochastic 在 45 以下时,认为存在看跌趋势。
然后策略会检测 ADX 是否在 20 以上,如果 ADX 在 20 以上,说明趋势较强,可以进行趋势交易。如果 ADX 在 20 以下,说明趋势不够明显,此时策略不会产生交易信号。
综合 Stochastic oscillator 和 ADX 的判断,当同时满足以下两个条件时,策略会产生买入/卖出信号:
- Stochastic 在 55 以上,表明存在看涨趋势
- ADX 在 20 以上,表明看涨趋势较强
当同时满足以下两个条件时,策略会产生卖出信号:
- Stochastic 在 45 以下,表明存在看跌趋势
- ADX 在 20 以上,表明看跌趋势较强
通过这样的判断规则,该策略形成以趋势为导向的中长线交易策略。
策略优势
该策略具有以下优势:
-
捕捉中长线趋势:结合 Stochastic 和 ADX,能够有效判断市场中长线趋势方向和强度,把握主要趋势。
-
回撤控制:只在趋势明显时交易,可以有效控制无谓的反转交易带来的回撤。
-
参数优化空间:Stochastic 周期和 ADX 周期都可以进行优化,可以针对不同市场调整参数。
-
简单直观:该策略整体逻辑简单清晰,由两个常用技术指标组成,直观易懂。
-
universality:The strategy can be applied to different markets with parameter tuning.
策略风险
该策略也存在一些风险:
-
错过突破点:Stochastic 和 ADX 都属于趋势跟随型指标,可能会错过潜在的趋势转折点,錯过早期的突破交易机会。
-
趋势反转风险:在趋势末期,Stochastic 和 ADX 可能会错误判断趋势仍在继续,而错过及时退出的机会,导致亏损放大。
-
参数优化难度:Stochastic 和 ADX 参数需要针对不同市场进行优化,存在一定难度。
-
whipsaws:在无明确趋势的市场中,该策略可能会产生多次无效交易信号。
-
Divergence:When the price trend conflicts with the Stochastic oscillator trend, divergence emerges, which may lead to losing trades.
可以通过以下方法降低风险:
-
结合其它指标判断局部趋势,发现潜在突破点。
-
增加趋势反转信号,在趋势明显反转时及时退出。
-
通过机器学习等方法自动优化参数。
-
Increase the ADX threshold to filter out weak trend signals in ranging markets.
-
Apply additional indicators to confirm the Stochastic signals and avoid divergence trades.
策略优化方向
该策略可以从以下几个方面进行优化:
-
优化 Stochastic 参数:调整 K 周期、D 周期等参数,优化买卖点定位。
-
优化 ADX 参数:调整 ADX 周期,确定最佳判定趋势强弱的参数。
-
增加趋势反转信号:在 Stochastic 超买超卖区域加大仓位,设置止损。
-
结合其它指标:与 RSI、MACD 等指标结合,确定买卖时机。
-
机器学习:利用机器学习获取最优参数组合。
-
增加止损策略:设定移动止损或转向止损策略,控制单笔亏损。
-
Trailong stop loss: Add trailing stop loss to lock in profits as the trend extends.
-
Money management: Optimize the risk management by adjusting position sizing based on ADX strength.
总结
综上所述,该动量突破策略整体以趋势为导向,利用 Stochastic 判断趋势方向,ADX 判断趋势强度,形成中长线交易策略。策略优势是捕捉趋势,控制回撤,简单直观,缺点是可能错过早期突破点,存在趋势反转风险。我们可以通过调整参数、增加信号、止损等方法来优化该策略,在控制风险的同时获取较好的收益回报。
||
Overview
The Momentum Breakout strategy mainly uses the Stochastic oscillator indicator to determine the market trend direction, combined with the ADX indicator to judge the trend strength, to generate trading signals. This strategy is mainly suitable for medium-to-long term trend trading.
Strategy Logic
The strategy is based on two technical indicators:
-
Stochastic oscillator: used to determine the market trend direction. The Stochastic oscillator value ranges from 0 to 100. A value between 45 and 55 when the period is 14 means no clear trend. A Stochastic above 55 is a bullish signal and below 45 is a bearish signal.
-
ADX indicator: used to judge the trend strength. An ADX below 20 indicates a weak trend.
The strategy first judges if there is a clear uptrend or downtrend based on the Stochastic oscillator value. When the Stochastic is above 55, it signals an uptrend. When it's below 45, it signals a downtrend.
It then checks if the ADX is above 20 to confirm a strong trend. If ADX is above 20, it means the trend is strong enough for trend trading. If ADX is below 20, the trend is considered not obvious and no trading signals will be generated.
By combining the Stochastic oscillator and ADX, trading signals are generated when both of the following conditions are met:
- Stochastic above 55, signaling an uptrend.
- ADX above 20, confirming the uptrend is strong.
Sell signals are generated when both of these conditions are met:
- Stochastic below 45, signaling a downtrend.
- ADX above 20, confirming the downtrend is strong.
With these rules, the strategy forms a medium-to-long term trend following system.
Advantages
The advantages of this strategy include:
-
Catching mid-to-long term trends: By combining Stochastic and ADX, it can effectively determine the market trend direction and strength, catching the major trends.
-
Drawdown control: Only trading when the trend is clear can help control unnecessary whipsaws.
-
Parameter tuning: The periods of Stochastic and ADX can be optimized for different markets.
-
Simplicity: The overall logic is simple and intuitive, consisting of two common technical indicators.
-
Universality: The strategy can be applied to different markets with parameter tuning.
Risks
Some risks of the strategy:
-
Missing breakout points: As trend following indicators, Stochastic and ADX may miss potential trend reversal points and early breakout trades.
-
Trend reversal risks: They may wrongly judge the trend to be continuing near the end of a trend, missing chances to exit timely, leading to amplified losses.
-
Difficulty in parameter optimization: The parameters need to be tuned for different markets, which poses some difficulty.
-
Whipsaws: It may generate multiple invalid signals in range-bound markets without a clear trend.
-
Divergence: When the price trend conflicts with the Stochastic oscillator trend, divergence emerges, which may lead to losing trades.
The risks could be mitigated by:
-
Adding other indicators to identify local trends and potential breakout points.
-
Incorporating trend reversal signals to exit timely when trends substantially reverse.
-
Using machine learning to automatically optimize parameters.
-
Increasing the ADX threshold to filter out weak trend signals in ranging markets.
-
Applying additional indicators to confirm the Stochastic signals and avoid divergence trades.
Improvement Directions
Some ways to improve the strategy:
-
Optimizing Stochastic parameters like the K and D periods to locate turning points accurately.
-
Optimizing the ADX period to determine the best parameters for judging trend strength.
-
Adding trend reversal signals such as increasing position size in Stochastic overbought/oversold zones with stop loss.
-
Combining other indicators like RSI and MACD to refine entry and exit timing.
-
Using machine learning to find the optimal parameter combinations.
-
Implementing stop loss strategies like moving stop loss or reverse stop loss to control single trade loss.
-
Trailong stop loss: Add trailing stop loss to lock in profits as the trend extends.
-
Money management: Optimize the risk management by adjusting position sizing based on ADX strength.
Summary
In summary, this Momentum Breakout strategy is overall a trend-following system, using Stochastic to determine the trend direction and ADX to gauge the strength, forming a medium-to-long term trading strategy. The advantages lie in catching trends and controlling drawdowns with a simple and intuitive logic. The weaknesses are potential missed early breakout trades and trend reversal risks. We can optimize it through methods like parameter tuning, adding signals, implementing stop loss to improve reward/risk while controlling risks.
[/trans]
Strategy Arguments
| Argument | Default | Description |
|---|---|---|
| v_input_1 | 55 | Buy Entry/Exit Line |
| v_input_2 | 45 | Sell Entry/Exit Line |
| v_input_3 | 14 | Stochastic Length - Default 14 |
| v_input_4 | 2 | SMA Length - 3-day (3 by default) simple moving average of stoch |
| v_input_5 | true | Custom Backtesting Dates |
| v_input_6 | 2019 | Backtest Start Year |
| v_input_7 | true | Backtest Start Month |
| v_input_8 | true | Backtest Start Day |
| v_input_9 | false | Backtest Start Hour |
| v_input_10 | 2020 | Backtest Stop Year |
| v_input_11 | true | Backtest Stop Month |
| v_input_12 | 5 | Backtest Stop Day |
| v_input_13 | false | Backtest Stop Hour |
Source (PineScript)
/*backtest
start: 2023-09-23 00:00:00
end: 2023-10-23 00:00:00
period: 4h
basePeriod: 15m
exchanges: [{"eid":"Futures_Binance","currency":"BTC_USDT"}]
*/

//Created by Bitcoinduke
//Original Creator is Jake Bernstein
// Link: https://school.stockcharts.com/doku.php?id=trading_strategies:stochastic_pop_drop
// Tested: XBTUSD 3h | BTCPERP FTX 3h
//@version=4
// strategy(shorttitle="Stochastic Pop and Drop", title="Pop and Drop", overlay=false,
//      calc_on_every_tick=false, pyramiding=0, default_qty_type=strategy.cash,
//      default_qty_value=1000, currency=currency.USD, initial_capital=1000,
//      commission_type=strategy.commission.percent, commission_value=0.075)

upper_threshold_buy = input(55, minval=50, title="Buy Entry/Exit Line")
lower_threshold_sell = input(45, maxval=50, title="Sell Entry/Exit Line")

oscillator_length = input(14, minval=1, title="Stochastic Length - Default 14")
sma_length = input(2, minval=1, title="SMA Length - 3-day (3 by default) simple moving average of stoch")

stoch_oscillator = sma(stoch(close, high, low, oscillator_length), sma_length)

//Upper and Lower Entry Lines
upper_line = upper_threshold_buy
lower_line = lower_threshold_sell

stoch_color = stoch_oscillator >= upper_line ? green : stoch_oscillator <= lower_line ? red : purple

//Charts
plot(stoch_oscillator, title="Stochastic", style=histogram, linewidth=4, color=stoch_color)
upper_threshold = plot(upper_line, title="Upper Line", style=line, linewidth=4, color=green)
lower_threshold = plot(lower_line, title="Lower Line", style=line, linewidth=4, color=red)

// Strategy Logic
LongSignal = stoch_oscillator >= upper_line and not (stoch_oscillator > lower_line and stoch_oscillator < upper_line) ? true : false
ShortSignal = stoch_oscillator <= lower_line and not (stoch_oscillator > lower_line and stoch_oscillator < upper_line) ? true : false

strategy.entry("POP_Short", strategy.short, when=ShortSignal)
strategy.entry("POP_Long", strategy.long, when=LongSignal)

// === Backtesting Dates === thanks to Trost

testPeriodSwitch = input(true, "Custom Backtesting Dates")
testStartYear = input(2019, "Backtest Start Year")
testStartMonth = input(1, "Backtest Start Month")
testStartDay = input(1, "Backtest Start Day")
testStartHour = input(0, "Backtest Start Hour")
testPeriodStart = timestamp(testStartYear, testStartMonth, testStartDay, testStartHour, 0)
testStopYear = input(2020, "Backtest Stop Year")
testStopMonth = input(1, "Backtest Stop Month")
testStopDay = input(5, "Backtest Stop Day")
testStopHour = input(0, "Backtest Stop Hour")
testPeriodStop = timestamp(testStopYear, testStopMonth, testStopDay, testStopHour, 0)
testPeriod() =>
    time >= testPeriodStart and time <= testPeriodStop ? true : false
testPeriod_1 = testPeriod()
isPeriod = testPeriodSwitch == true ? testPeriod_1 : true
// === /END
Detail
https://www.fmz.com/strategy/430060
Last Modified
2023-10-24 16:35:24