
16 KiB
Name
RSI与MACD交叉多周期动态交易策略-RSI-and-MACD-Cross-Period-Dynamic-Trading-Strategy
Author
ianzeng123
Strategy Description
[trans]
概述
RSI与MACD交叉多周期动态交易策略是一种结合相对强弱指数(RSI)和移动平均线收敛散度指标(MACD)的量化交易系统,专为15分钟K线周期设计。该策略通过监控市场的超买超卖状态(RSI)和价格动量趋势(MACD),在两个指标同时满足特定条件时触发交易信号。具体而言,当RSI值低于30(超卖)且MACD快线上穿信号线时,系统生成买入信号;当RSI值高于70(超买)且MACD快线下穿信号线时,系统生成卖出信号。每笔交易均配置有基于百分比的止盈(5%)和止损(2%)机制,有效控制风险回报比在2.5:1的良好水平。
策略原理
该策略的核心是将两个经典技术指标的信号进行逻辑组合,以提高交易决策的可靠性:
-
RSI指标应用:使用默认14周期的RSI来识别市场的超买超卖状态。传统观点认为RSI低于30为超卖(可能反弹),高于70为超买(可能回落)。代码中通过
ta.rsi(close, rsiLength)计算RSI值。 -
MACD指标应用:采用快线周期12,慢线周期26,信号线平滑因子9的标准参数设置。MACD通过
ta.macd(close, macdFast, macdSlow, macdSignal)函数计算,得到MACD线和信号线。关键的交易信号来自MACD线与信号线的交叉,通过ta.crossover和ta.crossunder函数捕捉。 -
组合信号逻辑:
- 多头开仓条件:RSI < 30(超卖)AND MACD快线上穿信号线
- 空头开仓条件:RSI > 70(超买)AND MACD快线下穿信号线
-
资金管理:策略采用账户资金百分比方式进行仓位管理(
default_qty_type=strategy.percent_of_equity, default_qty_value=100),每次交易投入总资金的100%。 -
风险控制:每笔交易均自动设置止盈位(入场价格的±5%)和止损位(入场价格的±2%),通过
strategy.exit函数实现。
策略优势
-
指标协同确认:结合RSI和MACD两个指标,需要双重确认才能发出交易信号,有效减少假突破和虚假信号的发生,提高交易质量。
-
均衡的进出场机制:入场基于技术指标的客观判断,出场基于预设的止盈止损水平,形成完整的交易闭环,减少主观因素干扰。
-
良好的风险回报比:止盈比例(5%)是止损比例(2%)的2.5倍,符合专业交易的风险管理原则,只要胜率超过30%即可实现长期盈利。
-
适应市场节奏:15分钟周期适合日内交易者,既能捕捉短期波动,又不会过度交易,平衡了交易频率和信号质量。
-
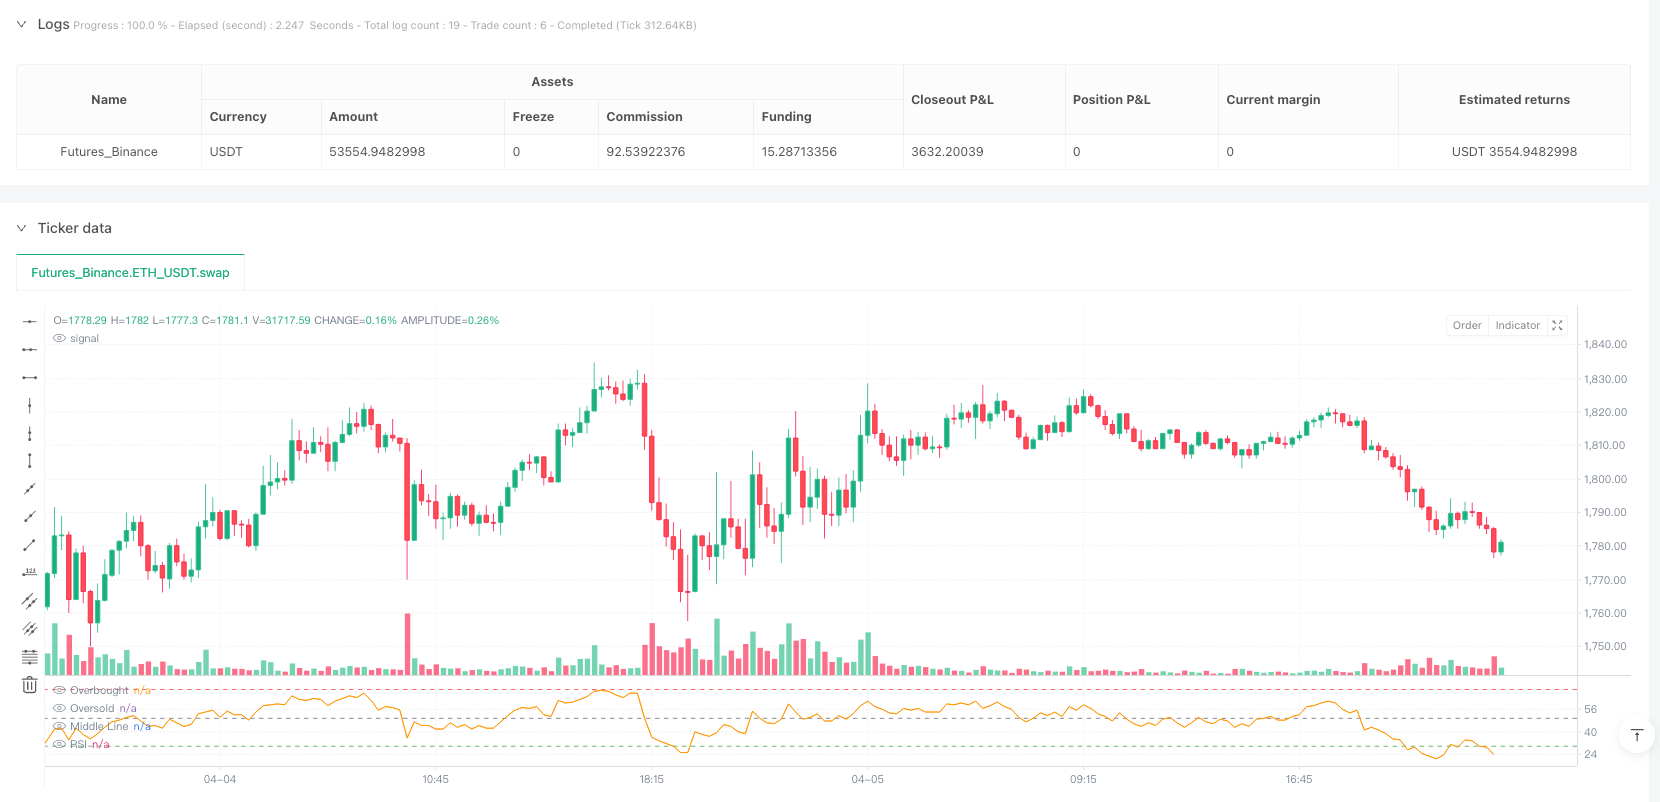
视觉化反馈:策略通过绘制RSI指标线以及超买超卖水平线,为交易者提供直观的视觉参考,便于实时监控市场状态。
策略风险
-
震荡市场风险:在横盘震荡市场中,RSI可能频繁在超买超卖区域徘徊,而MACD也可能产生多次交叉,导致过度交易和连续亏损。解决方法是增加额外的趋势过滤器,如移动平均线或ADX指标。
-
参数敏感性:策略性能对RSI和MACD的参数设置较为敏感,当前使用的是传统默认参数,可能不适用于所有市场环境。建议根据具体交易品种和市场特性进行参数优化。
-
固定止盈止损限制:使用固定百分比的止盈止损可能无法适应不同市场的波动特性。高波动性市场可能导致止损过于频繁,而低波动性市场可能难以达到止盈目标。
-
缺乏交易时间控制:当前策略没有设置交易时间过滤,可能在流动性不佳或异常波动时段产生不利信号。
-
无反手机制:策略中的多空信号独立触发,缺乏有效的反手交易机制,可能导致在强趋势市场中反向持仓面临较大损失。
策略优化方向
-
动态参数调整:可以考虑基于市场波动性(如ATR指标)动态调整RSI的超买超卖阈值和MACD参数,以适应不同市场环境。实现方式如:
atrValue = ta.atr(14) dynamicRsiOversold = 30 - (atrValue / close * 100) dynamicRsiOverbought = 70 + (atrValue / close * 100) -
增加趋势过滤器:引入额外的趋势确认指标,如添加ADX指标,只在ADX>25的情况下(表明市场有明显趋势)才执行交易,避免在震荡市中频繁交易:
adxValue = ta.adx(14) adxFilter = adxValue > 25 longCondition = (rsi < rsiOversold) and macdCrossUp and adxFilter -
优化资金管理:替代固定100%资金比例的方式,可采用基于波动性的仓位管理,波动性越大仓位越小:
positionSize = 100 / (ta.atr(14) / close * 100) -
引入时间过滤:添加交易时间窗口控制,避开市场开盘、收盘和低流动性时段:
timeFilter = (time >= timestamp("00:30:00")) and (time <= timestamp("23:00:00")) -
改进止盈止损机制:采用基于技术水平的止盈止损,如使用前期高低点、支撑阻力位或ATR倍数作为动态止损点,而非固定百分比:
atrValue = ta.atr(14)
dynamicStopLoss = atrValue * 1.5
总结
RSI与MACD交叉多周期动态交易策略是一个结构清晰、逻辑明确的量化交易系统,通过整合超买超卖指标(RSI)和动量趋势指标(MACD)的优势,提供了相对可靠的交易信号。该策略特别适合15分钟周期的短期交易,核心优势在于双指标确认机制和明确的资金风险管理规则。
虽然策略设计合理,但仍存在参数敏感性和市场适应性的挑战。通过引入动态参数调整、趋势过滤器、优化资金管理、时间过滤和改进止盈止损机制等优化措施,可以进一步提升策略的鲁棒性和适应性。
任何量化策略都需要经过全面的历史回测和前向验证,同时结合具体市场条件和交易者风险偏好进行个性化调整。该策略提供了一个良好的量化交易框架,交易者可以在此基础上进行二次开发和优化,以构建更加完善的交易系统。 ||
Overview
The RSI and MACD Cross-Period Dynamic Trading Strategy is a quantitative trading system that combines the Relative Strength Index (RSI) and Moving Average Convergence Divergence (MACD) indicators, specifically designed for 15-minute chart intervals. This strategy monitors market overbought/oversold conditions (RSI) and price momentum trends (MACD), triggering trading signals when both indicators simultaneously meet specific criteria. Specifically, when the RSI value falls below 30 (oversold) and the MACD fast line crosses above the signal line, the system generates a buy signal; when the RSI value rises above 70 (overbought) and the MACD fast line crosses below the signal line, the system generates a sell signal. Each trade is configured with percentage-based take profit (5%) and stop loss (2%) mechanisms, effectively maintaining a favorable risk-reward ratio of 2.5:1.
Strategy Principles
The core of this strategy lies in combining signals from two classic technical indicators to enhance the reliability of trading decisions:
-
RSI Application: Uses the default 14-period RSI to identify market overbought and oversold conditions. The traditional view considers RSI below 30 as oversold (potential bounce) and above 70 as overbought (potential reversal). The code calculates RSI values using
ta.rsi(close, rsiLength). -
MACD Application: Employs standard parameters with a fast period of 12, slow period of 26, and signal smoothing factor of 9. MACD is calculated through the
ta.macd(close, macdFast, macdSlow, macdSignal)function, yielding the MACD line and signal line. Key trading signals derive from crossovers between the MACD line and signal line, captured by theta.crossoverandta.crossunderfunctions. -
Combined Signal Logic:
- Long entry condition: RSI < 30 (oversold) AND MACD fast line crosses above the signal line
- Short entry condition: RSI > 70 (overbought) AND MACD fast line crosses below the signal line
-
Capital Management: The strategy employs account equity percentage for position sizing (
default_qty_type=strategy.percent_of_equity, default_qty_value=100), investing 100% of total funds in each trade. -
Risk Control: Each trade automatically sets take-profit levels (±5% of entry price) and stop-loss levels (±2% of entry price), implemented through the
strategy.exitfunction.
Strategy Advantages
-
Indicator Confirmation Synergy: By combining RSI and MACD indicators, the strategy requires dual confirmation to issue trading signals, effectively reducing false breakouts and misleading signals, thus improving trade quality.
-
Balanced Entry and Exit Mechanism: Entries are based on objective technical indicator assessments, while exits rely on preset take-profit and stop-loss levels, forming a complete trading loop and reducing subjective interference.
-
Favorable Risk-Reward Ratio: The take-profit percentage (5%) is 2.5 times the stop-loss percentage (2%), aligning with professional trading risk management principles—requiring only a win rate above 30% to achieve long-term profitability.
-
Market Rhythm Adaptation: The 15-minute timeframe suits intraday traders, capturing short-term fluctuations without overtrading, balancing trading frequency and signal quality.
-
Visual Feedback: The strategy plots the RSI indicator line and overbought/oversold level lines, providing traders with intuitive visual references for real-time market condition monitoring.
Strategy Risks
-
Consolidation Market Risk: In sideways, choppy markets, RSI may frequently oscillate within overbought and oversold zones, while MACD might produce multiple crossovers, leading to overtrading and consecutive losses. A solution is to add supplementary trend filters such as moving averages or the ADX indicator.
-
Parameter Sensitivity: Strategy performance is sensitive to RSI and MACD parameter settings. The current traditional default parameters may not be suitable for all market environments. Parameter optimization based on specific trading instruments and market characteristics is recommended.
-
Fixed Take-Profit and Stop-Loss Limitations: Using fixed percentage-based take-profit and stop-loss levels may not adapt to different market volatility characteristics. High-volatility markets might trigger stop-losses too frequently, while low-volatility markets might struggle to reach take-profit targets.
-
Lack of Trading Time Control: The current strategy does not incorporate trading time filters, potentially generating unfavorable signals during periods of poor liquidity or abnormal volatility.
-
No Position Reversal Mechanism: Long and short signals in the strategy trigger independently, lacking an effective position reversal mechanism, which may lead to significant losses in counter-position holdings during strong trend markets.
Strategy Optimization Directions
-
Dynamic Parameter Adjustment: Consider dynamically adjusting RSI overbought/oversold thresholds and MACD parameters based on market volatility (such as the ATR indicator) to adapt to different market environments. Implementation example:
atrValue = ta.atr(14) dynamicRsiOversold = 30 - (atrValue / close * 100) dynamicRsiOverbought = 70 + (atrValue / close * 100) -
Add Trend Filters: Introduce additional trend confirmation indicators, such as adding the ADX indicator to execute trades only when ADX > 25 (indicating a significant market trend), avoiding frequent trading in oscillating markets:
adxValue = ta.adx(14) adxFilter = adxValue > 25 longCondition = (rsi < rsiOversold) and macdCrossUp and adxFilter -
Optimize Capital Management: Instead of a fixed 100% equity ratio, adopt volatility-based position sizing where position size decreases as volatility increases:
positionSize = 100 / (ta.atr(14) / close * 100) -
Implement Time Filtering: Add trading time window controls to avoid market opening, closing, and low-liquidity periods:
timeFilter = (time >= timestamp("00:30:00")) and (time <= timestamp("23:00:00")) -
Improve Take-Profit and Stop-Loss Mechanisms: Adopt technically-based exit points such as previous highs/lows, support/resistance levels, or ATR multiples as dynamic stop points, rather than fixed percentages:
atrValue = ta.atr(14)
dynamicStopLoss = atrValue * 1.5
Summary
The RSI and MACD Cross-Period Dynamic Trading Strategy is a clearly structured, logically defined quantitative trading system that integrates the strengths of overbought/oversold indicators (RSI) and momentum trend indicators (MACD) to provide relatively reliable trading signals. This strategy is particularly suitable for short-term trading on 15-minute timeframes, with core advantages in its dual-indicator confirmation mechanism and explicit capital risk management rules.
While the strategy design is reasonable, challenges remain in parameter sensitivity and market adaptability. By introducing dynamic parameter adjustments, trend filters, optimized capital management, time filtering, and improved take-profit and stop-loss mechanisms, the strategy's robustness and adaptability can be further enhanced.
Any quantitative strategy requires comprehensive historical backtesting and forward validation, alongside customization to specific market conditions and trader risk preferences. This strategy provides an excellent quantitative trading framework upon which traders can build through secondary development and optimization to construct more refined trading systems.[/trans]
Source (PineScript)
/*backtest
start: 2025-03-07 00:00:00
end: 2025-04-06 00:00:00
period: 15m
basePeriod: 15m
exchanges: [{"eid":"Futures_Binance","currency":"ETH_USDT"}]
*/

// This Pine Script® code is subject to the terms of the Mozilla Public License 2.0 at https://mozilla.org/MPL/2.0/
// © ErayPala

//@version=6
strategy("RSI + MACD Strategy (15min)", overlay=false, default_qty_type=strategy.percent_of_equity, default_qty_value=100)

// === INPUTS ===
rsiLength = input.int(14, title="RSI Length")
rsiOverbought = input.int(70, title="RSI Overbought Level")
rsiOversold = input.int(30, title="RSI Oversold Level")

macdFast = input.int(12, title="MACD Fast Length")
macdSlow = input.int(26, title="MACD Slow Length")
macdSignal = input.int(9, title="MACD Signal Smoothing")

takeProfitPerc = input.float(5.0, title="Take Profit (%)") / 100
stopLossPerc = input.float(2.0, title="Stop Loss (%)") / 100

// === INDICATORS ===
rsi = ta.rsi(close, rsiLength)
[macdLine, signalLine, _] = ta.macd(close, macdFast, macdSlow, macdSignal)
macdCrossUp = ta.crossover(macdLine, signalLine)
macdCrossDown = ta.crossunder(macdLine, signalLine)

// === ENTRY CONDITIONS ===
longCondition = (rsi < rsiOversold) and macdCrossUp
shortCondition = (rsi > rsiOverbought) and macdCrossDown

// === STRATEGY ENTRIES ===
if (longCondition)
    strategy.entry("Long", strategy.long)
    strategy.exit("TP/SL Long", from_entry="Long", limit=close * (1 + takeProfitPerc), stop=close * (1 - stopLossPerc))

if (shortCondition)
    strategy.entry("Short", strategy.short)
    strategy.exit("TP/SL Short", from_entry="Short", limit=close * (1 - takeProfitPerc), stop=close * (1 + stopLossPerc))

// === PLOT INDICATORS FOR VISUAL FEEDBACK ===
plot(rsi, title="RSI", color=color.orange)
hline(rsiOverbought, "Overbought", color=color.red)
hline(rsiOversold, "Oversold", color=color.green)
hline(50, "Middle Line", color=color.gray)
Detail
https://www.fmz.com/strategy/489658
Last Modified
2025-04-07 13:50:10