
6.9 KiB
Name
Multi-EMA趋势追踪型RSI-MACD动量验证策略-Multi-EMA-Trend-Following-Strategy-with-RSI-MACD-Momentum-Validation
Author
ChaoZhang
Strategy Description
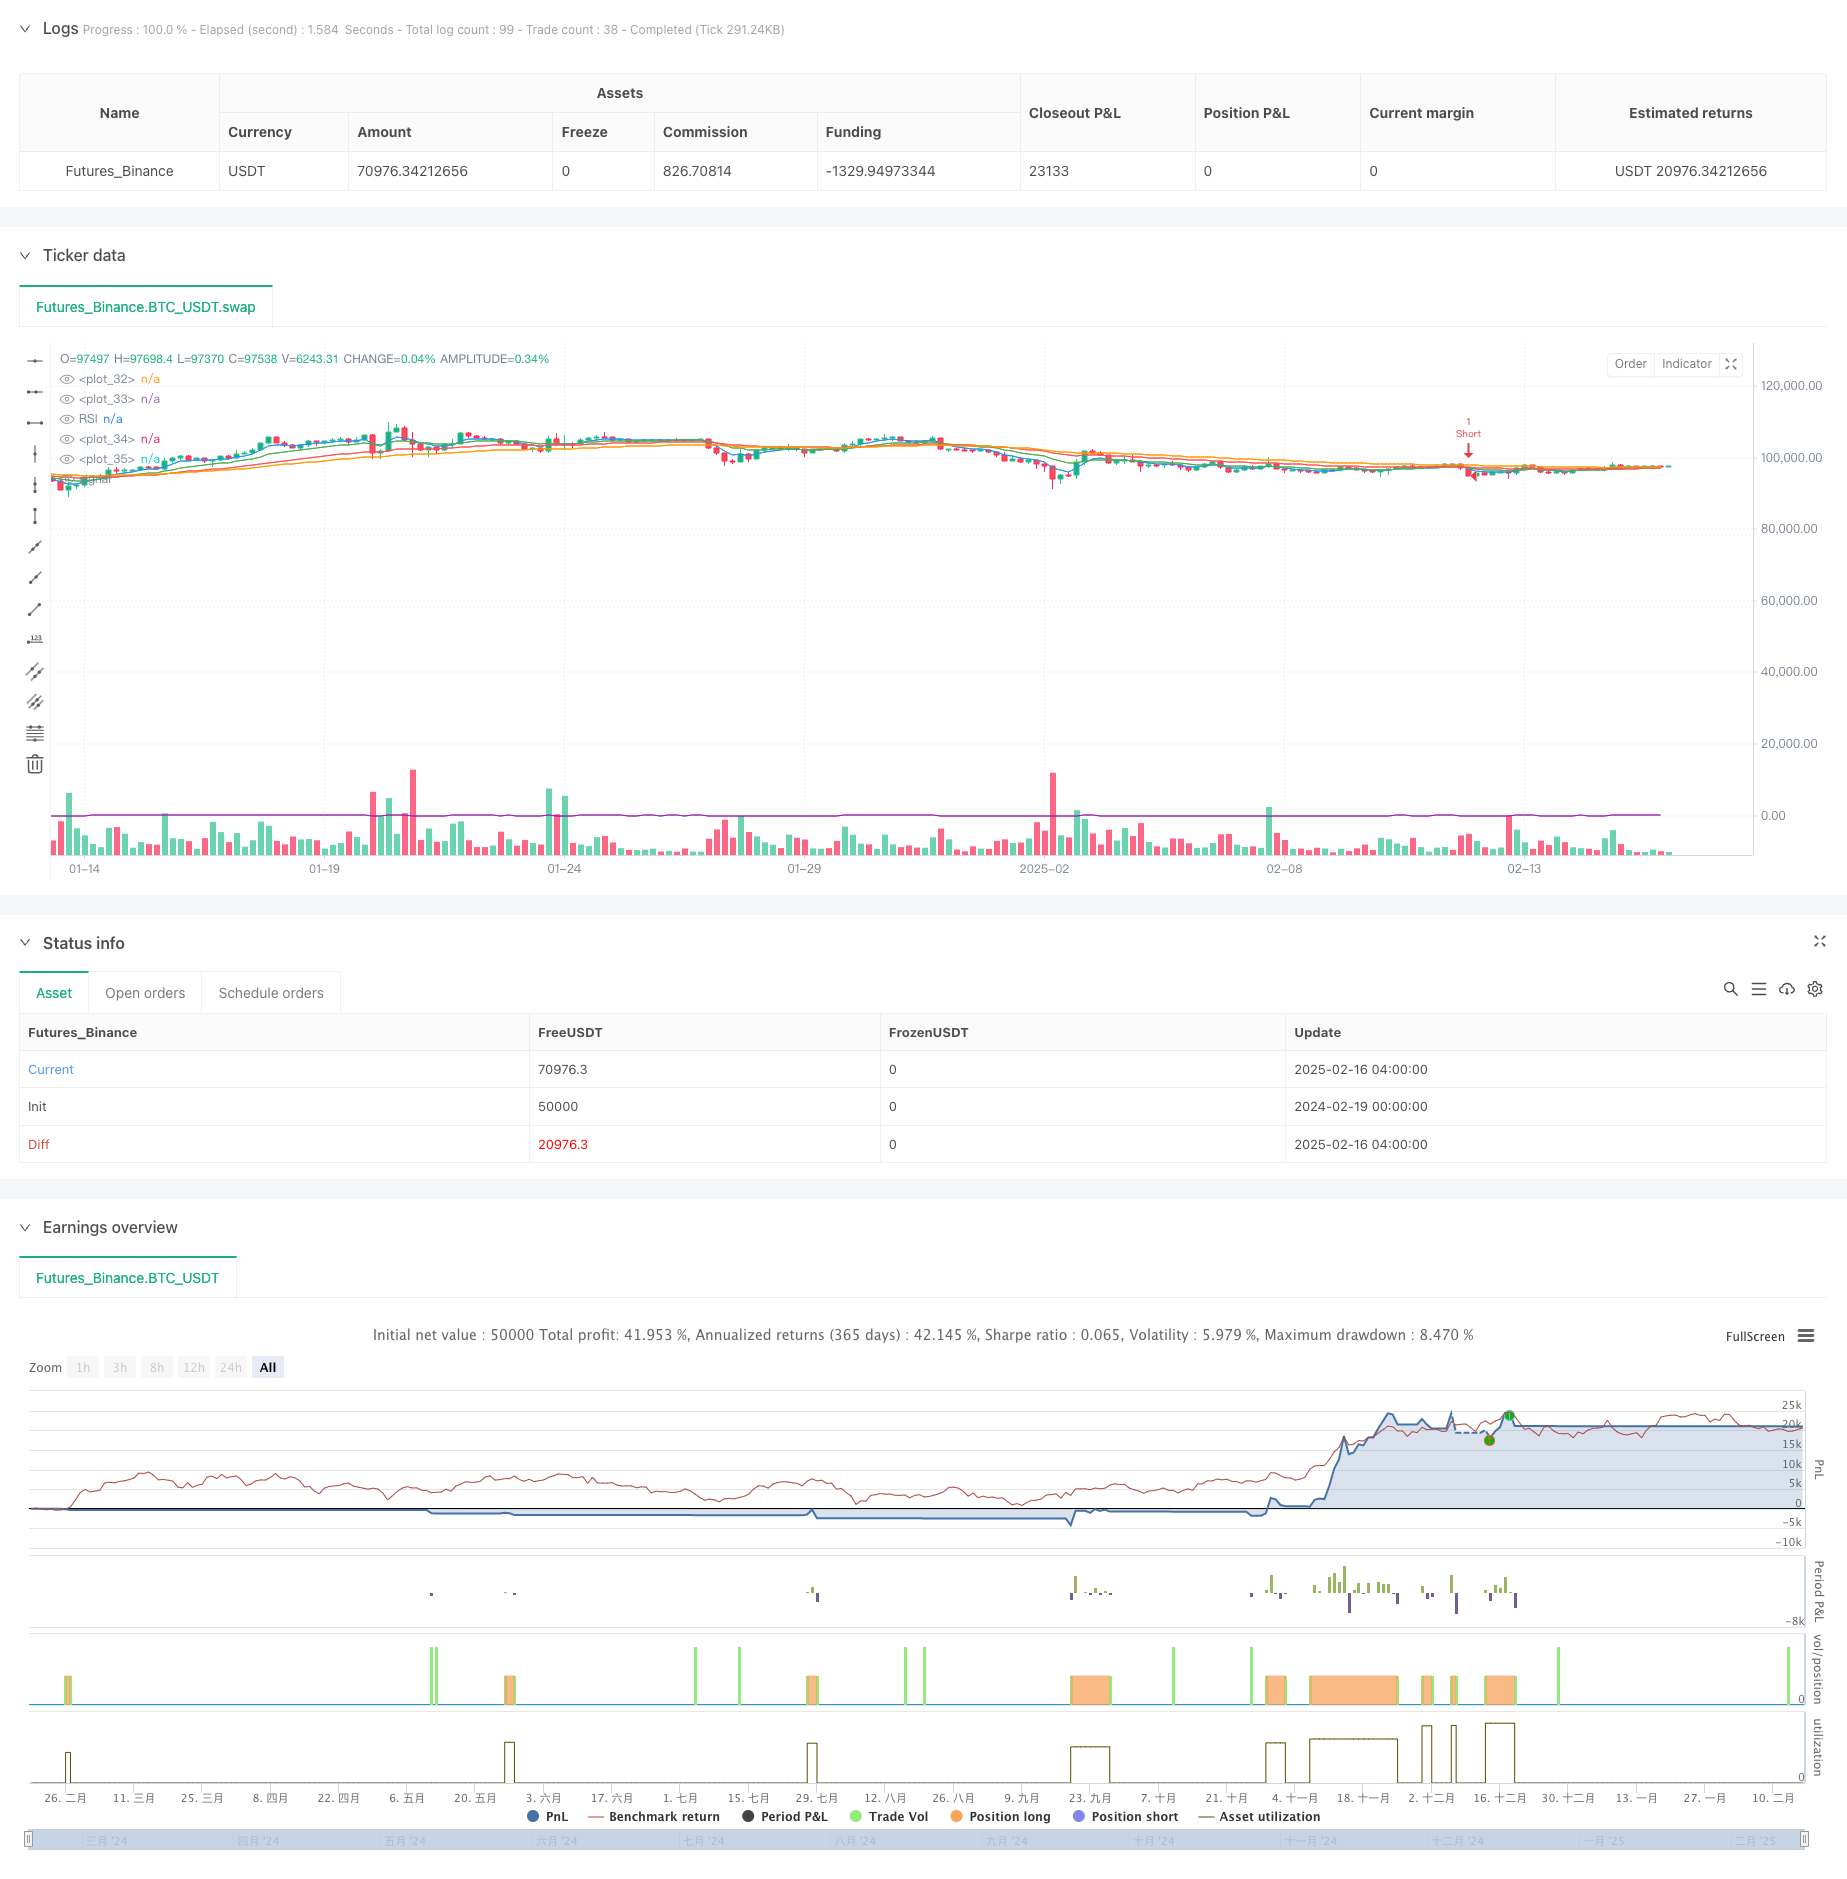
[trans]
概述
该策略是一个基于多周期指数移动平均线(EMA)、相对强弱指标(RSI)和移动平均线趋同散度指标(MACD)的趋势跟踪交易系统。策略通过多重EMA的排列形态识别市场趋势,并结合RSI和MACD的动量确认来优化入场时机,同时使用基于EMA的止损和获利方法来管理风险和收益。
策略原理
策略使用5、14、34和55周期的EMA形成的"EMA瀑布"形态来判断趋势方向。在上升趋势中,要求EMA5>EMA14>EMA34>EMA55;在下降趋势中则相反。当MACD线穿越零轴且RSI位于50以上(多头)或50以下(空头)时,触发交易信号。止损设置在34周期EMA处,获利目标为止损位的3倍。
策略优势
- 多重技术指标的结合提供了更可靠的交易信号,降低了假突破的风险
- EMA瀑布形态能够有效识别强势趋势,避免在盘整市场中频繁交易
- RSI和MACD的动量确认机制可以过滤掉趋势较弱的交易机会
- 基于EMA的动态止损方法既保护了利润又给予趋势充分发展空间
- 较大的盈亏比设置(3:1)有助于获得良好的长期收益表现
策略风险
- 在剧烈波动的市场中,多重EMA的滞后性可能导致入场或出场延迟
- 对趋势市场依赖性强,在震荡市场中可能产生连续亏损
- MACD零轴交叉可能出现假信号,特别是在市场波动较大时
- 3倍止损的获利目标在某些市场环境下可能过于激进
- 多个技术指标的组合可能导致交易机会减少,影响策略的频率
策略优化方向
- 考虑引入波动率指标(如ATR)来动态调整止损和获利目标
- 可以增加成交量指标来验证趋势的有效性
- 针对不同市场状态动态调整EMA周期参数
- 在震荡市场中可以考虑降低盈亏比要求
- 增加市场环境过滤机制,在非趋势市场暂停交易
总结
这是一个设计合理的趋势跟踪策略,通过多重技术指标的配合既确保了交易的可靠性,又实现了风险的有效控制。虽然策略在震荡市场中表现可能欠佳,但通过建议的优化方向可以进一步提升其适应性和稳定性。在实盘交易中,建议先进行充分的回测和参数优化,并根据具体市场特征进行针对性调整。 ||
Overview
This strategy is a trend-following trading system based on multiple Exponential Moving Averages (EMA), Relative Strength Index (RSI), and Moving Average Convergence Divergence (MACD). It identifies market trends through multiple EMA alignments, validates entry timing with RSI and MACD momentum confirmation, and manages risk and profit using EMA-based stop-loss and take-profit methods.
Strategy Principles
The strategy employs an "EMA Cascade" formation using 5, 14, 34, and 55-period EMAs to determine trend direction. For uptrends, it requires EMA5>EMA14>EMA34>EMA55; the opposite for downtrends. Trade signals are triggered when the MACD line crosses the zero line and RSI is above 50 (for longs) or below 50 (for shorts). Stop-loss is set at the 34-period EMA, with a take-profit target at 3 times the stop-loss distance.
Strategy Advantages
- The combination of multiple technical indicators provides more reliable trading signals, reducing false breakout risks
- EMA cascade formation effectively identifies strong trends, avoiding frequent trading in ranging markets
- RSI and MACD momentum confirmation mechanisms filter out weak trend opportunities
- EMA-based dynamic stop-loss method both protects profits and allows trends to develop fully
- Higher risk-reward ratio (3:1) contributes to favorable long-term performance
Strategy Risks
- In highly volatile markets, multiple EMAs' lag may cause delayed entries or exits
- Strong dependence on trending markets may lead to consecutive losses in ranging conditions
- MACD zero-line crossovers can generate false signals, especially in high volatility periods
- The 3x stop-loss take-profit target might be too aggressive in certain market conditions
- Multiple indicator combinations may reduce trading opportunities, affecting strategy frequency
Optimization Directions
- Consider incorporating volatility indicators (like ATR) for dynamic stop-loss and take-profit adjustments
- Add volume indicators to validate trend effectiveness
- Dynamically adjust EMA periods based on different market conditions
- Consider reducing risk-reward requirements in ranging markets
- Implement market environment filters to pause trading in non-trending conditions
Summary
This is a well-designed trend-following strategy that ensures trading reliability and effective risk control through multiple technical indicators' coordination. While the strategy may underperform in ranging markets, its performance and stability can be further enhanced through the suggested optimizations. For live trading, it's recommended to conduct thorough backtesting and parameter optimization, with specific adjustments based on market characteristics.[/trans]
Source (PineScript)
/*backtest
start: 2024-02-19 00:00:00
end: 2025-02-16 08:00:00
period: 4h
basePeriod: 4h
exchanges: [{"eid":"Futures_Binance","currency":"BTC_USDT"}]
*/

//@version=5
strategy("EMA + MACD + RSI Strategy", overlay=true)

// Parametreler
length5 = 5
length14 = 14
length34 = 34
length55 = 55
rsiLength = 14
macdShort = 12
macdLong = 26
macdSignal = 9

// EMA Hesaplamaları
ema5 = ta.ema(close, length5)
ema14 = ta.ema(close, length14)
ema34 = ta.ema(close, length34)
ema55 = ta.ema(close, length55)

// RSI Hesaplaması
rsi = ta.rsi(close, rsiLength)

// MACD Hesaplaması
[macdLine, signalLine, _] = ta.macd(close, macdShort, macdLong, macdSignal)
macdZeroCross = ta.crossover(macdLine, 0) or ta.crossunder(macdLine, 0)

// Alış ve Satış Koşulları
longCondition = ema5 > ema14 and ema14 > ema34 and ema34 > ema55 and macdZeroCross and rsi > 50
shortCondition = ema5 < ema14 and ema14 < ema34 and ema34 < ema55 and macdZeroCross and rsi < 50

// Plotlar
plot(ema5, color=color.blue, linewidth=1)
plot(ema14, color=color.green, linewidth=1)
plot(ema34, color=color.red, linewidth=1)
plot(ema55, color=color.orange, linewidth=1)
plot(rsi, title="RSI", color=color.purple, linewidth=1, style=plot.style_line)

// Alış ve Satış Sinyalleri
if (longCondition)
    strategy.entry("Long", strategy.long)

if (shortCondition)
    strategy.entry("Short", strategy.short)

// Stop-loss ve Take-profit hesaplamaları
stopLoss = ema34
takeProfit = stopLoss * 3

// Stop-loss ve Take-profit Stratejisi
strategy.exit("Exit Long", from_entry="Long", stop=stopLoss, limit=takeProfit)
strategy.exit("Exit Short", from_entry="Short", stop=stopLoss, limit=takeProfit)
Detail
https://www.fmz.com/strategy/482458
Last Modified
2025-02-18 15:13:25