
10 KiB
Name
Bollinger-Bands-布林带策略精准交易实现最大收益-Bollinger-Bands-Strategy-Precision-Trading-for-Maximum-Gains
Author
ChaoZhang
Strategy Description
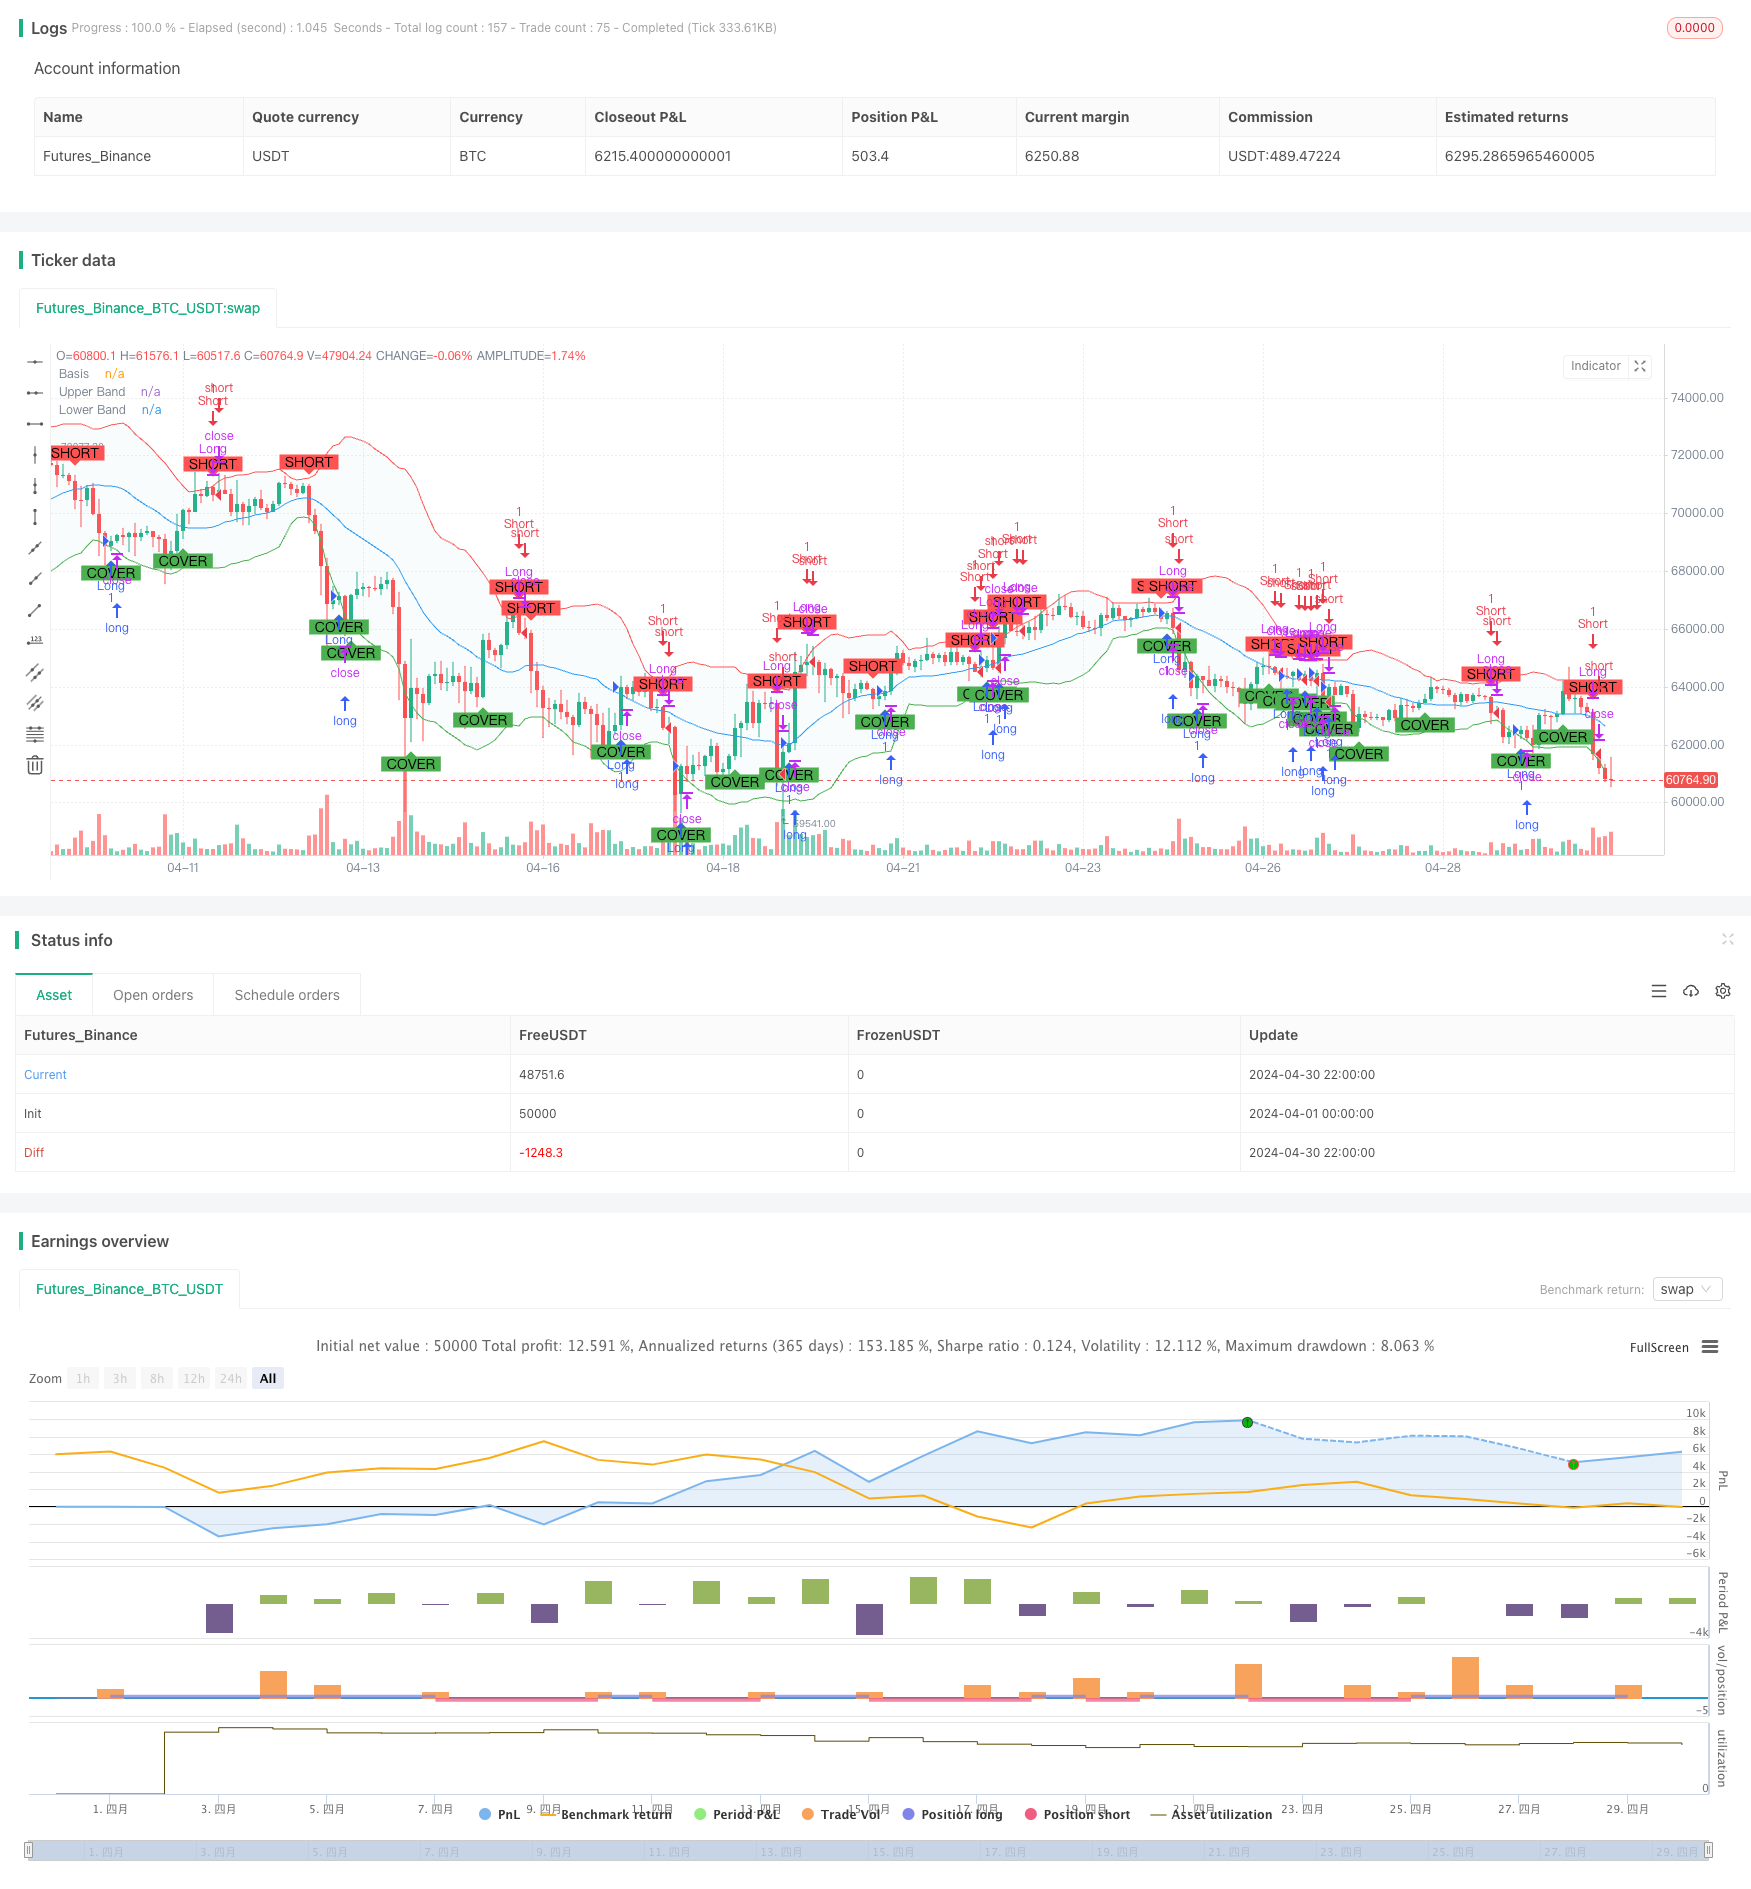
[trans]
概述
该策略基于布林带指标,通过分析价格相对于上轨、下轨和中轨的运动,识别最佳的买卖机会。策略同时管理多头和空头仓位,允许从各种市场方向中获利。策略参数可定制,以适应不同的风险承受能力和市场方法。策略提供清晰的图表指标和实时的买卖信号提醒。
策略原理
- 当价格上穿下轨或中轨时,生成买入信号,表明可能出现上涨趋势。
- 当价格下穿上轨或中轨时,触发卖出信号,预示可能出现下跌趋势。
- 当价格下穿上轨或中轨时,启动做空信号,允许从下跌的市场中获利。
- 当价格上穿下轨或中轨时,激活平仓信号,提示平掉空头仓位以锁定利润或降低损失。
策略优势
- 基于可靠的技术分析原则,经过严格测试,确保可靠性和有效性。
- 易于在TradingView上实现和定制,适合各种经验水平的交易者。
- 持续提供支持和更新,以适应不断变化的市场条件,保持策略的最佳表现。
- 提供动态的入场和出场点,通过分析相对于布林带上轨、下轨和中轨的价格变动,确保在最有利的时刻进出交易。
- 集成多头和空头仓位管理,无论市场趋势如何,都能从各个方向获利。
策略风险
- 在震荡市场条件下,频繁的交易信号可能导致过度交易和潜在的亏损。
- 策略依赖于历史数据和统计分析,可能无法完全捕捉市场的非理性行为和黑天鹅事件。
- 参数选择不当可能导致策略表现不佳。需要仔细优化和回测参数,以适应特定的市场和交易风格。
- 没有单一策略能在所有市场条件下都表现出色。布林带策略可能在某些情况下表现不佳,因此建议将其与其他指标和风险管理技术相结合。
策略优化方向
- 加入更多指标的组合逻辑来标识更可靠的交易信号,例如RSI、MACD等。这有助于过滤噪音并减少误报。
- 考虑引入自适应波动性计算,根据市场状况动态调整布林带的宽度。这可以更好地捕捉不同波动率环境下的机会。
- 实施基于ATR或百分比的止损和止盈机制,以更好地管理风险和保护利润。这有助于限制潜在损失并锁定已实现收益。
- 探索基于市场周期或波动率状态的动态仓位调整。根据不同的市场情景分配资本,可以优化风险调整后的收益。
总结
该布林带策略提供了一个强大的框架,用于基于价格相对于布林带的运动生成精确的交易信号。通过集成多头和空头仓位管理,定制参数以及直观的视觉和提醒功能,该策略使交易者能够在各种市场条件下自信地把握机会。尽管该策略表现出色,但仍有优化空间,如纳入额外指标、动态波动率计算、强大的风险管理技术以及基于市场状态的自适应仓位调整。通过不断改进和调整,该布林带策略可以成为任何交易者工具箱中的宝贵补充,帮助他们在动态市场中导航并最大限度地提高收益。
||
Overview
This strategy is based on the Bollinger Bands indicator and identifies optimal buy and sell opportunities by analyzing price movements relative to the upper, lower, and middle Bollinger Bands. The strategy intelligently manages both long and short positions, allowing for profiting from all market directions. Strategy parameters are customizable to accommodate different risk tolerances and market approaches. The strategy provides clear visual indicators on charts and real-time alerts for buy and sell signals.
Strategy Principles
- Buy signals are generated when the price crosses above the lower Bollinger Band or the middle band, indicating a potential upward trend.
- Sell signals are triggered when the price crosses below the upper Bollinger Band or the middle band, signaling a possible downward trend.
- Short signals are initiated when the price crosses below the upper Bollinger Band or the middle band, allowing for capitalizing on declining markets.
- Cover signals are activated when the price crosses above the lower Bollinger Band or the middle band, prompting the closing of short positions to secure profits or minimize losses.
Strategy Advantages
- Built on solid technical analysis principles, rigorously tested to ensure reliability and effectiveness.
- Easy to implement and customize on TradingView, suitable for traders of all experience levels.
- Ongoing support and updates provided to adapt to evolving market conditions and maintain optimal strategy performance.
- Dynamic entry and exit points ensure entering and exiting trades at the most advantageous moments by analyzing price movements relative to the Bollinger Bands.
- Integrated long and short position management allows for profiting from all market directions.
Strategy Risks
- In choppy market conditions, frequent trading signals may lead to overtrading and potential losses.
- The strategy relies on historical data and statistical analysis, potentially missing irrational market behavior and black swan events.
- Improper parameter selection may result in suboptimal strategy performance. Careful optimization and backtesting of parameters are necessary to suit specific markets and trading styles.
- No single strategy excels in all market conditions. The Bollinger Bands strategy may underperform in certain scenarios, so combining it with other indicators and risk management techniques is recommended.
Strategy Optimization Directions
- Incorporate additional indicators for combination logic to identify more reliable trading signals, such as RSI, MACD, etc. This helps filter out noise and reduce false positives.
- Consider introducing adaptive volatility calculation to dynamically adjust the width of the Bollinger Bands based on market conditions. This can better capture opportunities in different volatility environments.
- Implement ATR-based or percentage-based stop-loss and take-profit mechanisms to better manage risk and protect profits. This helps limit potential losses and lock in realized gains.
- Explore dynamic position sizing based on market cycles or volatility states. Allocating capital according to different market scenarios can optimize risk-adjusted returns.
Summary
The Bollinger Bands strategy provides a robust framework for generating precise trading signals based on price movements relative to the Bollinger Bands. By integrating long and short position management, customizable parameters, and intuitive visual and alert features, the strategy empowers traders to confidently seize opportunities across various market conditions. While the strategy performs well, there is room for optimization, such as incorporating additional indicators, dynamic volatility calculations, robust risk management techniques, and adaptive position sizing based on market states. With continuous refinement and adjustment, the Bollinger Bands strategy can be a valuable addition to any trader's toolbox, helping them navigate dynamic markets and maximize returns. [/trans]
Source (PineScript)
/*backtest
start: 2024-04-01 00:00:00
end: 2024-04-30 23:59:59
period: 2h
basePeriod: 15m
exchanges: [{"eid":"Futures_Binance","currency":"BTC_USDT"}]
*/

//@version=5
strategy("Bollinger Bands Strategy with Long and Short", overlay=true)

// Bollinger Bands settings
length = input.int(20, title="BB Length")
src = input(close, title="Source")
mult = input.float(2.0, title="BB Multiplier")

// Calculate Bollinger Bands
basis = ta.sma(src, length)
dev = mult * ta.stdev(src, length)
upper = basis + dev
lower = basis - dev

// Plot Bollinger Bands
plot(basis, color=color.blue, linewidth=1, title="Basis")
p1 = plot(upper, color=color.red, linewidth=1, title="Upper Band")
p2 = plot(lower, color=color.green, linewidth=1, title="Lower Band")
fill(p1, p2, color=color.rgb(173, 216, 230, 90))

// Long Buy and Sell conditions
buyConditionLower = ta.crossover(src, lower)
sellConditionUpper = ta.crossunder(src, upper)
buyConditionBasis = ta.crossover(src, basis)
sellConditionBasis = ta.crossunder(src, basis)

// Combine long conditions
buyCondition = buyConditionLower or buyConditionBasis
sellCondition = sellConditionUpper or sellConditionBasis

// Short Sell and Buy conditions
shortConditionUpper = ta.crossunder(src, upper)
coverConditionLower = ta.crossover(src, lower)
shortConditionBasis = ta.crossunder(src, basis)
coverConditionBasis = ta.crossover(src, basis)

// Combine short conditions
shortCondition = shortConditionUpper or shortConditionBasis
coverCondition = coverConditionLower or coverConditionBasis

// Execute strategy orders for long
if (buyCondition)
    strategy.entry("Long", strategy.long)
if (sellCondition)
    strategy.close("Long")

// Execute strategy orders for short
if (shortCondition)
    strategy.entry("Short", strategy.short)
if (coverCondition)
    strategy.close("Short")

// Plot Buy and Sell signals for long
plotshape(series=buyCondition, location=location.belowbar, color=color.green, style=shape.labelup, text="BUY", title="Buy Signal")
plotshape(series=sellCondition, location=location.abovebar, color=color.red, style=shape.labeldown, text="SELL", title="Sell Signal")

// Plot Sell and Cover signals for short
plotshape(series=shortCondition, location=location.abovebar, color=color.red, style=shape.labeldown, text="SHORT", title="Short Signal")
plotshape(series=coverCondition, location=location.belowbar, color=color.green, style=shape.labelup, text="COVER", title="Cover Signal")

// Alert conditions for long
alertcondition(buyCondition, title="Buy Alert", message="Price crossed above the lower Bollinger Band or Basis")
alertcondition(sellCondition, title="Sell Alert", message="Price crossed below the upper Bollinger Band or Basis")

// Alert conditions for short
alertcondition(shortCondition, title="Short Alert", message="Price crossed below the upper Bollinger Band or Basis")
alertcondition(coverCondition, title="Cover Alert", message="Price crossed above the lower Bollinger Band or Basis")
Detail
https://www.fmz.com/strategy/451700
Last Modified
2024-05-17 10:32:01