
11 KiB
Name
改进型多指标动量交易策略-Enhanced-Multi-Indicator-Momentum-Trading-Strategy
Author
ChaoZhang
Strategy Description
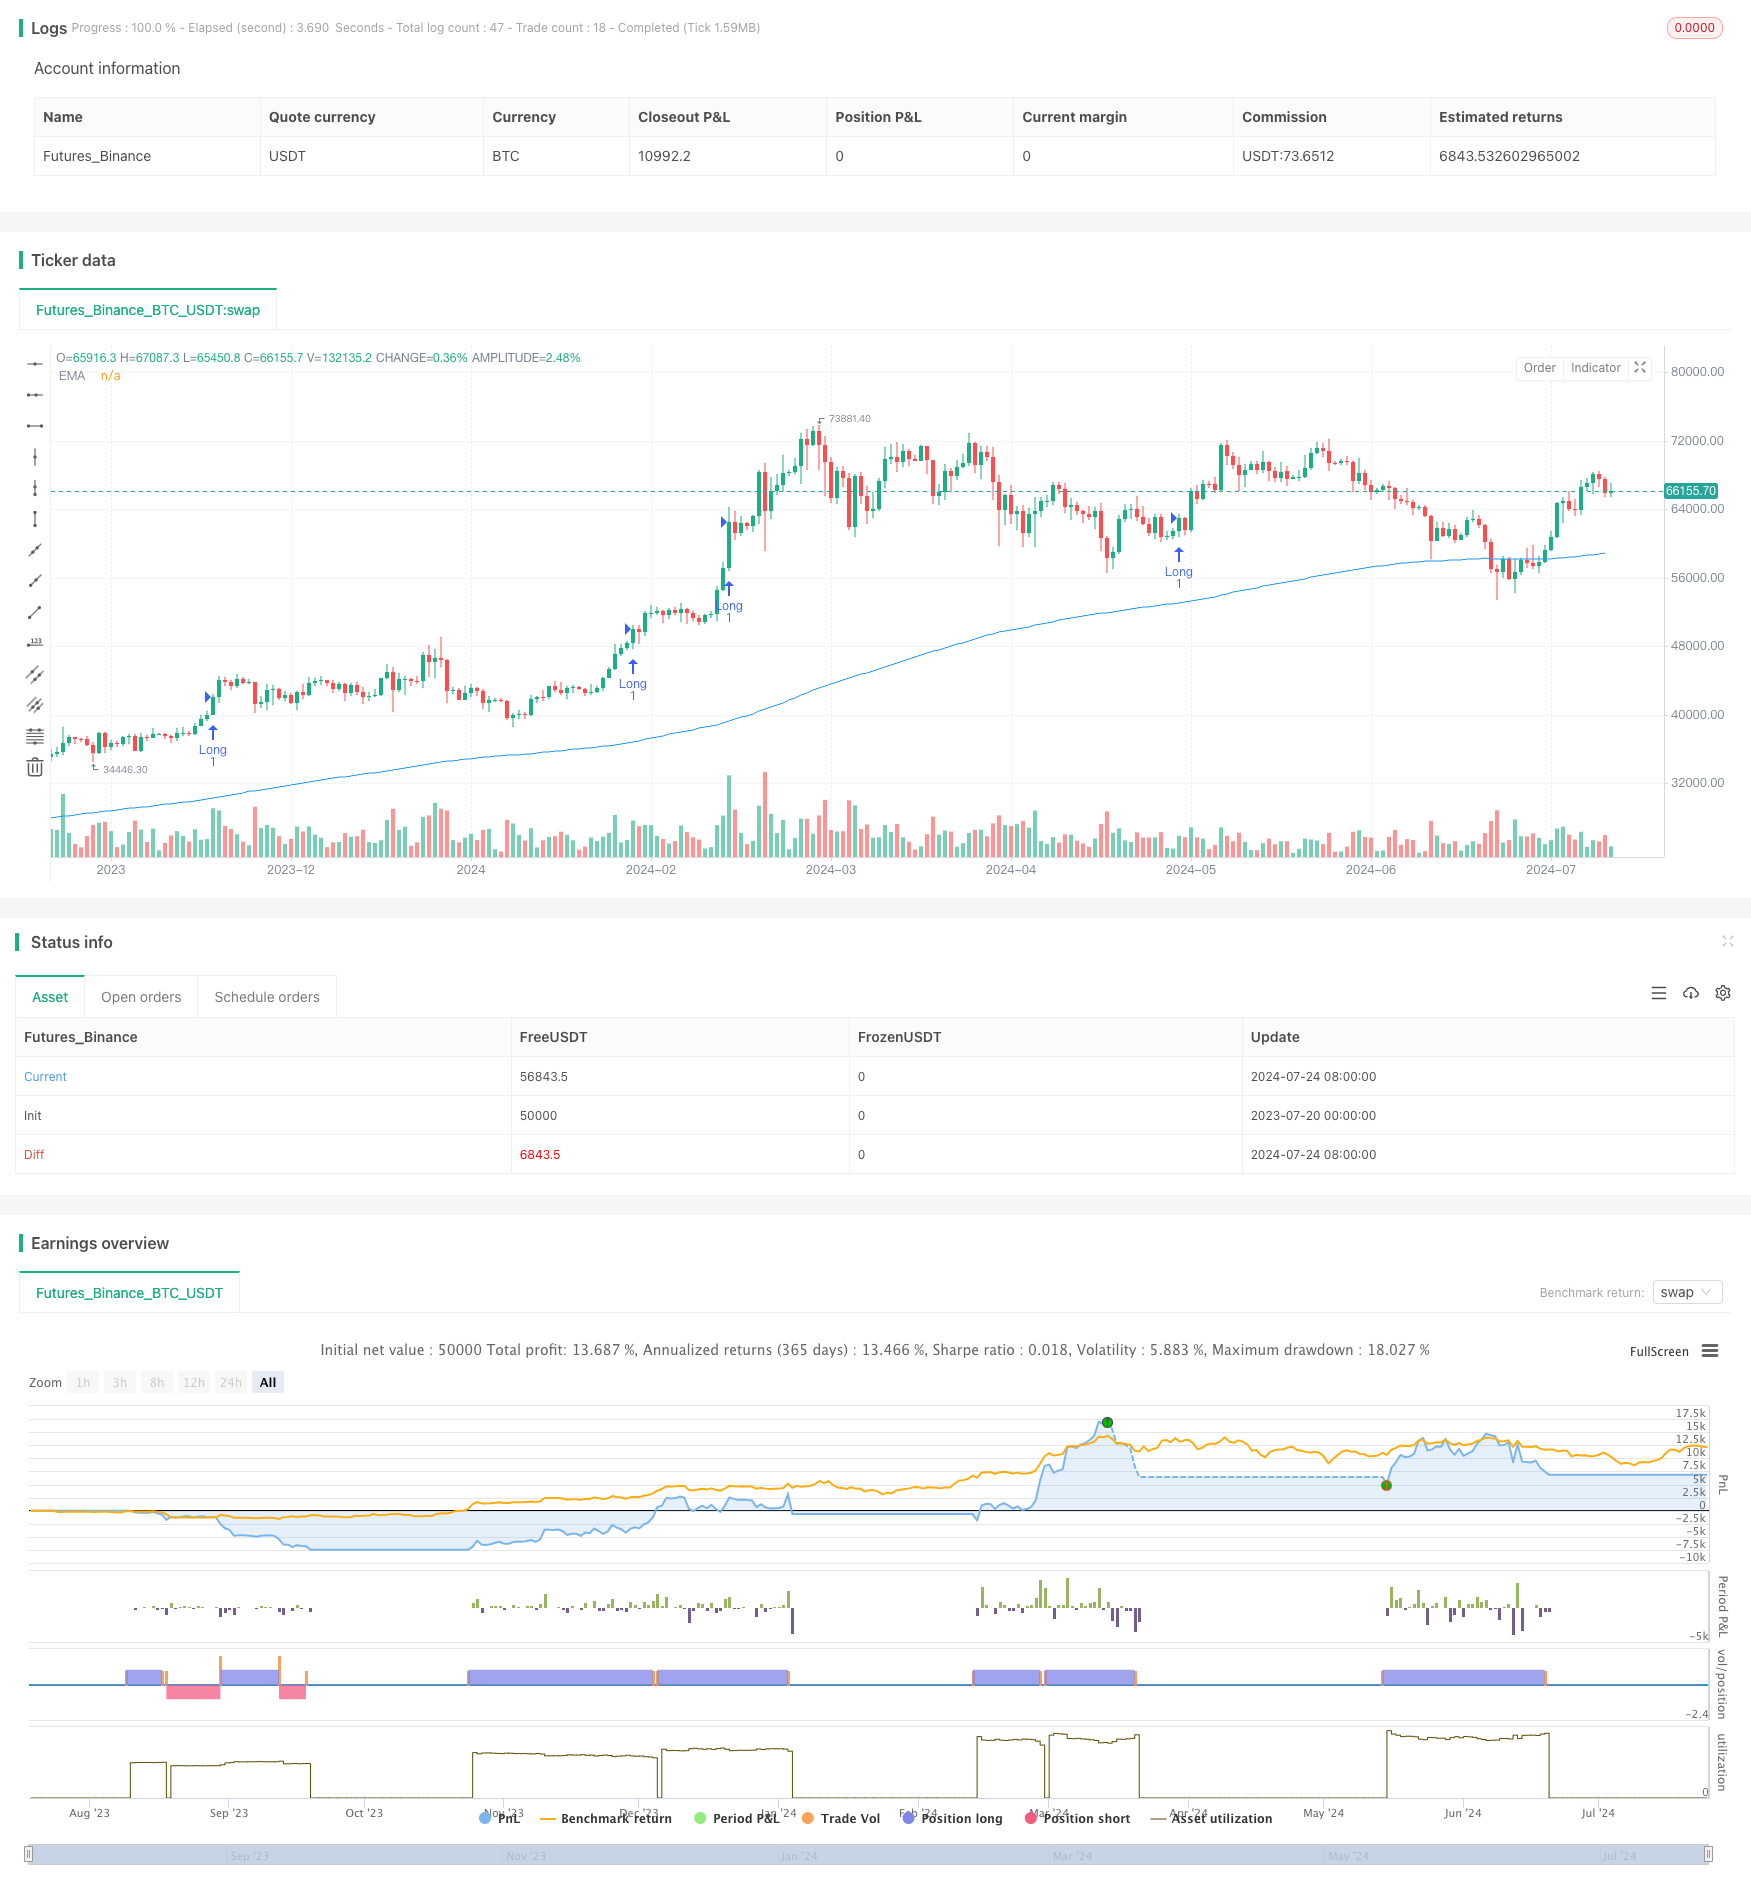
[trans]
概述
改进型多指标动量交易策略是一种结合了成交量分析、趋势确认和动态风险管理的量化交易方法。该策略主要针对高波动性市场设计,通过分析连续K线的成交量变化、价格趋势和市场波动来识别潜在的交易机会。策略利用指数移动平均线(EMA)来确认整体市场趋势,并使用平均真实波幅(ATR)来设置动态的止盈止损点,以适应不同的市场条件。
策略原理
-
成交量分析:策略关注连续3根K线的成交量方向,并计算当前成交量与近期平均成交量的比率。这有助于识别成交量异常增加的情况,可能预示着价格突破或反转。
-
趋势确认:使用200周期的指数移动平均线(EMA)来确认整体市场趋势。当价格位于EMA之上时,被视为上升趋势;反之则为下降趋势。
-
入场条件:
- 多头:连续3根上涨K线的成交量增加,当前成交量高于平均水平的1.5倍,且价格在EMA之上。
- 空头:连续3根下跌K线的成交量增加,当前成交量高于平均水平的1.5倍,且价格在EMA之下。
-
动态风险管理:使用14周期的平均真实波幅(ATR)来设置止盈和止损点。
- 止损:设置为1.5倍ATR
- 止盈:设置为2.5倍ATR
策略优势
-
多维度分析:结合了成交量、价格趋势和市场波动性等多个维度的分析,提高了信号的可靠性。
-
动态风险管理:使用ATR设置止盈止损,能够根据市场波动性自动调整,适应不同的市场环境。
-
趋势跟随:通过EMA确认整体趋势,减少了逆势交易的风险。
-
灵活性:策略的多个参数可以根据不同的市场条件和交易品种进行调整,具有较强的适应性。
-
可视化:策略在图表上标注了入场点、止盈止损水平等信息,便于交易者直观理解和分析。
策略风险
-
假突破风险:在横盘市场中,可能会出现频繁的假突破信号,导致过度交易。
-
滑点风险:在高波动性市场中,实际成交价格可能与信号触发时的价格有较大差异。
-
过度依赖技术指标:策略主要依赖技术指标,可能忽略了基本面因素的影响。
-
参数敏感性:策略的表现可能对参数设置较为敏感,不同的参数组合可能导致显著不同的结果。
-
交易成本:策略未考虑交易成本,在实际交易中可能会影响盈利能力。
策略优化方向
-
引入市场情绪指标:可以考虑加入诸如RSI或MACD等指标,以更好地捕捉市场超买超卖状态和动量变化。
-
优化成交量分析:可以考虑使用更复杂的成交量分析方法,如On-Balance Volume (OBV)或Chaikin Money Flow (CMF),以提供更准确的成交量信号。
-
加入时间过滤器:引入交易时间窗口的概念,避免在市场低流动性时段进行交易。
-
动态调整参数:可以考虑使用自适应参数,根据recent市场条件自动调整EMA周期、ATR倍数等参数。
-
引入基本面数据:结合一些基本面指标或新闻事件分析,提高策略的全面性。
-
改进止盈止损机制:可以考虑使用移动止损或基于支撑阻力位的止损方法,以更好地保护利润。
-
增加过滤条件:添加额外的过滤条件,如成交量异常、价格波动范围等,以减少假信号。
总结
改进型多指标动量交易策略通过结合成交量分析、趋势确认和动态风险管理,为高波动性市场提供了一种相对全面的交易方法。该策略的优势在于其多维度分析和动态风险管理能力,但同时也面临假突破和过度依赖技术指标等风险。通过引入更多指标、优化参数设置和改进风险管理方法,该策略有潜力进一步提升其性能和适应性。然而,交易者在使用此策略时仍需谨慎,进行充分的回测和实盘验证,并根据具体市场条件进行必要的调整。
||
Overview
The Enhanced Multi-Indicator Momentum Trading Strategy is a quantitative trading approach that combines volume analysis, trend confirmation, and dynamic risk management. This strategy is primarily designed for high-volatility markets, identifying potential trading opportunities by analyzing consecutive candlestick volume changes, price trends, and market volatility. The strategy utilizes an Exponential Moving Average (EMA) to confirm overall market trends and uses the Average True Range (ATR) to set dynamic take-profit and stop-loss points, adapting to various market conditions.
Strategy Principles
-
Volume Analysis: The strategy focuses on the volume direction of three consecutive candlesticks and calculates the ratio of current volume to recent average volume. This helps identify abnormal volume increases that may indicate price breakouts or reversals.
-
Trend Confirmation: A 200-period Exponential Moving Average (EMA) is used to confirm the overall market trend. When the price is above the EMA, it's considered an uptrend; otherwise, it's a downtrend.
-
Entry Conditions:
- Long: Three consecutive up-candles with increasing volume, current volume 1.5 times higher than average, and price above the EMA.
- Short: Three consecutive down-candles with increasing volume, current volume 1.5 times higher than average, and price below the EMA.
-
Dynamic Risk Management: A 14-period Average True Range (ATR) is used to set take-profit and stop-loss points.
- Stop Loss: Set at 1.5 times ATR
- Take Profit: Set at 2.5 times ATR
Strategy Advantages
-
Multi-dimensional Analysis: Combines analysis of volume, price trends, and market volatility, increasing signal reliability.
-
Dynamic Risk Management: Uses ATR to set take-profit and stop-loss levels, automatically adjusting to market volatility and adapting to different market environments.
-
Trend Following: Confirms overall trend using EMA, reducing the risk of counter-trend trading.
-
Flexibility: Multiple parameters can be adjusted for different market conditions and trading instruments, providing strong adaptability.
-
Visualization: The strategy annotates entry points, take-profit, and stop-loss levels on the chart, allowing traders to intuitively understand and analyze.
Strategy Risks
-
False Breakout Risk: In ranging markets, frequent false breakout signals may lead to overtrading.
-
Slippage Risk: In highly volatile markets, actual execution prices may significantly differ from signal trigger prices.
-
Over-reliance on Technical Indicators: The strategy primarily relies on technical indicators, potentially overlooking fundamental factors.
-
Parameter Sensitivity: Strategy performance may be sensitive to parameter settings, with different parameter combinations potentially leading to significantly different results.
-
Trading Costs: The strategy does not consider trading costs, which may affect profitability in actual trading.
Strategy Optimization Directions
-
Incorporate Market Sentiment Indicators: Consider adding indicators such as RSI or MACD to better capture market overbought/oversold conditions and momentum changes.
-
Optimize Volume Analysis: Consider using more sophisticated volume analysis methods, such as On-Balance Volume (OBV) or Chaikin Money Flow (CMF), to provide more accurate volume signals.
-
Add Time Filters: Introduce trading time window concepts to avoid trading during low liquidity market periods.
-
Dynamic Parameter Adjustment: Consider using adaptive parameters that automatically adjust EMA periods, ATR multiples, etc., based on recent market conditions.
-
Incorporate Fundamental Data: Integrate some fundamental indicators or news event analysis to enhance the strategy's comprehensiveness.
-
Improve Take-Profit and Stop-Loss Mechanisms: Consider using trailing stops or support/resistance-based stop methods to better protect profits.
-
Add Filtering Conditions: Include additional filtering conditions, such as volume anomalies or price range volatility, to reduce false signals.
Conclusion
The Enhanced Multi-Indicator Momentum Trading Strategy provides a relatively comprehensive trading method for high-volatility markets by combining volume analysis, trend confirmation, and dynamic risk management. The strategy's strengths lie in its multi-dimensional analysis and dynamic risk management capabilities, but it also faces risks such as false breakouts and over-reliance on technical indicators. By introducing more indicators, optimizing parameter settings, and improving risk management methods, this strategy has the potential to further enhance its performance and adaptability. However, traders should still exercise caution when using this strategy, conduct thorough backtesting and live validation, and make necessary adjustments based on specific market conditions.
[/trans]
Source (PineScript)
/*backtest
start: 2023-07-20 00:00:00
end: 2024-07-25 00:00:00
period: 1d
basePeriod: 1h
exchanges: [{"eid":"Futures_Binance","currency":"BTC_USDT"}]
*/

//@version=5
strategy("Improved Volume Based Strategy", overlay=true)

// 參數
volumePeriod = input.int(3, "Volume Period", minval=2, maxval=5)
atrPeriod = input.int(14, "ATR Period")
atrMultiplierSL = input.float(1.5, "ATR Multiplier for Stop Loss")
atrMultiplierTP = input.float(2.5, "ATR Multiplier for Take Profit")
emaPeriod = input.int(200, "EMA Period")

// 指標計算
atr = ta.atr(atrPeriod)
ema = ta.ema(close, emaPeriod)

// 判斷成交量方向
volumeUp = close > open
volumeDown = close < open

// 檢查連續K線的成交量方向
consecutiveUpVolume = volumeUp and volumeUp[1] and volumeUp[2]
consecutiveDownVolume = volumeDown and volumeDown[1] and volumeDown[2]

// 計算成交量倍率
volumeRatio = volume / ta.sma(volume, volumePeriod)

// 入場條件
longCondition = consecutiveUpVolume and volumeRatio > 1.5 and close > ema
shortCondition = consecutiveDownVolume and volumeRatio > 1.5 and close < ema

// 執行策略
if (longCondition)
    stopLoss = low - atr * atrMultiplierSL
    takeProfit = high + atr * atrMultiplierTP
    strategy.entry("Long", strategy.long)
    strategy.exit("Exit Long", "Long", stop=stopLoss, limit=takeProfit)
    labelText = "多:" + str.tostring(close, "#.##") + " 倍率:" + str.tostring(volumeRatio, "#.##") + " \n止盈:" + str.tostring(takeProfit, "#.##") + " \n止損:" + str.tostring(stopLoss, "#.##")
    label.new(bar_index, low - atr * 2, text=labelText, color=color.green, textcolor=color.white, style=label.style_label_up)

if (shortCondition)
    stopLoss = high + atr * atrMultiplierSL
    takeProfit = low - atr * atrMultiplierTP
    strategy.entry("Short", strategy.short)
    strategy.exit("Exit Short", "Short", stop=stopLoss, limit=takeProfit)
    labelText = "空:" + str.tostring(close, "#.##") + " 倍率:" + str.tostring(volumeRatio, "#.##") + " \n止盈:" + str.tostring(takeProfit, "#.##") + " \n止損:" + str.tostring(stopLoss, "#.##")
    label.new(bar_index, high + atr * 2, text=labelText, color=color.red, textcolor=color.white, style=label.style_label_down)

// 繪製指標
plot(ema, color=color.blue, title="EMA")
Detail
https://www.fmz.com/strategy/457794
Last Modified
2024-07-26 16:20:49