
12 KiB
Name
大红蜡烛突破买入策略-Big-Red-Candle-Breakout-Buy-Strategy
Author
ChaoZhang
Strategy Description
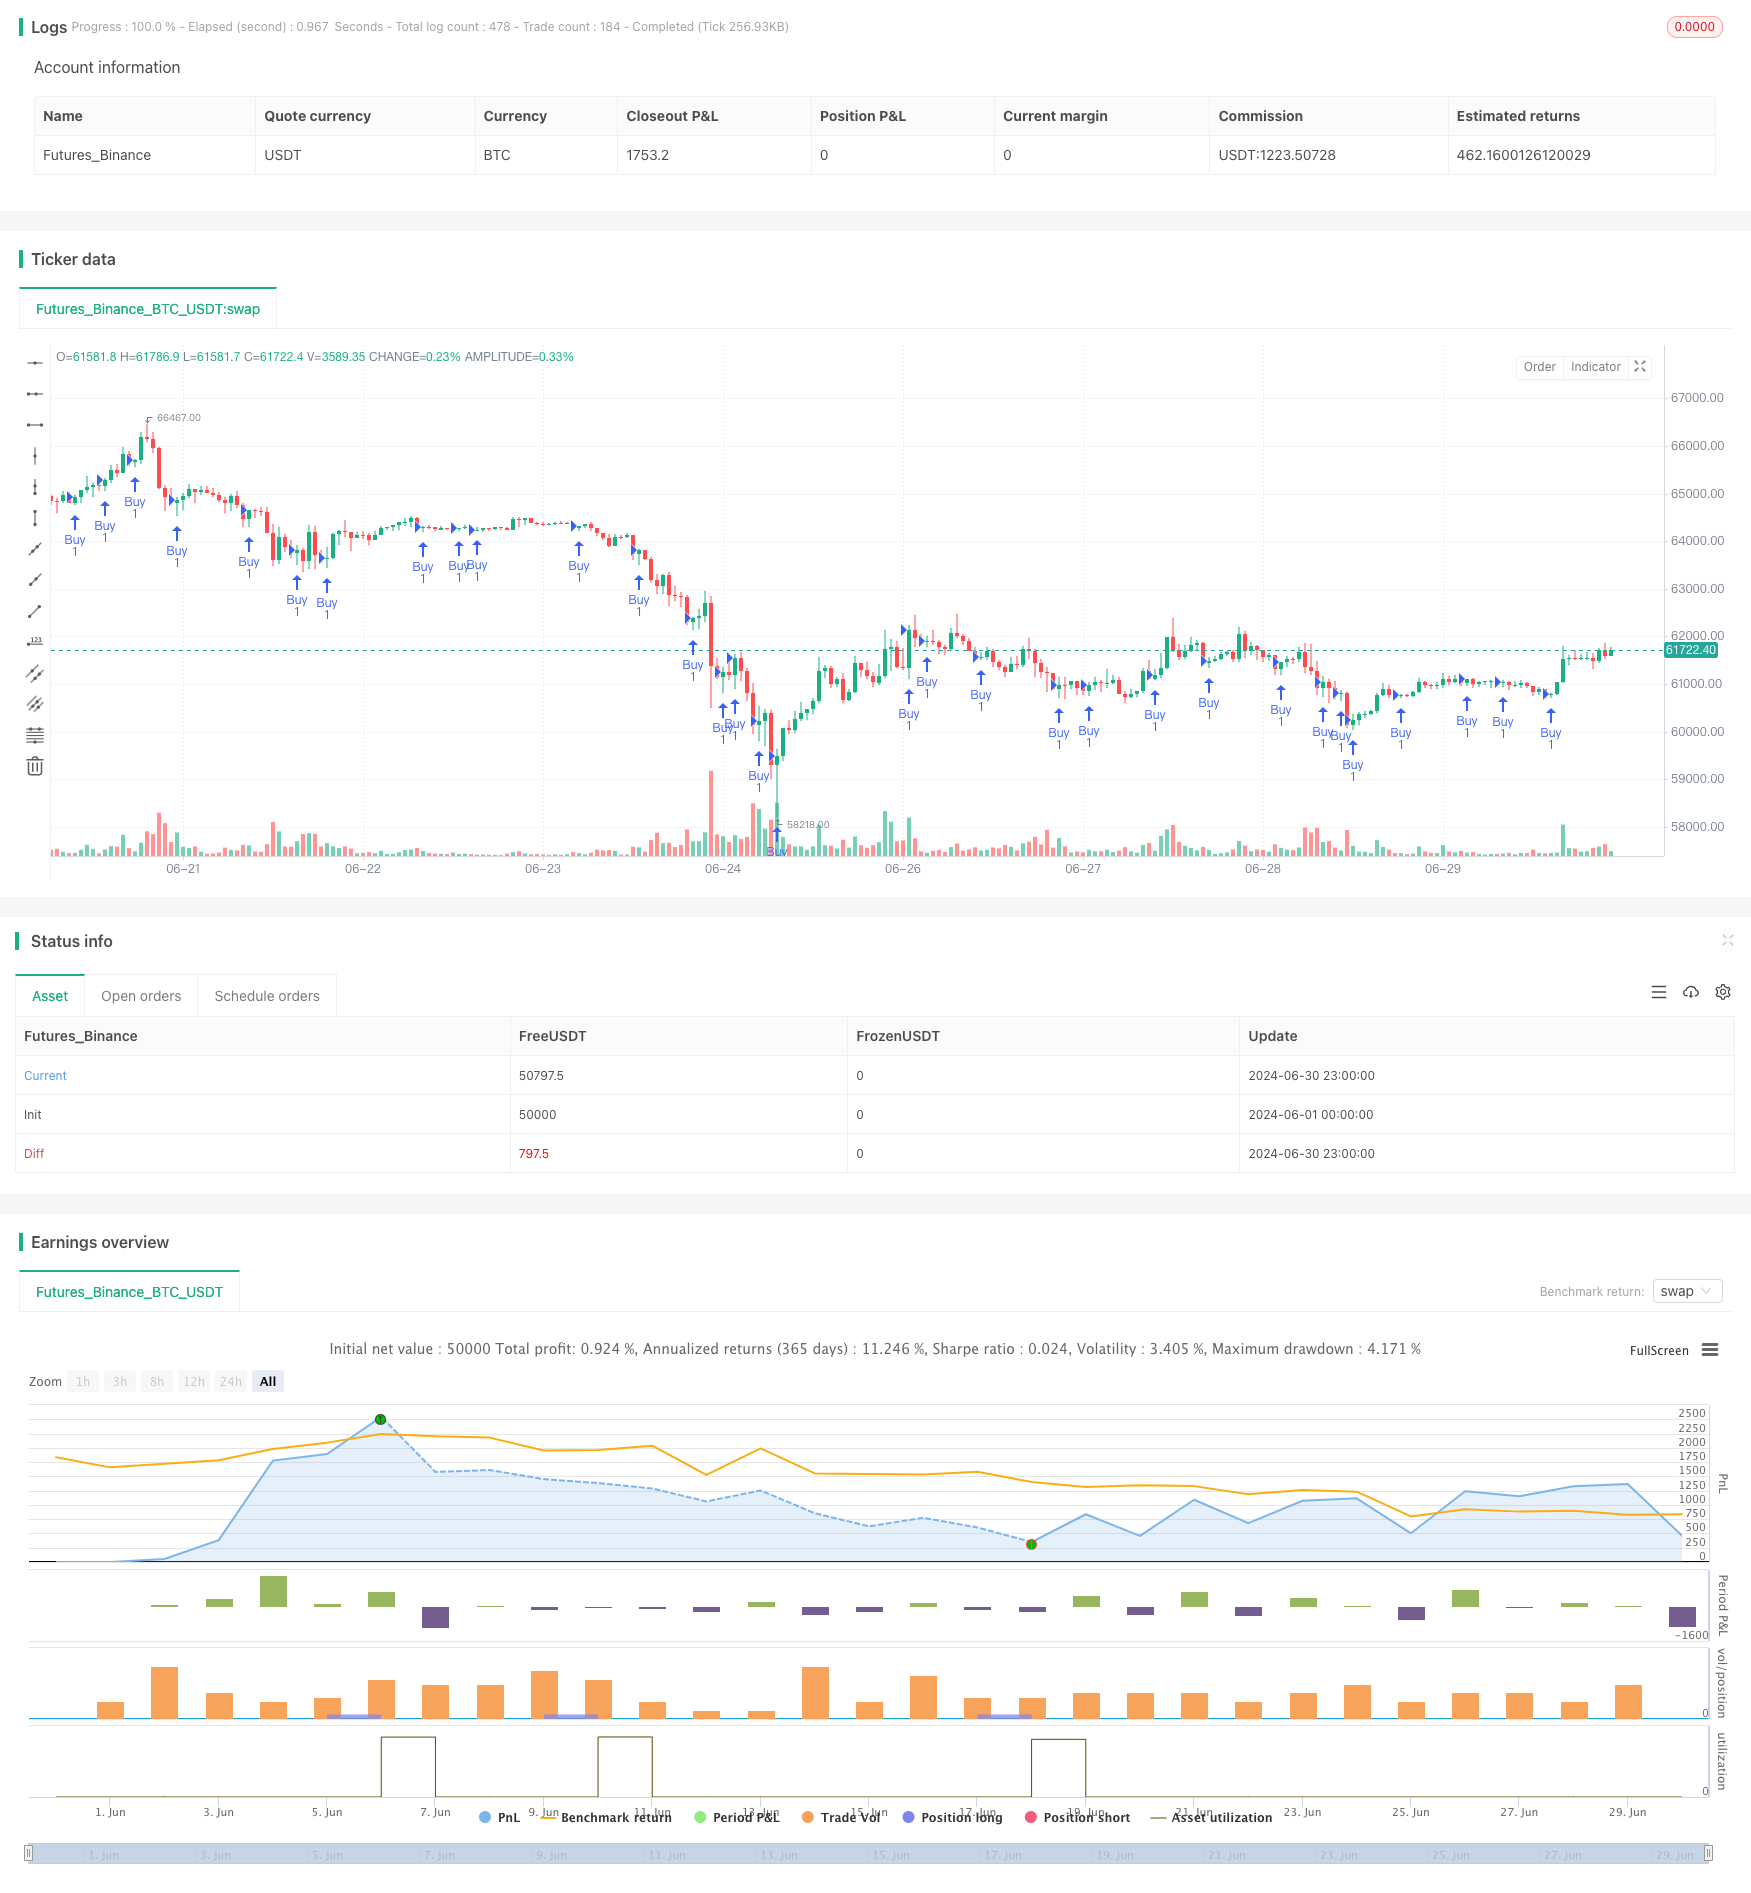
[trans]
概述
大红蜡烛突破买入策略是一种基于价格行为的交易策略,主要利用大幅下跌后的反弹机会。该策略通过识别大幅下跌的红色蜡烛,并在随后的突破中寻找买入信号,旨在捕捉市场情绪转变和潜在的反转机会。策略的核心思想是在市场超卖后寻找反弹的入场点,通过设置止损和目标来管理风险和收益。
策略原理
-
大红蜡烛识别:策略首先寻找一根大幅下跌的红色蜡烛,通常定义为至少20个点的跌幅。这表示市场出现了显著的卖压。
-
突破信号生成:在识别到大红蜡烛后,策略会监控随后的蜡烛。当第二根蜡烛的低点突破第一根大红蜡烛的低点,并且收盘价高于开盘价时,生成买入信号。
-
仓位管理:策略使用动态的仓位管理方法。初始仓位设置为1,但当策略盈利达到初始资金的150%时,会增加1个单位的仓位。
-
风险管理:每次交易都设置了20个点的止损和50个点的目标利润。这有助于控制每笔交易的风险,同时锁定潜在的利润。
-
资金管理:策略的初始资金设置为24000,这为交易提供了足够的缓冲,同时也限制了过度杠杆的风险。
策略优势
-
价格行为驱动:该策略直接基于价格行为,无需复杂的技术指标,这使得策略更加直观和反应迅速。
-
捕捉反转机会:通过识别大幅下跌后的潜在反弹,策略能够在市场情绪转变的早期阶段进场。
-
明确的入场和出场规则:策略有清晰的入场信号和预设的止损与目标,这有助于交易者保持纪律性。
-
动态仓位管理:随着盈利的增加而增加仓位的方法,允许策略在成功时扩大收益。
-
风险控制:预设的止损和目标确保了每笔交易的风险回报比得到控制。
-
适应性强:虽然在5分钟时间框架上进行了回测,但策略的逻辑可以应用于不同的市场和时间框架。
策略风险
-
假突破风险:市场可能出现假突破,导致触发止损。为减少这种风险,可以考虑增加确认指标或延迟入场。
-
过度交易:在剧烈波动的市场中,策略可能产生过多的信号。可以通过增加信号过滤器或限制每日交易次数来缓解。
-
趋势逆转:如果在强劲下跌趋势中使用,可能面临持续下跌的风险。可以结合趋势指标来优化入场时机。
-
滑点风险:在快速市场中,实际成交价可能与信号价格有显著差异。使用限价单和设置最大允许滑点可以帮助控制这种风险。
-
资金管理风险:随着盈利增加仓位可能导致风险过度集中。可以设置最大仓位限制来管理这一风险。
策略优化方向
-
引入波动率调整:考虑使用ATR(Average True Range)来动态调整止损和目标位置,使策略更好地适应不同的市场波动条件。
-
增加趋势过滤器:结合移动平均线或ADX指标,只在整体趋势方向上进行交易,可能会提高策略的成功率。
-
优化入场确认:可以考虑使用RSI或随机指标来确认超卖条件,进一步提高入场的准确性。
-
改进仓位管理:可以实现更复杂的仓位管理算法,如基于账户净值百分比或凯利准则来调整仓位大小。
-
增加时间过滤:考虑市场的活跃时段,在特定时间段内才允许交易,以避开波动较小或不规律的时段。
-
引入成交量分析:将成交量作为额外的确认指标,只有在成交量支持的情况下才进行交易。
-
多时间框架分析:结合更高时间框架的趋势信息,以提高交易的整体方向性。
总结
大红蜡烛突破买入策略是一种基于价格行为的交易方法,旨在捕捉市场超卖后的反弹机会。通过识别大幅下跌的蜡烛和随后的突破模式,策略提供了一种相对简单但潜在有效的交易方法。其优势在于直观的价格行为分析、明确的规则和内置的风险管理机制。然而,策略也面临假突破和趋势逆转等风险。
通过引入额外的技术指标、优化仓位管理和增加市场环境过滤器,该策略有潜力进一步提高其性能。交易者在使用此策略时,应当注意市场条件的变化,并根据个人的风险承受能力和交易目标进行适当的调整。总的来说,这是一个值得进一步探索和优化的策略框架,特别适合那些偏好价格行为分析和寻求清晰交易规则的交易者。
||
Overview
The Big Red Candle Breakout Buy Strategy is a price action-based trading strategy that aims to capitalize on rebound opportunities following significant market declines. This strategy identifies large downward price movements represented by big red candles and looks for buy signals in subsequent breakouts, aiming to capture shifts in market sentiment and potential reversal opportunities. The core idea is to find entry points for rebounds after market oversold conditions, managing risk and reward through predefined stop-loss and target levels.
Strategy Principles
-
Big Red Candle Identification: The strategy first looks for a large red candle, typically defined as a decline of at least 20 points. This indicates significant selling pressure in the market.
-
Breakout Signal Generation: After identifying a big red candle, the strategy monitors subsequent candles. A buy signal is generated when a second candle's low breaks below the low of the first big red candle, and its closing price is higher than its opening price.
-
Position Management: The strategy employs a dynamic position management approach. The initial position is set to 1 unit, but it increases by 1 unit when the strategy's profit reaches 150% of the initial capital.
-
Risk Management: Each trade is set with a 20-point stop-loss and a 50-point profit target. This helps control risk for each trade while securing potential profits.
-
Capital Management: The strategy's initial capital is set at 24,000, providing sufficient buffer for trading while limiting the risk of excessive leverage.
Strategy Advantages
-
Price Action Driven: The strategy is based directly on price action, requiring no complex technical indicators, making it more intuitive and responsive.
-
Capturing Reversal Opportunities: By identifying potential rebounds after significant declines, the strategy can enter trades in the early stages of market sentiment shifts.
-
Clear Entry and Exit Rules: The strategy has well-defined entry signals and preset stop-loss and target levels, helping traders maintain discipline.
-
Dynamic Position Management: The method of increasing position size as profits grow allows the strategy to expand gains during successful periods.
-
Risk Control: Preset stop-loss and target levels ensure that the risk-reward ratio is controlled for each trade.
-
High Adaptability: Although backtested on a 5-minute timeframe, the strategy's logic can be applied to different markets and timeframes.
Strategy Risks
-
False Breakout Risk: The market may experience false breakouts, triggering stop-losses. To mitigate this risk, consider adding confirmation indicators or delaying entries.
-
Overtrading: In highly volatile markets, the strategy may generate too many signals. This can be alleviated by adding signal filters or limiting daily trade counts.
-
Trend Reversal: If used in a strong downtrend, there's a risk of continued decline. Incorporating trend indicators can help optimize entry timing.
-
Slippage Risk: In fast markets, actual execution prices may differ significantly from signal prices. Using limit orders and setting maximum allowed slippage can help control this risk.
-
Capital Management Risk: Increasing position size with profits may lead to over-concentration of risk. Setting maximum position limits can manage this risk.
Strategy Optimization Directions
-
Introduce Volatility Adjustment: Consider using ATR (Average True Range) to dynamically adjust stop-loss and target levels, allowing the strategy to better adapt to different market volatility conditions.
-
Add Trend Filters: Incorporating moving averages or ADX indicators to trade only in the overall trend direction may improve the strategy's success rate.
-
Optimize Entry Confirmation: Consider using RSI or stochastic indicators to confirm oversold conditions, further improving entry accuracy.
-
Improve Position Management: Implement more sophisticated position sizing algorithms, such as adjusting position size based on account equity percentage or Kelly criterion.
-
Add Time Filters: Consider market active periods, allowing trades only during specific time ranges to avoid less volatile or irregular periods.
-
Incorporate Volume Analysis: Use volume as an additional confirmation indicator, only trading when supported by volume.
-
Multi-Timeframe Analysis: Combine trend information from higher timeframes to improve overall trade directionality.
Conclusion
The Big Red Candle Breakout Buy Strategy is a price action-based trading method designed to capture rebound opportunities after market oversold conditions. By identifying large decline candles and subsequent breakout patterns, the strategy offers a relatively simple yet potentially effective trading approach. Its strengths lie in intuitive price action analysis, clear rules, and built-in risk management mechanisms. However, the strategy also faces risks such as false breakouts and trend reversals.
By introducing additional technical indicators, optimizing position management, and adding market environment filters, the strategy has the potential to further improve its performance. Traders using this strategy should be mindful of changing market conditions and make appropriate adjustments based on their risk tolerance and trading objectives. Overall, this is a strategy framework worth further exploration and optimization, particularly suitable for traders who prefer price action analysis and seek clear trading rules.
[/trans]
Source (PineScript)
/*backtest
start: 2024-06-01 00:00:00
end: 2024-06-30 23:59:59
period: 1h
basePeriod: 15m
exchanges: [{"eid":"Futures_Binance","currency":"BTC_USDT"}]
*/

//@version=5
strategy("Red Candle Breakout Buy Strategy", overlay=true, initial_capital=24000)

// Inputs
bigRedCandlePoints = input(20, title="Big Red Candle Points")
defaultQuantity = input(1, title="Default Quantity")
stopLossPoints = input(20, title="Stop Loss Points")
targetPoints = input(50, title="Target Points")

// Detect a big red candle
bigRedCandle = (high - low >= bigRedCandlePoints) and (close < open)

// Track the first big red candle
var float firstRedCandleLow = na
var bool firstRedCandleDetected = false
if bigRedCandle
    firstRedCandleLow := low
    firstRedCandleDetected := true

// Reset if a new big red candle is detected
if bigRedCandle and firstRedCandleDetected
    firstRedCandleLow := low

// Generate buy signal on the second candle breaking the first red candle's low
buySignal = (firstRedCandleDetected and low < firstRedCandleLow and close > open)

// Variables to handle quantity adjustment
var float lastEquity = strategy.initial_capital
var float currentQuantity = defaultQuantity

// Check for equity increase and adjust quantity
if strategy.opentrades.profit(strategy.opentrades - 1) >= lastEquity * 1.50
    currentQuantity := currentQuantity + 1
    lastEquity := strategy.opentrades.profit(strategy.opentrades - 1)

// Execute the strategy
if buySignal
    strategy.entry("Buy", strategy.long, qty=currentQuantity)

// Define stop loss and profit target levels
strategy.exit("Exit", from_entry="Buy", stop=close - stopLossPoints, limit=close + targetPoints)
Detail
https://www.fmz.com/strategy/458026
Last Modified
2024-07-29 13:31:00