
15 KiB
Name
多重确认变动平均趋势与随机RSI动量交易策略-Multi-Confirmation-EMA-Trend-and-Stochastic-RSI-Momentum-Trading-Strategy
Author
ianzeng123
Strategy Description
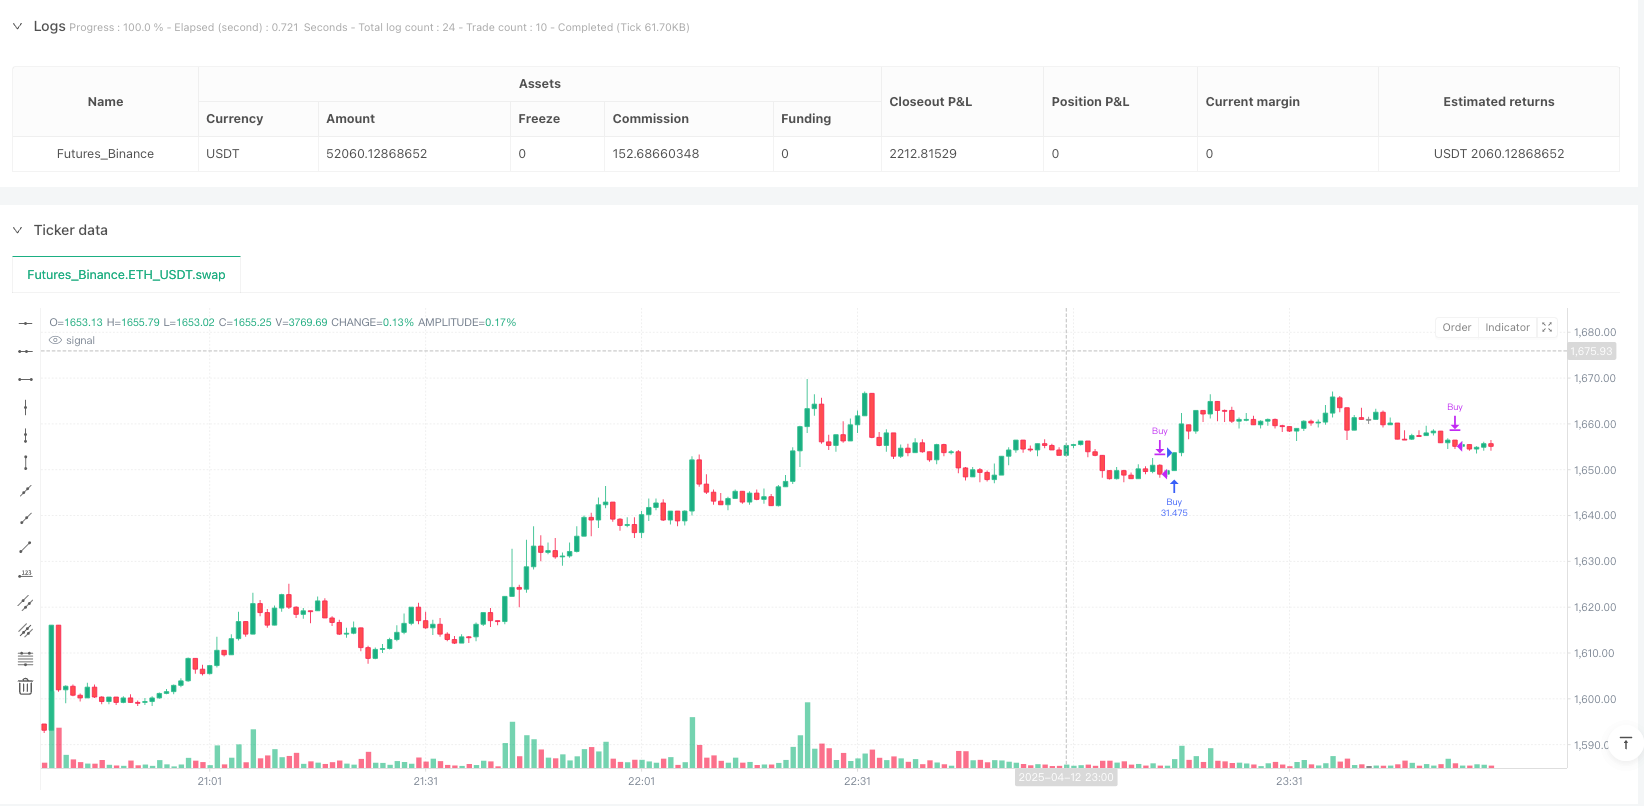
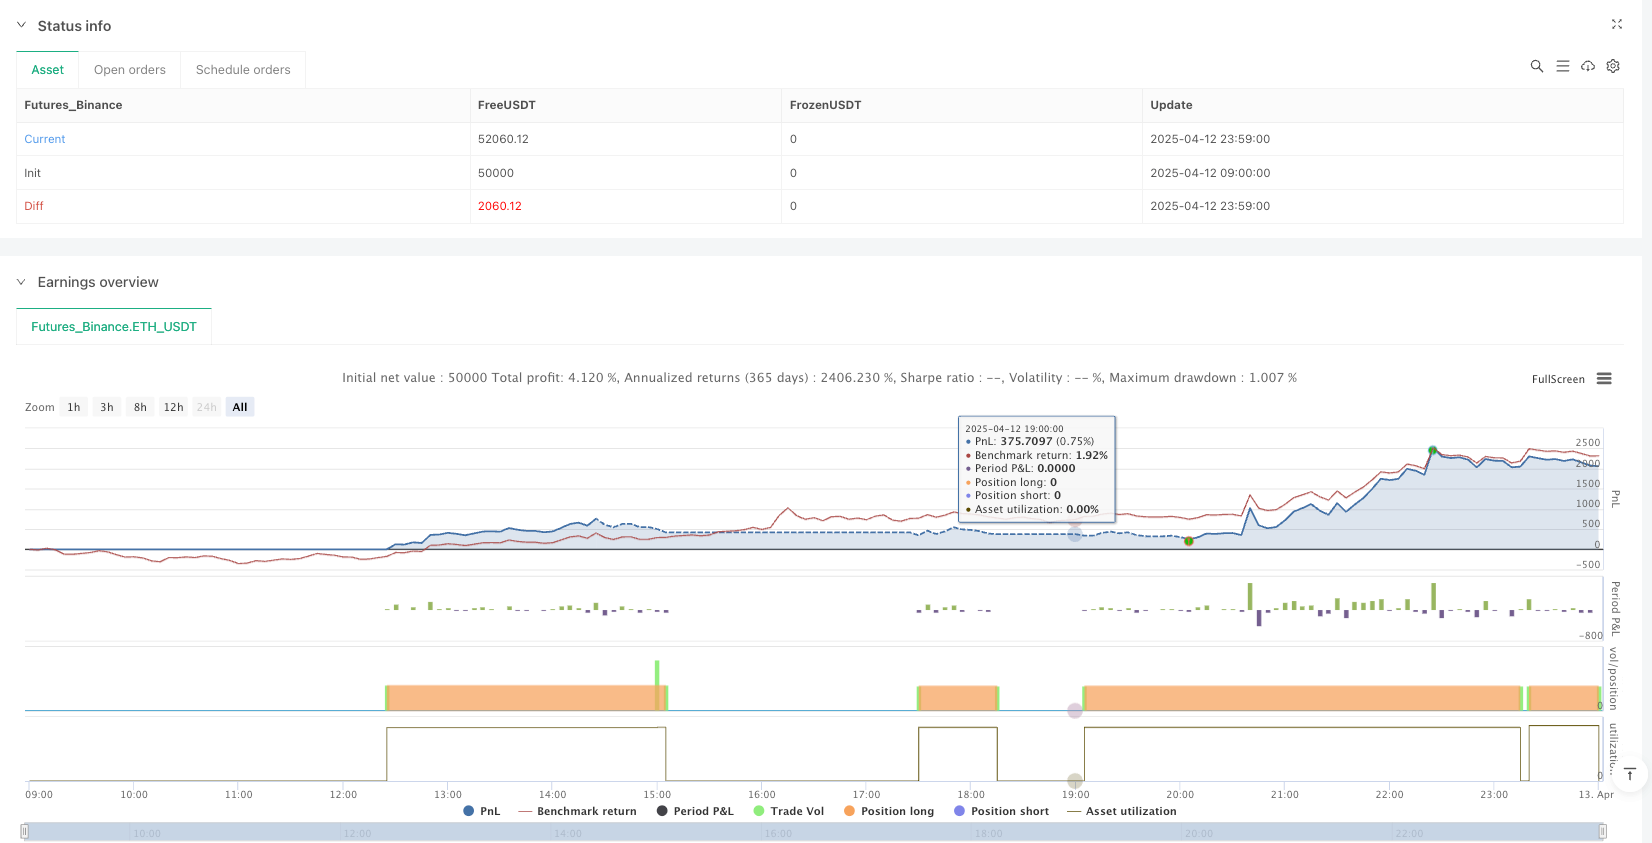
[trans]
概述
"多重确认变动平均趋势与随机RSI动量交易策略"是一种结合了趋势跟踪和动量指标的量化交易系统。该策略核心是利用快速指数移动平均线(EMA)与慢速EMA的交叉作为趋势方向的信号,同时结合随机RSI指标的%K线与%D线关系作为动量确认,从而形成双重确认机制,有效减少假信号并提高交易质量。策略主要针对短期交易设计,通过精确定义的11/50周期EMA和15/7/10参数的随机RSI指标实现信号生成。
策略原理
该策略的核心原理基于两个关键技术指标的协同作用:
-
指数移动平均线(EMA)交叉系统:
- 使用11周期的快速EMA和50周期的慢速EMA
- 当快速EMA从下方突破慢速EMA时,被视为潜在的上升趋势确立
- 当快速EMA从上方跌破慢速EMA时,被视为潜在的下降趋势确立
-
随机RSI动量确认:
- 首先计算10周期的RSI值
- 在RSI基础上计算随机指标,生成原始随机值
- 对原始随机值进行15周期的平滑处理得到%K线
- 对%K线进行7周期的平滑处理得到%D线
- 当%K线位于%D线上方时,表示正向动量
- 当%K线位于%D线下方时,表示负向动量
买入信号生成逻辑:同时满足(1)快速EMA上穿慢速EMA和(2)%K线位于%D线上方。 卖出信号生成逻辑:同时满足(1)快速EMA下穿慢速EMA和(2)%K线位于%D线下方。
通过这种双重确认机制,策略能够在趋势变化早期进场,同时通过动量确认降低假突破的风险。
策略优势
-
多重确认机制:结合趋势和动量两种不同类型的指标,相互验证,有效过滤假信号,提高交易准确性。
-
灵活的参数设置:策略中的EMA周期(11/50)和随机RSI参数(15/7/10)已经过优化,但用户可根据不同市场特性或个人风险偏好进行调整。
-
早期趋势捕捉:11周期的快速EMA对价格变动反应敏感,能较早捕捉趋势变化,而50周期的慢速EMA则提供了趋势筛选功能。
-
清晰的入场和出场规则:策略定义了明确的入场和出场条件,减少了主观判断,有利于系统化执行。
-
完全量化:策略完全基于技术指标计算,可以实现全自动化交易,避免人为情绪干扰。
-
风险控制简明:通过百分比仓位管理(默认100%),便于根据资金规模调整风险敞口。
策略风险
-
震荡市场下的频繁交易:在横盘整理或无明显趋势的市场环境中,EMA可能频繁交叉,即使有随机RSI的过滤,仍可能产生过多交易信号,增加交易成本。
-
参数敏感性:EMA周期和随机RSI参数的选择对策略性能有显著影响,当前参数(11/50 EMA和15/7/10随机RSI)可能不适用于所有市场条件。
-
滞后性风险:虽然使用了快速EMA(11周期),但任何基于移动平均的策略本质上都存在一定滞后性,可能导致在剧烈波动市场中的入场和出场不够及时。
-
缺乏止损机制:当前策略只依靠信号反转退出,没有设置明确的止损机制,在极端市场条件下可能面临较大回撤。
-
资金管理简化:策略默认使用100%的资金比例进行交易,缺乏更精细的资金管理机制,可能在连续亏损情况下面临资金风险。
风险缓解方法包括:添加附加过滤条件(如波动率过滤器)、引入自适应参数、设置硬性止损、优化资金管理策略、以及增加长线趋势指标作为补充确认。
策略优化方向
-
增加趋势强度过滤: 可以添加ADX(平均方向指数)作为趋势强度过滤器,只在ADX值超过某个阈值(通常为20或25)时才考虑交易信号,避免在弱趋势或震荡市场中频繁交易。
-
引入自适应参数: 可以基于市场波动性动态调整EMA和随机RSI的参数。例如,在高波动时期使用较长周期减少噪音,低波动时期使用较短周期提高灵敏度。
-
添加止损机制: 实现基于ATR(平均真实波幅)的止损设置,或设置固定百分比止损,以保护资金免受异常市场波动的影响。
-
优化资金管理: 改进仓位管理策略,如基于波动率调整风险敞口,或实施逐步加仓/减仓策略,而非简单的100%仓位交易。
-
信号确认层优化: 可以增加第三重确认层,如成交量突破或价格形态确认,进一步提高信号质量。
-
扩展时间框架分析: 增加更长时间周期的趋势方向确认,以避免在主趋势反向时的逆势交易。
-
回测优化: 进行广泛的参数优化和历史回测,针对不同市场环境确定最优参数组合。
这些优化方向旨在提高策略的稳健性和适应性,尤其是在不同市场环境下的表现一致性。
总结
"多重确认变动平均趋势与随机RSI动量交易策略"是一个结合了趋势跟踪和动量确认的短期交易系统。通过快速EMA(11周期)与慢速EMA(50周期)的交叉判断趋势方向,并使用随机RSI的%K和%D线关系(参数15/7/10)进行动量确认,实现了一个双重验证的交易信号生成机制。
该策略最大的优势在于通过多重指标确认降低了假信号的可能性,提高了交易质量。同时,清晰的参数设置和执行规则使其易于实现自动化。然而,策略在震荡市场中可能面临过度交易风险,且缺乏完善的止损机制。
通过引入趋势强度过滤、自适应参数调整、止损机制和更优的资金管理,该策略有较大的优化空间。特别是增加多时间框架分析和改进信号确认机制,可以显著提升策略的鲁棒性和长期稳定性。
总体而言,该策略为短期趋势交易提供了一个结构清晰、逻辑合理的框架,适合在趋势明确的市场环境中应用,并可作为更复杂交易系统的基础组件。||
Overview
The "Multi-Confirmation EMA Trend and Stochastic RSI Momentum Trading Strategy" is a quantitative trading system that combines trend following and momentum indicators. The core of the strategy utilizes the crossover between a fast Exponential Moving Average (EMA) and a slow EMA as a signal for trend direction, while simultaneously using the relationship between the %K and %D lines of the Stochastic RSI indicator as momentum confirmation. This dual-confirmation mechanism effectively reduces false signals and improves trading quality. The strategy is primarily designed for short-term trading and generates signals using precisely defined parameters: 11/50 period EMAs and 15/7/10 parameters for the Stochastic RSI indicator.
Strategy Principles
The core principles of this strategy are based on the synergistic action of two key technical indicators:
-
Exponential Moving Average (EMA) Crossover System:
- Uses an 11-period fast EMA and a 50-period slow EMA
- When the fast EMA crosses above the slow EMA, it is viewed as a potential uptrend establishment
- When the fast EMA crosses below the slow EMA, it is viewed as a potential downtrend establishment
-
Stochastic RSI Momentum Confirmation:
- First calculates a 10-period RSI value
- Computes the stochastic indicator based on the RSI, generating the raw stochastic values
- Smooths the raw stochastic value with a 15-period average to obtain the %K line
- Further smooths the %K line with a 7-period average to obtain the %D line
- When the %K line is above the %D line, it indicates positive momentum
- When the %K line is below the %D line, it indicates negative momentum
Buy signal generation logic: Both conditions must be met: (1) fast EMA crosses above slow EMA and (2) %K line is above the %D line. Sell signal generation logic: Both conditions must be met: (1) fast EMA crosses below slow EMA and (2) %K line is below the %D line.
Through this dual-confirmation mechanism, the strategy can enter at the early stages of trend changes while reducing the risk of false breakouts through momentum confirmation.
Strategy Advantages
-
Multiple Confirmation Mechanism: Combines trend and momentum indicators, two different types of technical indicators that validate each other, effectively filtering out false signals and improving trading accuracy.
-
Flexible Parameter Settings: The EMA periods (11/50) and Stochastic RSI parameters (15/7/10) have been optimized, but users can adjust them according to different market characteristics or personal risk preferences.
-
Early Trend Capture: The 11-period fast EMA is sensitive to price changes and can capture trend changes early, while the 50-period slow EMA provides trend filtering functionality.
-
Clear Entry and Exit Rules: The strategy defines explicit entry and exit conditions, reducing subjective judgment and facilitating systematic execution.
-
Fully Quantitative: The strategy is completely based on technical indicator calculations, enabling fully automated trading and avoiding emotional interference.
-
Simple Risk Control: Through percentage position management (default 100%), it's easy to adjust risk exposure according to capital size.
Strategy Risks
-
Frequent Trading in Ranging Markets: In sideways or trendless market environments, EMAs may cross frequently. Even with Stochastic RSI filtering, this could still generate excessive trading signals, increasing transaction costs.
-
Parameter Sensitivity: The choice of EMA periods and Stochastic RSI parameters significantly affects strategy performance. The current parameters (11/50 EMA and 15/7/10 Stochastic RSI) may not be suitable for all market conditions.
-
Lag Risk: Although a fast EMA (11-period) is used, any strategy based on moving averages inherently has some lag, which may lead to untimely entries and exits in volatile markets.
-
Lack of Stop-Loss Mechanism: The current strategy relies only on signal reversal for exits and doesn't set explicit stop-loss mechanisms, potentially facing significant drawdowns in extreme market conditions.
-
Simplified Capital Management: The strategy defaults to using 100% of the capital proportion for trading, lacking more sophisticated capital management mechanisms, which may face capital risks in the case of consecutive losses.
Risk mitigation methods include: adding additional filtering conditions (such as volatility filters), introducing adaptive parameters, setting hard stop-losses, optimizing capital management strategies, and adding longer-term trend indicators as supplementary confirmation.
Strategy Optimization Directions
-
Add Trend Strength Filtering: The Average Directional Index (ADX) could be added as a trend strength filter, only considering trading signals when the ADX value exceeds a certain threshold (typically 20 or 25), avoiding frequent trading in weak trends or ranging markets.
-
Introduce Adaptive Parameters: Parameters for EMA and Stochastic RSI could be dynamically adjusted based on market volatility. For example, using longer periods in high volatility to reduce noise, and shorter periods in low volatility to increase sensitivity.
-
Add Stop-Loss Mechanisms: Implement stop-loss settings based on Average True Range (ATR) or set fixed percentage stop-losses to protect capital from abnormal market fluctuations.
-
Optimize Capital Management: Improve position management strategy, such as adjusting risk exposure based on volatility, or implementing gradual position building/reduction strategies, rather than simple 100% position trading.
-
Signal Confirmation Layer Optimization: A third confirmation layer could be added, such as volume breakout or price pattern confirmation, to further improve signal quality.
-
Expand Timeframe Analysis: Add trend direction confirmation from longer timeframes to avoid counter-trend trading when the main trend is in the opposite direction.
-
Backtest Optimization: Conduct extensive parameter optimization and historical backtesting to determine optimal parameter combinations for different market environments.
These optimization directions aim to improve the strategy's robustness and adaptability, especially consistency of performance across different market environments.
Summary
The "Multi-Confirmation EMA Trend and Stochastic RSI Momentum Trading Strategy" is a short-term trading system that combines trend following and momentum confirmation. By judging trend direction through crossovers between a fast EMA (11-period) and a slow EMA (50-period), and using the relationship between the %K and %D lines of the Stochastic RSI (parameters 15/7/10) for momentum confirmation, it achieves a dual-verification mechanism for generating trading signals.
The strategy's greatest advantage lies in reducing the possibility of false signals through multiple indicator confirmations, thereby improving trading quality. At the same time, clear parameter settings and execution rules make it easy to automate. However, the strategy may face overtrading risks in ranging markets and lacks a comprehensive stop-loss mechanism.
There is considerable room for optimization through the introduction of trend strength filtering, adaptive parameter adjustment, stop-loss mechanisms, and better capital management. Particularly, adding multi-timeframe analysis and improving signal confirmation mechanisms can significantly enhance the strategy's robustness and long-term stability.
Overall, this strategy provides a clear structure and logical framework for short-term trend trading, suitable for application in markets with defined trends, and can serve as a foundational component for more complex trading systems.[/trans]
Source (PineScript)
/*backtest
start: 2025-04-12 09:00:00
end: 2025-04-13 00:00:00
period: 1m
basePeriod: 1m
exchanges: [{"eid":"Futures_Binance","currency":"ETH_USDT"}]
*/

//@version=6
strategy("Haze EMA Signal", overlay=true, default_qty_type=strategy.percent_of_equity, default_qty_value=100)

// === Inputs ===
fastLength = input.int(11, title="Fast EMA")
slowLength = input.int(50, title="Slow EMA")

stochLength = input.int(10, title="Stoch RSI Length")
kLength = input.int(15, title="%K Smoothing")
dLength = input.int(7, title="%D Smoothing")

// === EMA Calculations ===
fastEMA = ta.ema(close, fastLength)
slowEMA = ta.ema(close, slowLength)

// === Stochastic RSI Calculations ===
rsi = ta.rsi(close, stochLength)
stoch = ta.stoch(rsi, rsi, rsi, stochLength)
k = ta.sma(stoch, kLength)
d = ta.sma(k, dLength)

// === Conditions ===
emaCrossUp = ta.crossover(fastEMA, slowEMA)
emaCrossDown = ta.crossunder(fastEMA, slowEMA)

stochRising = k > d
stochFalling = k < d

// === Final Buy/Sell Logic ===
buyCondition = emaCrossUp and stochRising
sellCondition = emaCrossDown and stochFalling

// === Strategy Execution ===
if buyCondition
    strategy.entry("Buy", strategy.long)

if sellCondition
    strategy.close("Buy")

// No plots to keep chart clean
Detail
https://www.fmz.com/strategy/490517
Last Modified
2025-04-14 11:25:18