
8.7 KiB
Name
多时间框架逆转确认交易策略Multi-Timeframe-Reversal-Confirmation-Trading-Strategy
Author
ChaoZhang
Strategy Description
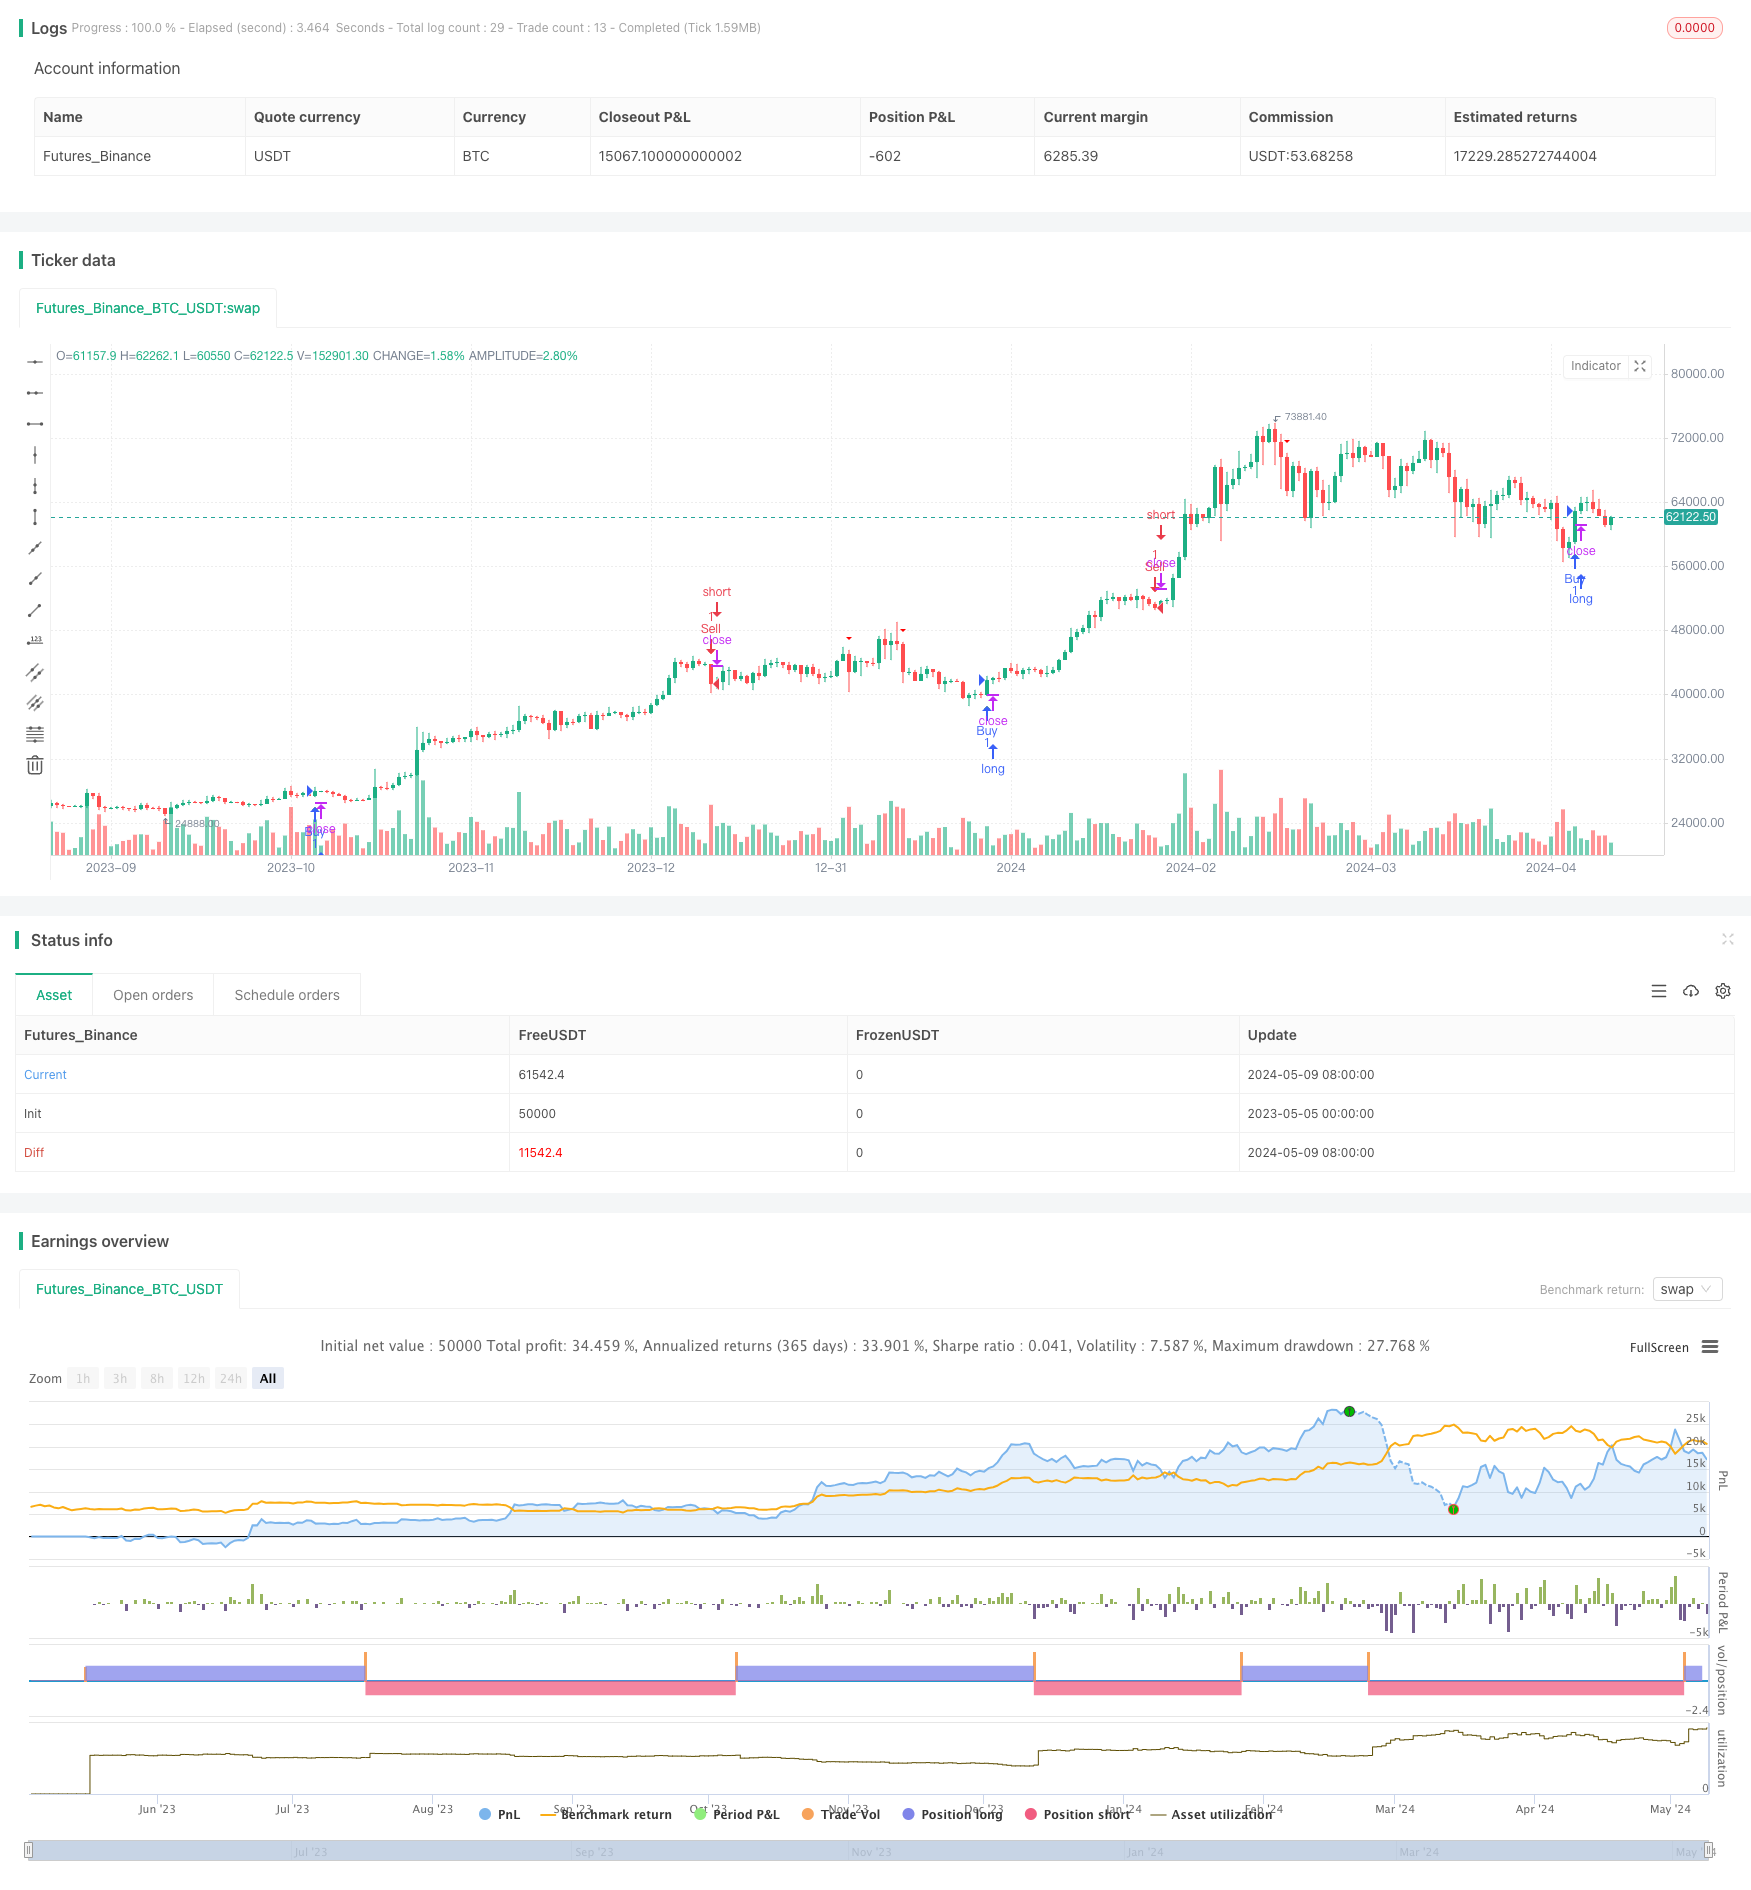
[trans]
概述
该策略主要利用最高价、最低价和指数移动平均线(EMA)来确认趋势逆转,从而产生交易信号。策略首先计算指定回看期内的最高价和最低价,然后判断当前收盘价是否低于最高价对应的最低价(看跌逆转确认)或高于最低价对应的最高价(看涨逆转确认)。一旦出现逆转确认信号,策略就会产生相应的开仓信号。该策略的主要优点是能够捕捉趋势逆转的机会,而主要风险则在于逆转确认信号出现后,价格可能出现反复震荡而不是单边趋势行情。
策略原理
- 计算指定回看期内的最高价(find_highest)和最低价(find_lowest)。
- 计算指定回看期内收盘价的EMA。
- 遍历回看期内的每根K线,找出最高价对应的最低价(dnRv),以及最低价对应的最高价(upRv)。
- 判断当前收盘价是否低于dnRv(看跌逆转确认)或高于upRv(看涨逆转确认)。
- 如果出现看跌逆转确认信号(dnRv_signal)且之前未触发过该信号,则产生做空开仓信号。
- 如果出现看涨逆转确认信号(upRv_signal)且之前未触发过该信号,则产生做多开仓信号。
策略优势
- 逆转确认信号能够帮助策略捕捉趋势逆转的机会,从而提高策略的潜在收益。
- 通过EMA的使用,策略能够适应不同的市场状况和波动周期。
- 回看期的可调整性使得策略具有灵活性,可以根据不同的交易品种和周期进行优化。
策略风险
- 逆转确认信号出现后,价格可能出现反复震荡而不是单边趋势行情,导致策略出现频繁的开仓和平仓,增加交易成本。
- 策略缺乏明确的止损和止盈机制,可能导致单笔交易的风险敞口过大。
- 策略未考虑交易品种的特性和市场环境,可能在某些情况下表现欠佳。
策略优化方向
- 引入止损和止盈机制,控制单笔交易的风险敞口。可以根据ATR、百分比或固定点数等方式设置动态或静态的止损止盈水平。
- 结合其他技术指标或市场环境因素,如RSI、MACD、波动率等,以提高逆转确认信号的可靠性和过滤掉假信号。
- 对不同的交易品种和周期进行参数优化,找到最适合的回看期和EMA周期,提高策略的适应性和稳定性。
- 考虑引入仓位管理和风险控制机制,如根据市场波动率或账户净值调整仓位大小,以控制整体风险。
总结
多时间框架逆转确认交易策略通过最高价、最低价和EMA来识别潜在的趋势逆转机会,并产生相应的开仓信号。该策略的优点是能够捕捉趋势逆转,但也存在频繁交易和风险控制不足的问题。通过引入止损止盈、结合其他指标、参数优化和仓位管理等方法,可以进一步提升策略的表现和稳定性。在实际应用中,需要根据具体的交易品种和市场环境来调整策略参数和风控措施。
||
Overview
This strategy primarily utilizes the highest price, lowest price, and Exponential Moving Average (EMA) to confirm trend reversals and generate trading signals. The strategy first calculates the highest and lowest prices within a specified lookback period, then determines whether the current closing price is below the lowest price corresponding to the highest price (bearish reversal confirmation) or above the highest price corresponding to the lowest price (bullish reversal confirmation). Once a reversal confirmation signal appears, the strategy generates a corresponding entry signal. The main advantage of this strategy is its ability to capture trend reversal opportunities, while the main risk is that after a reversal confirmation signal appears, prices may experience repeated fluctuations rather than a unidirectional trend.
Strategy Principle
- Calculate the highest price (find_highest) and lowest price (find_lowest) within the specified lookback period.
- Calculate the EMA of the closing price within the specified lookback period.
- Iterate through each candle within the lookback period to find the lowest price (dnRv) corresponding to the highest price and the highest price (upRv) corresponding to the lowest price.
- Determine whether the current closing price is below dnRv (bearish reversal confirmation) or above upRv (bullish reversal confirmation).
- If a bearish reversal confirmation signal (dnRv_signal) appears and has not been triggered before, generate a short entry signal.
- If a bullish reversal confirmation signal (upRv_signal) appears and has not been triggered before, generate a long entry signal.
Strategy Advantages
- Reversal confirmation signals can help the strategy capture trend reversal opportunities, thereby increasing the strategy's potential returns.
- By utilizing EMA, the strategy can adapt to different market conditions and volatility cycles.
- The adjustability of the lookback period makes the strategy flexible and can be optimized for different trading instruments and timeframes.
Strategy Risks
- After a reversal confirmation signal appears, prices may experience repeated fluctuations rather than a unidirectional trend, leading to frequent entries and exits, increasing trading costs.
- The strategy lacks explicit stop-loss and take-profit mechanisms, which may result in excessive risk exposure for individual trades.
- The strategy does not consider the characteristics of trading instruments and market environments, which may lead to suboptimal performance in certain situations.
Strategy Optimization Directions
- Introduce stop-loss and take-profit mechanisms to control risk exposure for individual trades. Dynamic or static stop-loss and take-profit levels can be set based on ATR, percentage, or fixed points.
- Combine other technical indicators or market environment factors, such as RSI, MACD, volatility, etc., to improve the reliability of reversal confirmation signals and filter out false signals.
- Perform parameter optimization for different trading instruments and timeframes to find the most suitable lookback period and EMA period, improving the strategy's adaptability and stability.
- Consider introducing position sizing and risk control mechanisms, such as adjusting position sizes based on market volatility or account equity, to manage overall risk.
Summary
The Multi-Timeframe Reversal Confirmation Trading Strategy identifies potential trend reversal opportunities using the highest price, lowest price, and EMA, generating corresponding entry signals. The strategy's advantage is its ability to capture trend reversals, but it also faces issues of frequent trading and insufficient risk control. By introducing stop-loss and take-profit mechanisms, combining other indicators, parameter optimization, and position sizing, the strategy's performance and stability can be further improved. In practical applications, strategy parameters and risk control measures need to be adjusted according to specific trading instruments and market environments. [/trans]
Source (PineScript)
/*backtest
start: 2023-05-05 00:00:00
end: 2024-05-10 00:00:00
period: 1d
basePeriod: 1h
exchanges: [{"eid":"Futures_Binance","currency":"BTC_USDT"}]
*/

//@version=5
strategy("Reversal Confimation Strategy", overlay=true)

// Indicator inputs
lookback = input.int(50, 'Lookback Period', minval=1, step=1)
downColor = input(color.red, 'Shape Color Down')
upColor = input(color.green, 'Shape Color Up')

// Indicator calculations
find_highest = ta.highest(high, lookback)
find_lowest = ta.lowest(low, lookback)
ema = ta.ema(close, lookback)

var dnRv = 0.0
var dnRv_trigger = false
var upRv = 0.0
var upRv_trigger = false

if high == find_highest
    dnRv_trigger := false
if low == find_lowest
    upRv_trigger := false

for i = 0 to lookback - 1
    if high[i] == find_highest
        dnRv := low[i]
for i = 0 to lookback - 1
    if low[i] == find_lowest
        upRv := high[i]

dnRv_signal = close < dnRv and dnRv_trigger == false
upRv_signal = close > upRv and upRv_trigger == false

if dnRv_signal
    dnRv_trigger := true
if upRv_signal
    upRv_trigger := true

// Entry and exit conditions
if dnRv_signal
    strategy.entry("Sell", strategy.short)
if upRv_signal
    strategy.entry("Buy", strategy.long)

// Plotting
plotshape(dnRv_signal ? 1 : 0, style=shape.triangledown, location=location.abovebar, color=downColor, size=size.small)
plotshape(upRv_signal ? 1 : 0, style=shape.triangleup, location=location.belowbar, color=upColor, size=size.small)
Detail
https://www.fmz.com/strategy/451076
Last Modified
2024-05-11 17:38:35