
15 KiB
Name
多时间框架止盈策略Multi-Timeframe-Take-Profit-Strategy
Author
ChaoZhang
Strategy Description
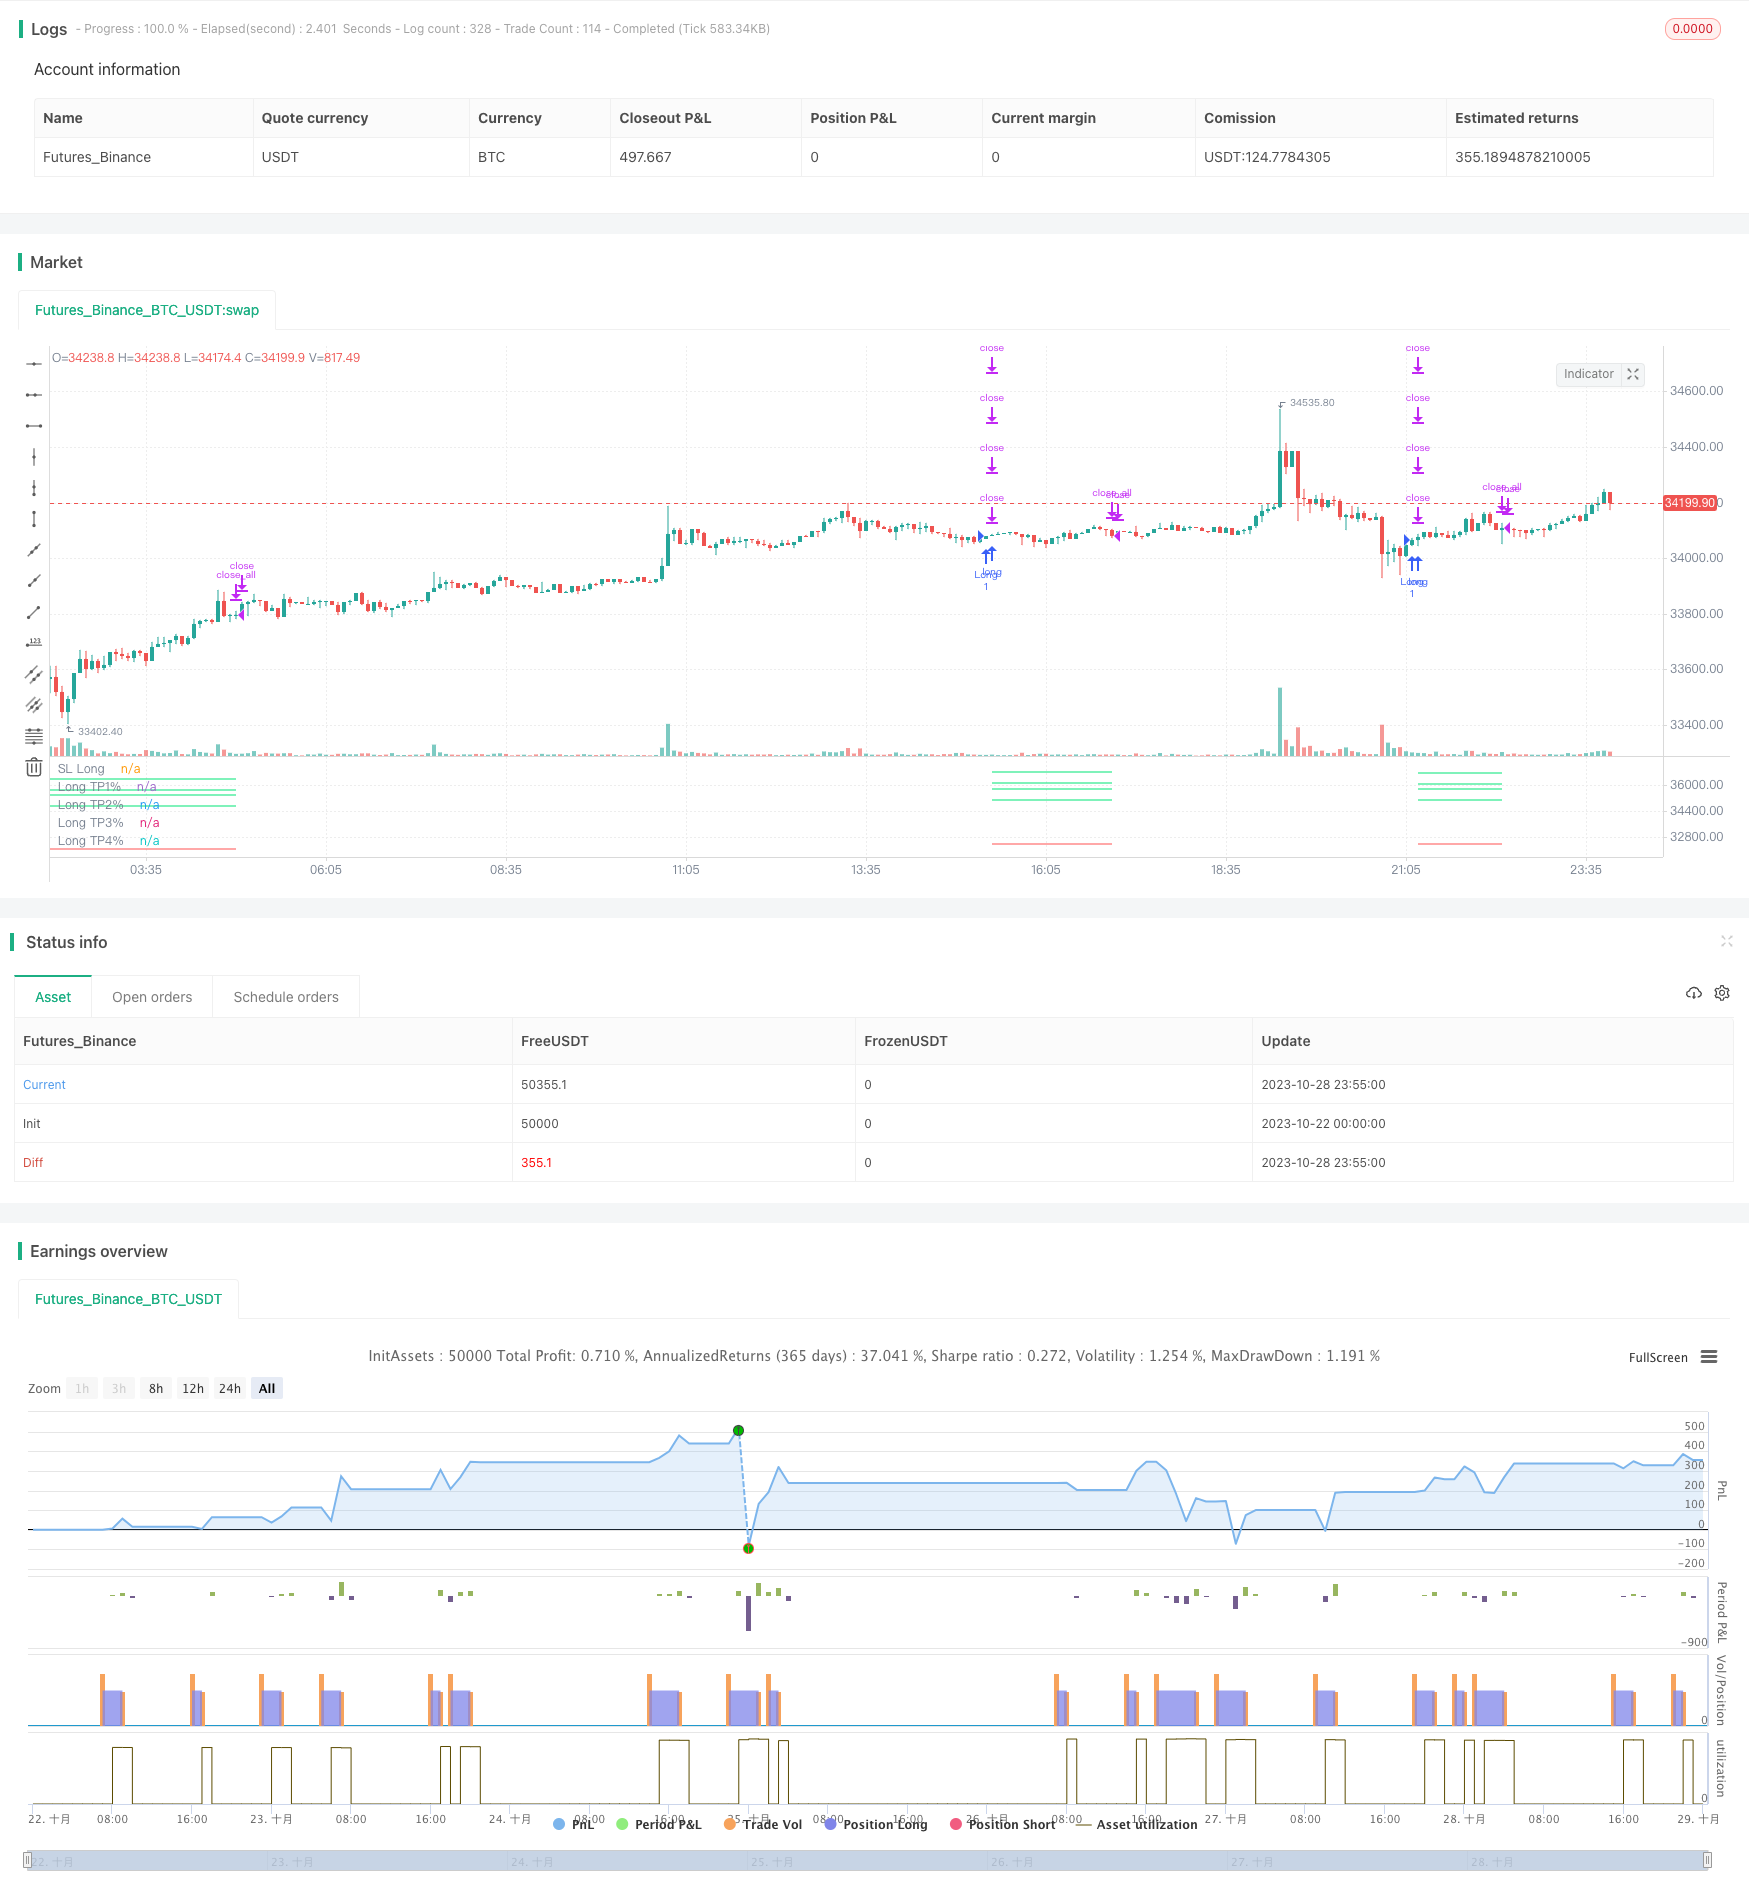
[trans]
概述
该策略旨在实现多时间框架下的止盈管理。策略同时采用百分比止盈和主时间框架以上的关键价格区域止盈,实现更精准、更有效的止盈管理。
策略原理
该策略首先引入波浪趋势指标,根据指标金叉做多信号入场。
在止盈管理方面,策略采用两种止盈方式:
-
百分比止盈:根据入场价格的一定百分比设置多个止盈价格。
-
多时间框架止盈:在日线和4小时线图上绘制均线,取这些均线的价格作为止盈价格。
对于百分比止盈,策略设置了4个不同百分比的止盈价格。当价格触及每个止盈价格时,会按设置的百分比部分平仓。
对于多时间框架止盈,策略在日线和4小时线上分别绘制100日均线、200日均线。取这些均线的价格作为止盈价格,当价格触及时平仓。
此外,策略还设置了止损价格。当价格低于止损价格时,全部平仓。
整个策略通过组合使用百分比止盈和多时间框架止盈,实现了更全面和精细的止盈管理。
策略优势
-
采用百分比止盈,根据固定比例止盈,避免过早止盈或止盈不足。
-
借助多时间框架分析,设置更精确的止盈价格,止盈点选取更优。
-
多层次止盈,可以分批止盈,降低风险。
-
设置止损价格,有效控制下行风险。
-
组合使用百分比止盈和多时间框架止盈,止盈更全面和精细化。
风险分析
-
百分比止盈依赖参数设置,如果参数设置不当,会导致止盈过早或过晚。
-
多时间框架分析依赖均线指标,均线具有一定滞后性,可能出现背离。
-
止损位置设置不当可能造成不必要的止损。
-
需要适当优化参数,使百分比止盈和多时间框架止盈达到最佳匹配。
优化方向
-
可以测试更多的均线指标,选择更优的均线作为关键止盈价格。
-
可以尝试模型预测的方法,预测价格关键区域作为止盈价格。
-
可以引入更多止盈规则,如期望止盈比例、移动止盈等,使止盈更全面。
-
可以测试不同持仓时间下的最优百分比止盈参数。
-
可以通过回测优化止盈参数,使得总体风险收益比更优。
总结
本策略通过组合百分比止盈和多时间框架止盈实现了灵活和精确的止盈管理。策略具有止盈点选择更优、止盈更全面等优势。同时也存在参数设置、止损位置等问题。后续可从优化止盈参数、增加更多止盈规则等方面进行改进,使策略的止盈系统更加完善。
||
Overview
This strategy aims to implement take profit management under multiple timeframes. The strategy uses both percentage take profit and key price levels take profit based on higher timeframes, to achieve more precise and effective take profit management.
Strategy Logic
The strategy first enters long when the Wave Trend indicator crosses up.
For take profit management, the strategy uses two types of take profit:
-
Percentage take profit: Set multiple take profit prices based on certain percentages of the entry price.
-
Multi timeframe take profit: Draw moving averages on the daily and 4-hour charts, and use their prices as take profit prices.
For percentage take profit, the strategy sets 4 take profit prices with different percentages. When price hits each take profit price, it will close partial positions based on the set percentage.
For multi timeframe take profit, the strategy draws 100MA and 200MA on both daily and 4-hour charts. When price hits these moving averages, it will close positions.
In addition, a stop loss price is set. When price is below the stop loss price, all positions will be closed.
The whole strategy combines percentage take profit and multi timeframe take profit to achieve more comprehensive and sophisticated take profit management.
Advantages
-
Adopt percentage take profit to avoid premature or insufficient take profit based on fixed percentages.
-
Utilize multi timeframe analysis to set more precise take profit prices with better levels.
-
Multi-layered take profit allows partial closing positions and reduces risks.
-
Setting stop loss price effectively controls downside risks.
-
Combining percentage take profit and multi timeframe take profit makes take profit more comprehensive and refined.
Risks Analysis
-
Percentage take profit relies on parameter settings. Improper settings may lead to premature or late take profit.
-
Multi timeframe analysis depends on moving averages, which have some lagging. Divergence may occur.
-
Improper stop loss placement may cause unnecessary stop loss.
-
Parameters need to be optimized for the best match between percentage take profit and multi timeframe take profit.
Optimization Directions
-
Test more moving averages to find the optimal ones as key take profit prices.
-
Try model prediction methods to forecast key price levels as take profit prices.
-
Introduce more take profit rules like expected profit ratio, trailing take profit etc. to make take profit more comprehensive.
-
Test optimal percentage take profit parameters under different holding periods.
-
Optimize take profit parameters through backtesting for better overall risk-reward ratios.
Summary
This strategy realizes flexible and precise take profit management by combining percentage take profit and multi timeframe take profit. The strategy has advantages like better take profit price selection and more comprehensive take profit. It also has problems like parameter setting and stop loss placement. Follow-up improvements can be made by optimizing take profit parameters, adding more take profit rules etc., to make the take profit system more robust.
[/trans]
Strategy Arguments
| Argument | Default | Description |
|---|---|---|
| v_input_1 | 10 | Channel Length |
| v_input_2 | 21 | Average Length |
| v_input_3 | 60 | Over Bought Lv 1 |
| v_input_4 | 53 | Over Bought Lv 2 |
| v_input_5 | -60 | Over Sold Lv 1 |
| v_input_6 | -53 | Over Sold Lv 2 |
| v_input_bool_1 | true | (?Set up take profit)Take profit % |
| v_input_bool_2 | false | Take profit Multi timeframe |
| v_input_int_1 | 100 | (?Take profit Mtf)Ema1 |
| v_input_int_2 | 200 | Ema2 |
| v_input_source_1_close | 0 | Source: close |
| v_input_timeframe_1 | 240 | Time frame 1 |
| v_input_timeframe_2 | D | Time frame 2 |
| v_input_float_1 | 3 | (?Take profit %)TP1 % |
| v_input_float_2 | 5 | TP2 % |
| v_input_float_3 | 6 | TP3 % |
| v_input_float_4 | 8 | TP4 % |
| v_input_float_5 | 5 | Stop Loss % |
| v_input_float_6 | 5 | % Close At TP1 |
| v_input_float_7 | 5 | % Close At TP2 |
| v_input_float_8 | 5 | % Close At TP3 |
| v_input_float_9 | 5 | % Close At TP4 |
Source (PineScript)
/*backtest
start: 2023-10-22 00:00:00
end: 2023-10-29 00:00:00
period: 5m
basePeriod: 1m
exchanges: [{"eid":"Futures_Binance","currency":"BTC_USDT"}]
*/

// This source code is subject to the terms of the Mozilla Public License 2.0 at https://mozilla.org/MPL/2.0/
// © TrendCrypto2022
//@version=5
// strategy("Take profit Multi timeframe", overlay=true, margin_long=100, margin_short=100)
takepercent  = input.bool(title="Take profit %", defval=true ,group="Set up take profit")
takemtf  = input.bool(title="Take profit Multi timeframe", defval=false ,group="Set up take profit")

//Paste your strategy at here. This is example strategy. I use WaveTrend indicator

//WaveTrend indicator
n1 = input(10, "Channel Length")
n2 = input(21, "Average Length")
oblv1 = input(60, "Over Bought Lv 1")
oblv2 = input(53, "Over Bought Lv 2")
oslv1 = input(-60, "Over Sold Lv 1")
oslv2 = input(-53, "Over Sold Lv 2")

ap = hlc3
esa = ta.ema(ap, n1)
d = ta.ema(math.abs(ap - esa), n1)
ci = (ap - esa) / (0.015 * d)
tci = ta.ema(ci, n2)

wt1 = tci
wt2 = ta.sma(wt1,4)

//Strategy
buy = ta.crossover(wt1, wt2) and wt1 < -40
if (buy)
    strategy.entry("Long", strategy.long)


//Resistant in time D and 4H
ema_len1 = input.int(title='Ema1', defval=100, group='Take profit Mtf')
ema_len2 = input.int(title='Ema2', defval=200, group='Take profit Mtf')
src = input.source(title='Source', defval=close, group='Take profit Mtf')
tf1 = input.timeframe(title='Time frame 1', defval='240', group='Take profit Mtf')
tf2 = input.timeframe(title='Time frame 2', defval='D', group='Take profit Mtf')
htf_ma1 = ta.ema(src, ema_len1)
htf_ma2 = ta.ema(src, ema_len2)
ema1 = request.security(syminfo.tickerid, tf1, htf_ma1)
ema2 = request.security(syminfo.tickerid, tf1, htf_ma2)
ema3 = request.security(syminfo.tickerid, tf2, htf_ma1)
ema4 = request.security(syminfo.tickerid, tf2, htf_ma2)

//Plot
plotema1 = plot(ema1, color=color.new(color.silver, 0), style=plot.style_line, linewidth=1, offset=0, title='Ema100 4h', display=display.none)
plotema2 = plot(ema2, color=color.new(color.silver, 0), style=plot.style_line, linewidth=1, offset=0, title='Ema200 4h', display=display.none)
plotema3 = plot(ema3, color=color.new(color.orange, 20), style=plot.style_line, linewidth=1, offset=0, title='Ema100 D', display=display.none)
plotema4 = plot(ema4, color=color.new(color.orange, 20), style=plot.style_line, linewidth=1, offset=0, title='Ema200 D', display=display.none)

//Label take profit multitime frame
var label labelema1 = na
label.delete(labelema1)
labelema1 := label.new(x=time + 120, y=ema1, text='\n*****Ema100 4H: ' + str.tostring(math.round(ema1,4)) + '', color=color.new(#000000, 100), textcolor =  color.yellow, size=size.small, style=label.style_label_left, xloc=xloc.bar_time, yloc=yloc.price)

var label labelema2 = na
label.delete(labelema2)
labelema2 := label.new(x=time + 120, y=ema2, text='\n*****Ema200 4H: ' + str.tostring(math.round(ema2,4)) + '', color=color.new(#000000, 100), textcolor = color.yellow, size=size.small, style=label.style_label_left, xloc=xloc.bar_time, yloc=yloc.price)

var label labelema3 = na
label.delete(labelema3)
labelema3 := label.new(x=time + 120, y=ema3, text='\n*****Ema100 1D: ' + str.tostring(math.round(ema3,4)) + '', color=color.new(#000000, 100), textcolor = color.yellow, size=size.small, style=label.style_label_left, xloc=xloc.bar_time, yloc=yloc.price)

var label labelema4 = na
label.delete(labelema4)
labelema4 := label.new(x=time + 120, y=ema4, text='\n*****Ema200 1D: ' + str.tostring(math.round(ema4,4)) + '', color=color.new(#000000, 100), textcolor = color.yellow, size=size.small, style=label.style_label_left, xloc=xloc.bar_time, yloc=yloc.price)

//Set up take profit %
percent(pcnt) =>
    strategy.position_size != 0 ? math.round(pcnt / 100 * strategy.position_avg_price / syminfo.mintick) : float(na)
TP1=input.float(3, title="TP1 %", step=0.1, group="Take profit %")
TP2=input.float(5, title="TP2 %", step=1, group="Take profit %")
TP3=input.float(6, title="TP3 %", step=1, group="Take profit %")
TP4=input.float(8, title="TP4 %", step=1, group="Take profit %")

SL=input.float(5, title="Stop Loss %", step=1, group="Take profit %")
qty1=input.float(5, title="% Close At TP1", step=1, group="Take profit %")
qty2=input.float(5, title="% Close At TP2", step=1, group="Take profit %")
qty3=input.float(5, title="% Close At TP3", step=1, group="Take profit %")
qty4=input.float(5, title="% Close At TP4", step=1, group="Take profit %")
lossPnt_L = percent(SL)

//Set up take profit multi timeframe
a = array.from((ema1), (ema2), (ema3), (ema4))
tpmtf1 = array.min(a)
tpmtf2 = array.min(a, 2)
tpmtf3 = array.min(a, 3)
tpmtf4 = array.min(a, 4)
//Set up exit
long_sl_level = strategy.position_avg_price - lossPnt_L*syminfo.mintick
if takepercent == true
    strategy.exit("TP1%", "Long", qty_percent = qty1, profit = percent(TP1), loss = lossPnt_L)
    strategy.exit("TP2%", "Long", qty_percent = qty2, profit = percent(TP2), loss = lossPnt_L)
    strategy.exit("TP3%", "Long", qty_percent = qty3, profit = percent(TP3), loss = lossPnt_L)
    strategy.exit("TP4%", "Long", qty_percent = qty4, profit = percent(TP3), loss = lossPnt_L)
    strategy.close_all(when= ta.crossunder(wt1, wt2) and wt1 > 0, comment="Close All")


if takemtf == true and array.max(a, 1) > strategy.position_avg_price
    strategy.exit("TP1Mtf", "Long", qty_percent = qty1, limit = tpmtf1, stop = long_sl_level)
    strategy.exit("TP2Mtf", "Long", qty_percent = qty2, limit = tpmtf2, stop = long_sl_level)
    strategy.exit("TP3Mtf", "Long", qty_percent = qty3, limit = tpmtf3, stop = long_sl_level)
    strategy.close_all(when= ta.crossunder(wt1, wt2) and wt1 > 0, comment="Close All")

// Plot TP & SL
long_tp1_level = strategy.position_avg_price + percent(TP1)*syminfo.mintick
long_tp2_level = strategy.position_avg_price + percent(TP2)*syminfo.mintick
long_tp3_level = strategy.position_avg_price + percent(TP3)*syminfo.mintick
long_tp4_level = strategy.position_avg_price + percent(TP4)*syminfo.mintick

plot(strategy.position_size > 0 ? long_sl_level : na, color=color.red, style=plot.style_linebr, title="SL Long")

plot(strategy.position_size > 0 ? long_tp1_level : na, color=color.lime, style=plot.style_linebr, title="Long TP1%")
plot(strategy.position_size > 0 ? long_tp2_level : na, color=color.lime, style=plot.style_linebr, title="Long TP2%")
plot(strategy.position_size > 0 ? long_tp3_level : na, color=color.lime, style=plot.style_linebr, title="Long TP3%")
plot(strategy.position_size > 0 ? long_tp4_level : na, color=color.lime, style=plot.style_linebr, title="Long TP4%")

plot(strategy.position_size > 0 ? tpmtf1 : na, color=color.orange, style=plot.style_linebr, title="Long TP1Mtf", display = display.none)
plot(strategy.position_size > 0 ? tpmtf2 : na, color=color.orange, style=plot.style_linebr, title="Long TP2Mtf", display = display.none)
plot(strategy.position_size > 0 ? tpmtf3 : na, color=color.orange, style=plot.style_linebr, title="Long TP3Mtf", display = display.none)

//Label TP
if strategy.position_size > 0
    var label labellongtp1 = na
    label.delete(labellongtp1)
    labellongtp1 := label.new(x=time + 120, y=long_tp1_level, text='\nTP1: ' + str.tostring(math.round(long_tp1_level,2)) + '', color=color.new(#000000, 100), textcolor = color.lime, size=size.small, style=label.style_label_left, xloc=xloc.bar_time, yloc=yloc.price)

    var label labellongtp2 = na
    label.delete(labellongtp2)
    labellongtp2 := label.new(x=time + 120, y=long_tp2_level, text='\nTP2: ' + str.tostring(math.round(long_tp2_level,2)) + '', color=color.new(#000000, 100), textcolor = color.lime, size=size.small, style=label.style_label_left, xloc=xloc.bar_time, yloc=yloc.price)

    var label labellongtp3 = na
    label.delete(labellongtp3)
    labellongtp3 := label.new(x=time + 120, y=long_tp3_level, text='\nTP3: ' + str.tostring(math.round(long_tp3_level,2)) + '', color=color.new(#000000, 100), textcolor = color.lime, size=size.small, style=label.style_label_left, xloc=xloc.bar_time, yloc=yloc.price)

    var label labellongtp4 = na
    label.delete(labellongtp4)
    labellongtp4 := label.new(x=time + 120, y=long_tp4_level, text='\nTP4: ' + str.tostring(math.round(long_tp4_level,2)) + '', color=color.new(#000000, 100), textcolor = color.lime, size=size.small, style=label.style_label_left, xloc=xloc.bar_time, yloc=yloc.price)
Detail
https://www.fmz.com/strategy/430557
Last Modified
2023-10-30 12:02:43