
7.0 KiB
Name
多指标趋势动量交易策略基于布林带相对强弱与交易量的综合量化交易系统-Multi-Indicator-Trend-Momentum-Trading-Strategy-A-Comprehensive-Quantitative-Trading-System-Based-on-Bollinger-Bands-RSI-and-OBV
Author
ChaoZhang
Strategy Description
[trans]
概述
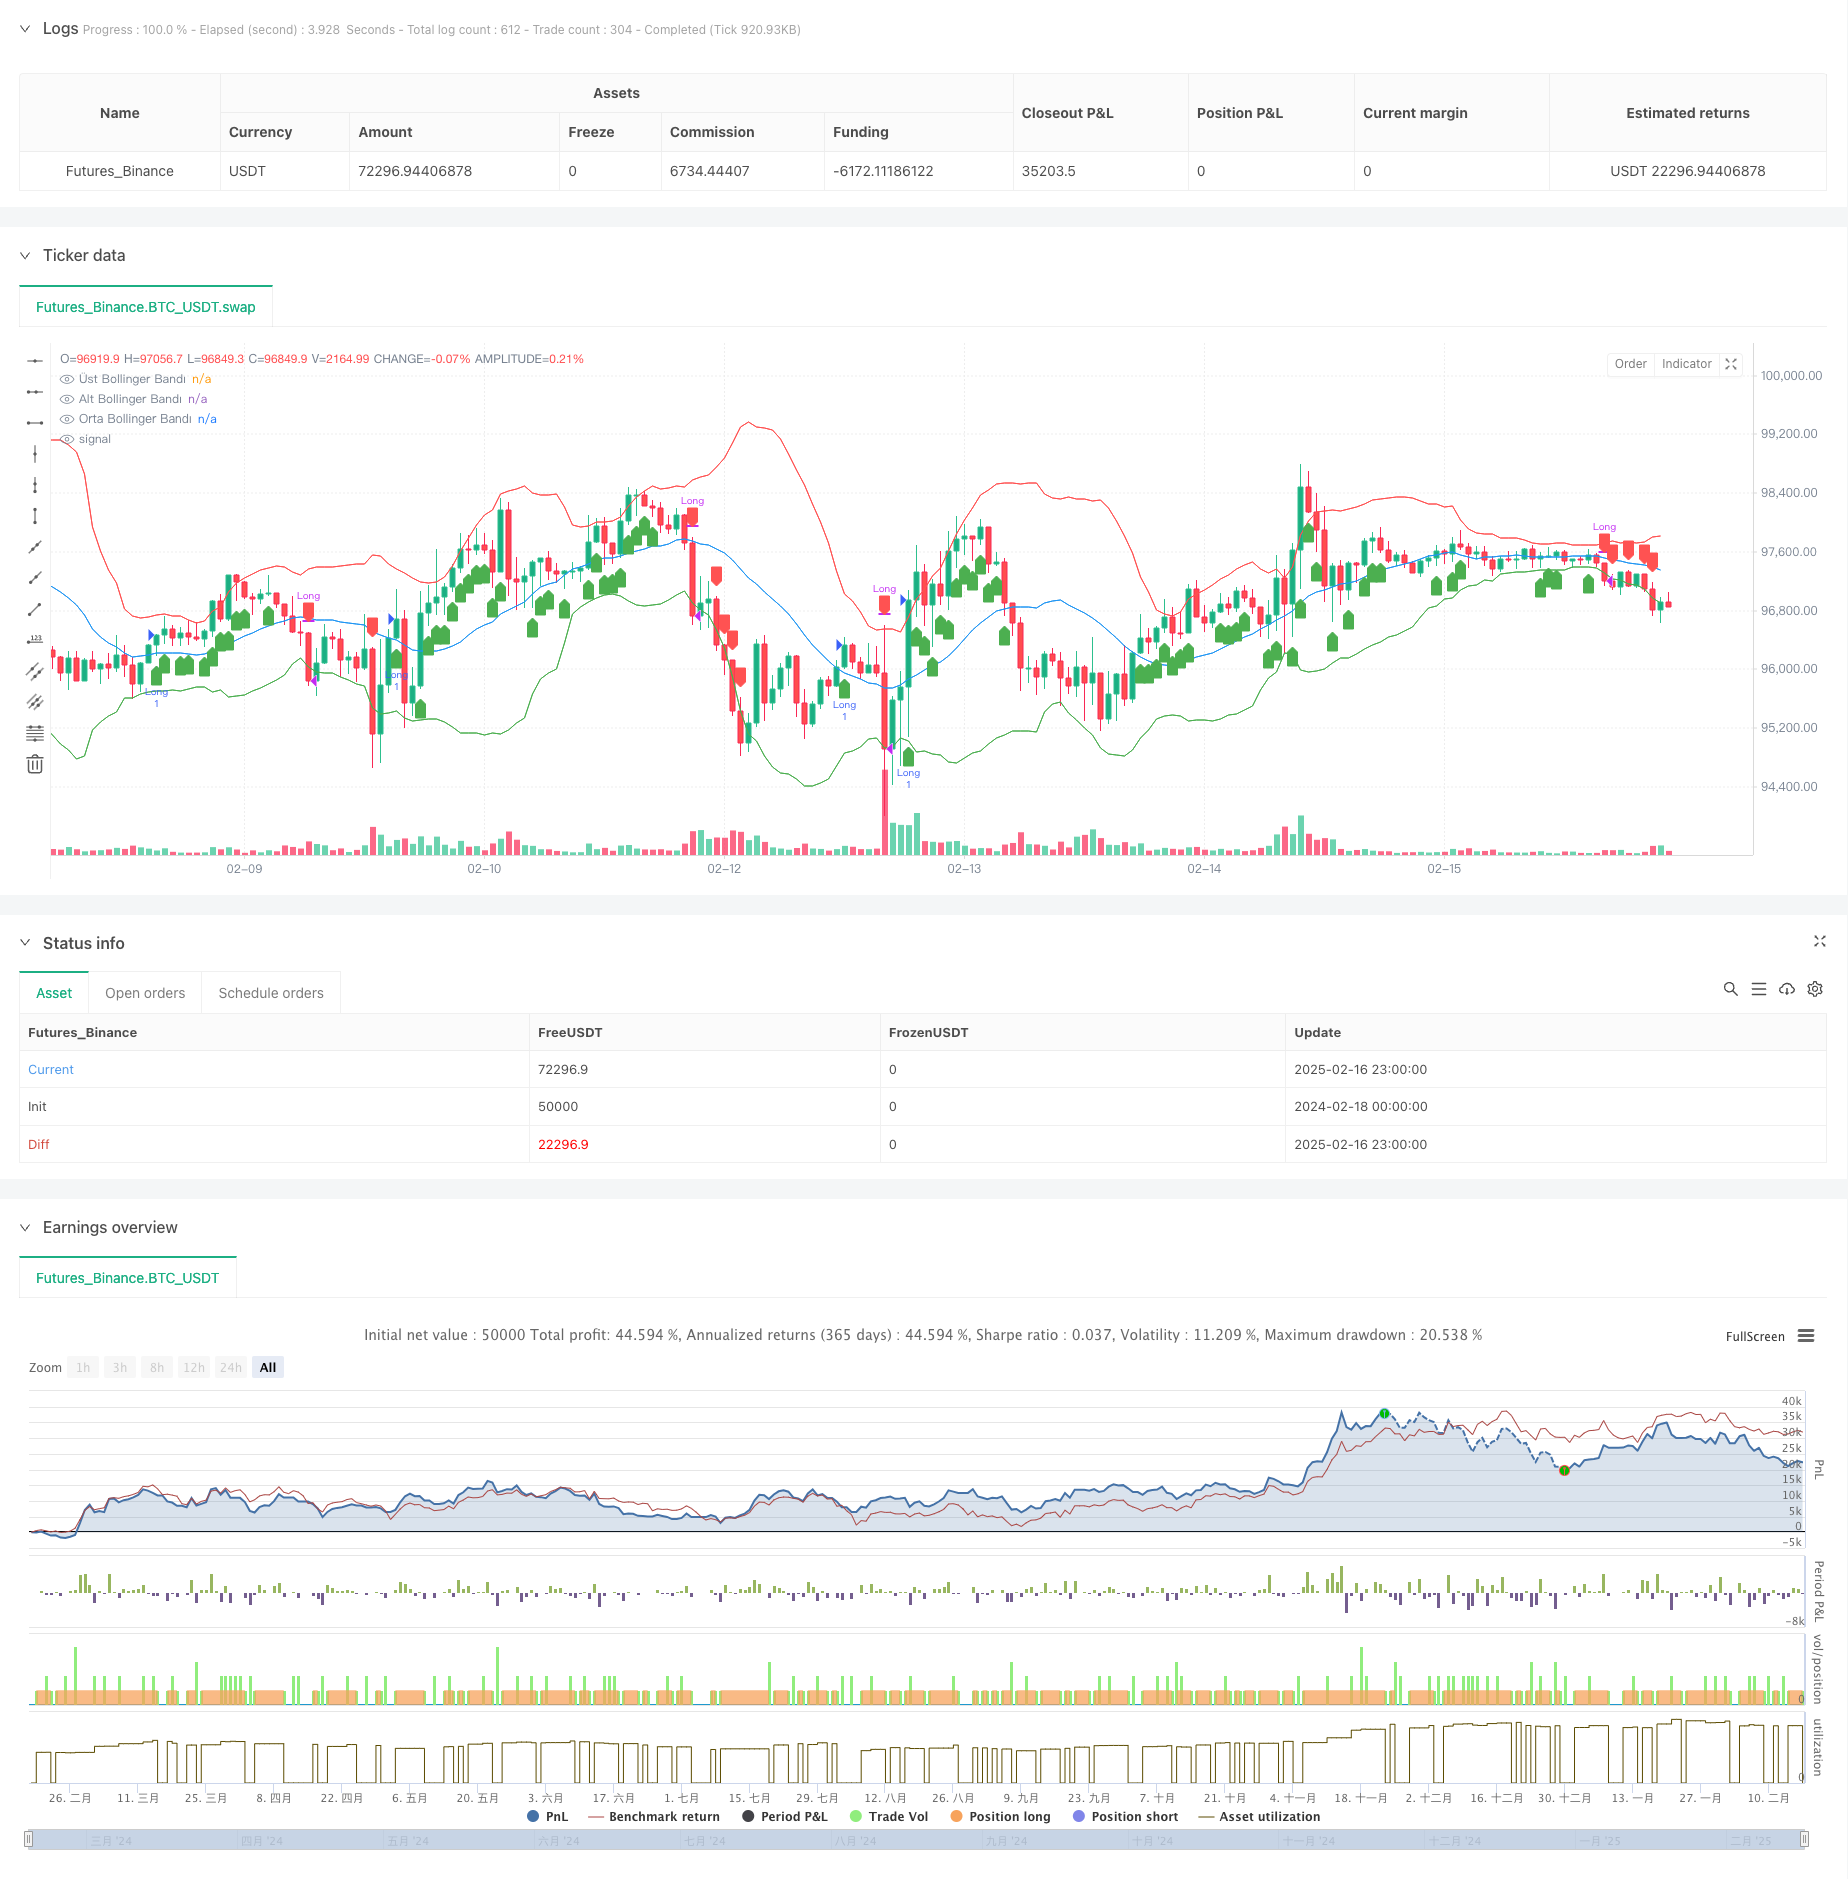
该策略是一个基于多重技术指标的趋势跟踪和动量交易系统。它结合了布林带(Bollinger Bands)、相对强弱指标(RSI)和能量潮指标(OBV)三个主要技术指标,通过分析价格波动、动量和交易量来识别市场趋势和交易机会。策略采用中长期持仓方式,在市场呈现明显上升趋势且动量强劲时进场做多,在价格跌破布林带下轨时平仓出场。
策略原理
策略的核心逻辑基于以下三个方面:
- 使用布林带(BB)判断价格趋势 - 当价格位于布林带中轨之上时,表明上升趋势成立。布林带参数设置为20日均线和2倍标准差。
- 使用相对强弱指标(RSI)确认价格动量 - RSI大于50表明价格具有上升动量。RSI参数设置为14日。
- 使用能量潮指标(OBV)验证交易量支撑 - OBV的10日指数移动平均线上升,说明成交量配合价格上涨。
入场信号需要同时满足:价格高于布林带中轨、RSI大于50、OBV趋势向上。 出场信号为:价格跌破布林带下轨。
策略优势
- 多重技术指标交叉验证,提高信号可靠性
- 结合价格、动量和成交量三个维度分析市场
- 采用趋势跟踪策略,能够抓住大级别行情
- 出场条件明确,有效控制回撤风险
- 指标参数选择合理,避免过度优化
策略风险
- 震荡市场可能频繁交易导致损失
- 趋势反转初期可能形成较大回撤
- 急跌行情可能造成滑点损失
- 交易量指标在某些市场可能失效
- 固定参数设置可能不适应所有市场环境
策略优化方向
- 增加市场环境分类,在不同市场采用不同参数
- 引入止损机制,控制单笔交易风险
- 优化出场机制,提前锁定部分利润
- 增加交易量过滤器,避免假突破
- 加入波动率自适应机制,动态调整参数
总结
该策略是一个稳健的趋势跟踪系统,通过多重技术指标的配合使用,能够有效捕捉市场趋势性机会。策略逻辑清晰,参数设置合理,具有较好的实用性。通过建议的优化方向,策略的稳定性和收益性还可以进一步提升。在实盘应用时,建议根据具体市场特点和资金规模做相应调整。 ||
Overview
This strategy is a trend-following and momentum trading system based on multiple technical indicators. It combines Bollinger Bands (BB), Relative Strength Index (RSI), and On-Balance Volume (OBV) to identify market trends and trading opportunities by analyzing price movements, momentum, and trading volume. The strategy adopts a medium to long-term holding approach, entering long positions when the market shows a clear upward trend with strong momentum and exiting when the price breaks below the lower Bollinger Band.
Strategy Principles
The core logic of the strategy is based on three aspects:
- Using Bollinger Bands (BB) to determine price trends - When price is above the middle band, it confirms an upward trend. BB parameters are set to 20-day moving average and 2 standard deviations.
- Using Relative Strength Index (RSI) to confirm price momentum - RSI above 50 indicates upward momentum. RSI parameter is set to 14 days.
- Using On-Balance Volume (OBV) to verify volume support - Rising 10-day exponential moving average of OBV shows volume confirms price increases.
Entry signals require simultaneous satisfaction of: price above BB middle band, RSI above 50, and upward OBV trend. Exit signal is: price breaking below the lower BB band.
Strategy Advantages
- Multiple technical indicators cross-validation improves signal reliability
- Combines price, momentum, and volume analysis
- Trend-following approach captures major market moves
- Clear exit conditions effectively control drawdown risk
- Reasonable indicator parameters avoid over-optimization
Strategy Risks
- Potential losses from frequent trading in choppy markets
- Significant drawdowns possible during trend reversals
- Slippage losses in sharp decline scenarios
- Volume indicators may be ineffective in certain markets
- Fixed parameters may not adapt to all market conditions
Strategy Optimization Directions
- Add market environment classification for different parameter sets
- Implement stop-loss mechanisms to control single trade risk
- Optimize exit mechanism to lock in partial profits
- Add volume filters to avoid false breakouts
- Incorporate volatility adaptation for dynamic parameter adjustment
Summary
This strategy is a robust trend-following system that effectively captures market trends through the coordinated use of multiple technical indicators. The strategy logic is clear, with reasonable parameter settings and good practicality. Through the suggested optimization directions, the strategy's stability and profitability can be further improved. When applying to live trading, it is recommended to make appropriate adjustments based on specific market characteristics and capital scale.[/trans]
Source (PineScript)
/*backtest
start: 2024-02-18 00:00:00
end: 2025-02-17 00:00:00
period: 1h
basePeriod: 1h
exchanges: [{"eid":"Futures_Binance","currency":"BTC_USDT"}]
*/

// This Pine Script™ code is subject to the terms of the Mozilla Public License 2.0 at https://mozilla.org/MPL/2.0/
// © ahmetkaratas4238

//@version=5
strategy("İstanbul Stratejisi", overlay=true)

// Bollinger Bantları Hesaplamaları
bbLength = 20
bbMult = 2.0
basis = ta.sma(close, bbLength)
dev = bbMult * ta.stdev(close, bbLength)
upperBand = basis + dev
lowerBand = basis - dev

// RSI Hesaplamaları
rsiLength = 14
rsi = ta.rsi(close, rsiLength)
rsiThreshold = 50

// OBV Hesaplaması
obv = ta.cum(volume * math.sign(ta.change(close)))  // ta.cum yerine ta.cumulative kullanılmalı
obvTrend = ta.ema(obv, 10) > ta.ema(obv[1], 10)  // OBV'nin yükseliş trendinde olup olmadığını kontrol eder

// ALIM ŞARTLARI
buyCondition = close > basis and rsi > rsiThreshold and obvTrend

// SATIM ŞARTI
sellCondition = close < lowerBand

// Alım İşlemi Aç
if buyCondition
    strategy.entry("Long", strategy.long)

// Satım İşlemi Yap (Pozisyon Kapat)
if sellCondition
    strategy.close("Long")

// Bollinger Bantlarını Göster
plot(upperBand, title="Üst Bollinger Bandı", color=color.red)
plot(lowerBand, title="Alt Bollinger Bandı", color=color.green)
plot(basis, title="Orta Bollinger Bandı", color=color.blue)

// Alım ve Satım Sinyallerini İşaretle
plotshape(series=buyCondition, location=location.belowbar, color=color.green, style=shape.labelup, title="Alım Sinyali")
plotshape(series=sellCondition, location=location.abovebar, color=color.red, style=shape.labeldown, title="Satım Sinyali")
Detail
https://www.fmz.com/strategy/482464
Last Modified
2025-02-18 15:24:56