
20 KiB
Name
多指数均线交叉动量预警交易策略-Multi-EMA-Crossover-Momentum-Alert-Trading-Strategy
Author
ianzeng123
Strategy Description
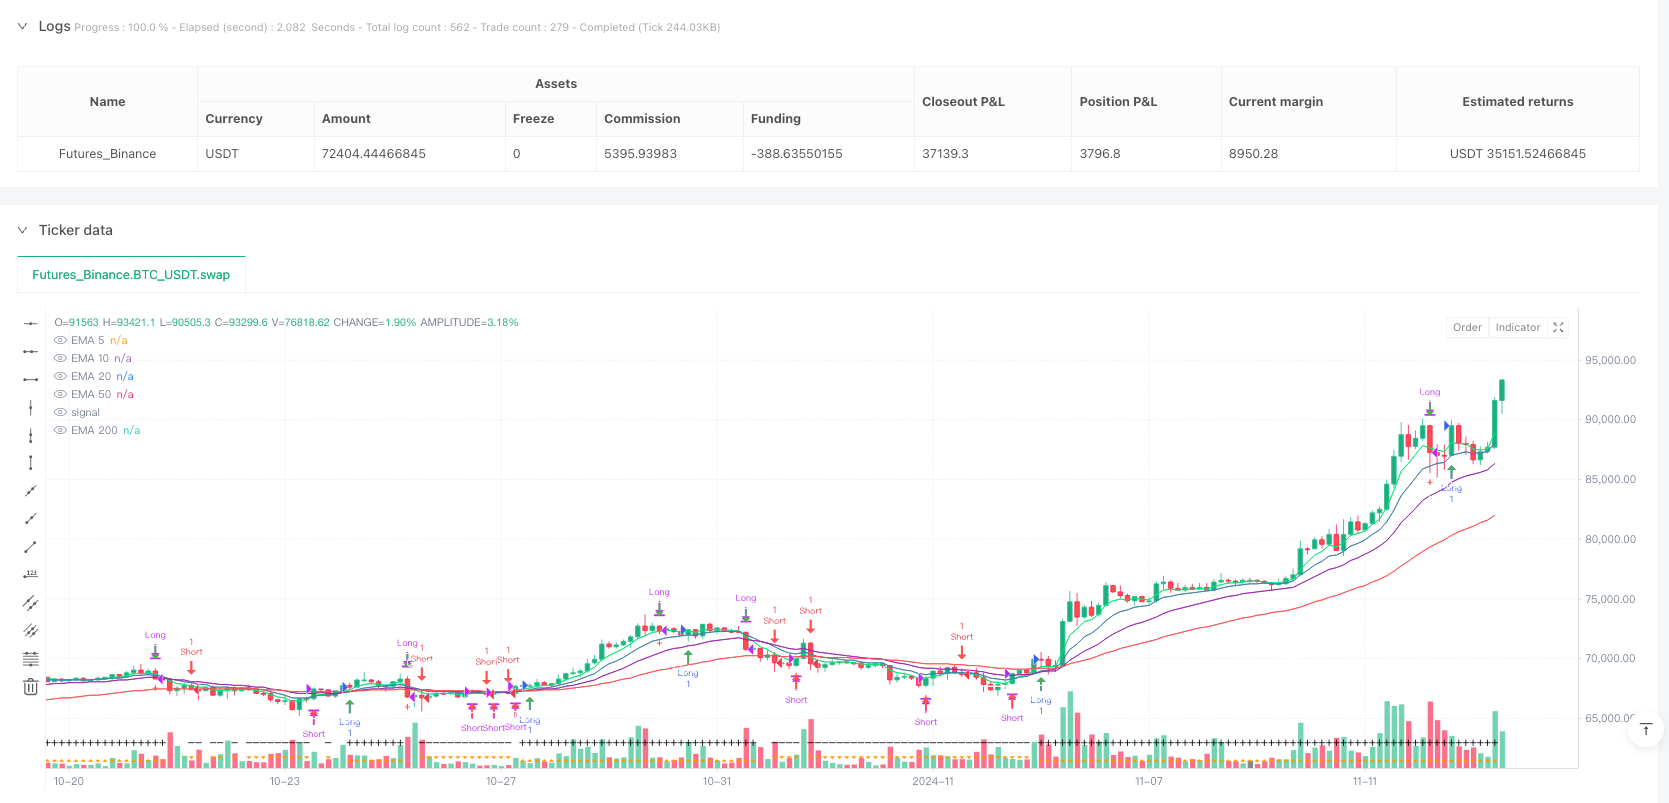
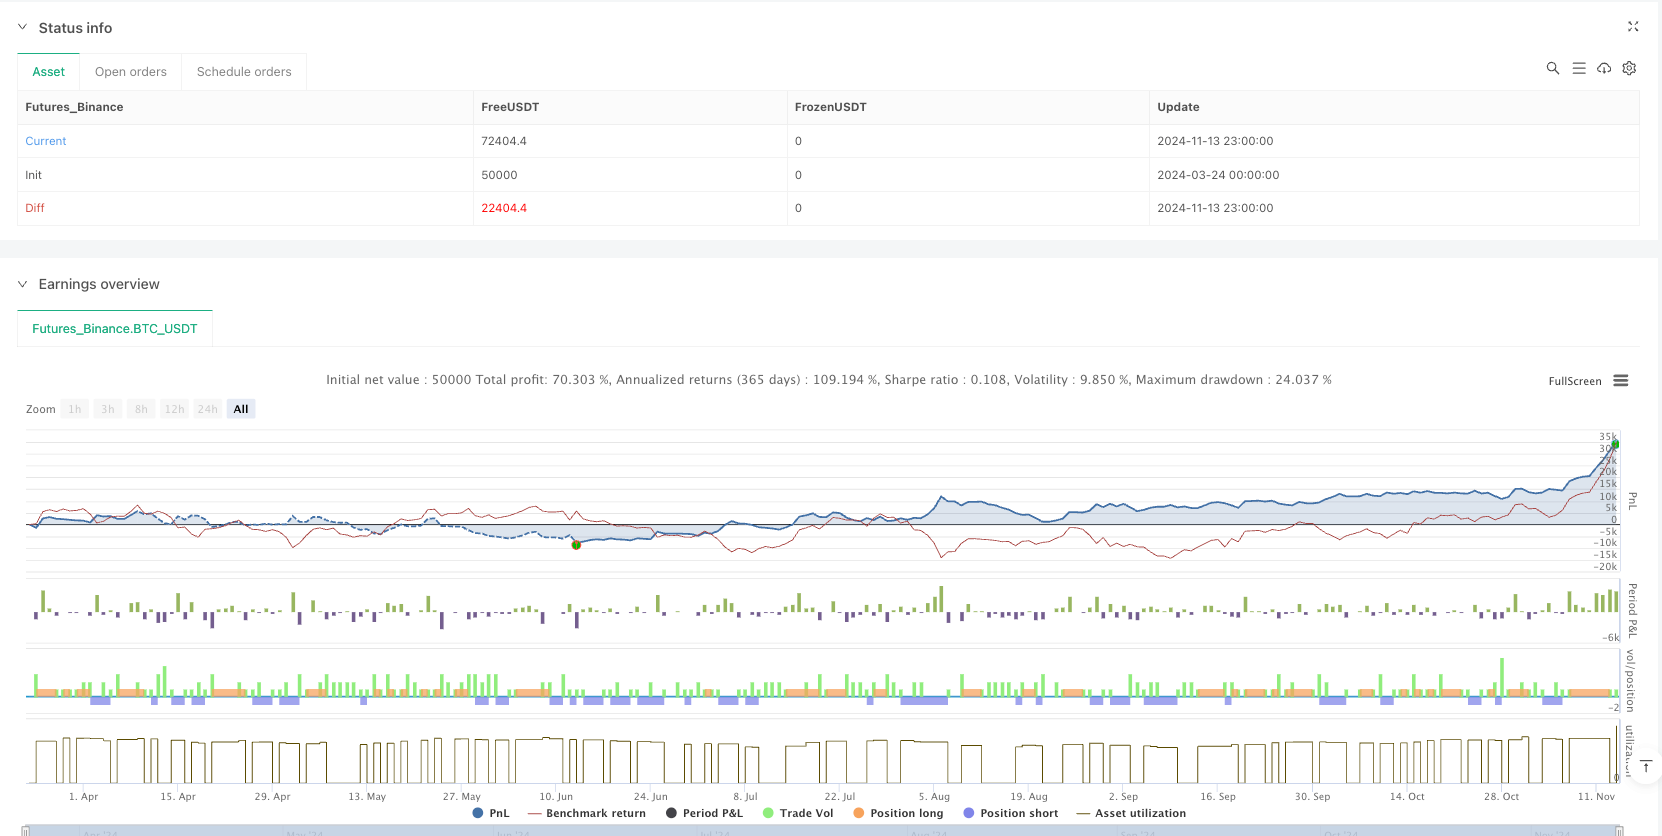
[trans]
概述
这是一个基于多重指数移动平均线(EMA)的交易策略,结合了趋势跟踪、动量确认和波动预警系统。该策略主要利用5、10、15、20、50和200日EMA交叉信号来确定市场方向,同时设计了智能冷却期和风险预警机制,帮助交易者在适当时机开仓和平仓。策略将交易机会分为看涨(Call)和看跌(Put)两种情况,分别在上升趋势和下降趋势中应用,通过多重条件筛选,优化了交易时机的选择。
策略原理
该策略的核心逻辑建立在多重EMA交叉和趋势确认的基础上:
-
趋势判断机制: 通过10日EMA与20日EMA的相对位置以及收盘价与50日EMA的关系判断市场趋势。当10日EMA位于20日EMA之上且收盘价高于50日EMA时,判定为上升趋势;反之则为下降趋势。
-
动量确认: 策略引入了5日EMA作为短期动量指标。在看涨信号中,要求5日EMA高于前一周期且高于10日EMA;在看跌信号中,要求5日EMA低于前一周期且低于10日EMA,从而确保交易方向与短期动量一致。
-
智能进出场规则:
- 看涨信号(Call): 在上升趋势确认且短期动量向上时开仓,当价格跌破15日EMA时平仓。
- 看跌信号(Put): 在下降趋势确认且短期动量向下时开仓,当价格上穿15日EMA时平仓。
-
冷却期机制: 策略设计了灵活的冷却期设置,默认为2个周期,防止在平仓后立即开仓导致的频繁交易。用户可根据市场特性调整该参数。
-
风险预警系统: A通过计算5日EMA与10日EMA之间百分比差异的变化率,当最新变化率超过前5个周期平均变化率的2.5倍且当前差异小于前一周期时,触发预警信号,提示潜在的市场异常波动,可选择自动平仓以规避风险。
策略优势
-
多层次趋势确认: 通过多周期EMA交叉验证,减少了假突破信号,提高了交易的可靠性。策略结合了短期(5、10日)、中期(15、20日)和长期(50、200日)移动平均线,全面评估市场趋势状况。
-
动态适应性: 策略能够根据市场趋势的变化自动切换交易方向,在上涨市场寻找看涨机会,在下跌市场寻找看跌机会,具有良好的市场适应性。
-
风险管理机制完善: 预警系统能够检测到市场异常波动,及时发出警报并可选择自动平仓,有效控制回撤风险。冷却期机制则避免了过度交易,降低了交易成本和情绪化交易的风险。
-
参数可定制性: 策略提供了丰富的参数设置选项,用户可以根据不同市场环境和个人风险偏好调整EMA周期、冷却期长度和预警敏感度等关键参数。
-
视觉化交易信号: 策略通过形状和颜色明确标示交易信号,绿色箭头表示看涨信号,红色箭头表示看跌信号,底部三角形指示当前趋势方向,使交易决策直观明了。
策略风险
-
均线滞后性: 移动平均线本质上是滞后指标,在震荡市场或快速反转市场中可能导致入场和出场信号延迟,造成潜在的损失。为减轻这一风险,可考虑引入领先指标作为辅助确认。
-
假突破风险: 尽管策略使用多重均线交叉和动量确认来减少假信号,但在市场横盘整理阶段,仍可能出现均线频繁交叉导致的错误信号。建议在低波动率市场环境下谨慎使用或调整参数。
-
剧烈波动风险: 在市场大幅波动时,预警系统可能无法及时响应突发性的价格变动。可以考虑增加ATR(真实波幅)等波动率指标,设置动态止损以提供额外保护。
-
参数优化陷阱: 过度优化参数可能导致策略在历史数据上表现出色但在未来市场中失效。建议通过步进优化和样本外测试来验证参数的稳健性。
-
长期趋势转变风险: 策略可能在长期趋势转变初期产生连续损失信号。可以考虑增加200日EMA等长期趋势指标的权重,或在趋势不明确时减小仓位大小。
策略优化方向
-
自适应参数调整: 当前策略使用固定的EMA周期,可以引入自适应机制,根据市场波动性动态调整EMA周期长度。例如,在高波动市场中使用较长的EMA周期以减少噪音,在低波动市场中使用较短的EMA周期以提高灵敏度。
-
多时间框架分析: 增加更高时间框架的趋势确认,只在主趋势方向上交易,可以显著提高胜率。例如,只有当日线和4小时图同时呈现上升趋势时才开仓看涨头寸。
-
止损优化: 目前策略的平仓条件较为简单(15日EMA),可以引入动态止损机制,如基于ATR的波动率止损或跟踪止损,以在保留盈利的同时限制单笔交易的最大损失。
-
资金管理整合: 添加基于风险的头寸规模调整,根据市场波动性和交易信号强度动态决定每笔交易的资金比例,从而优化整体风险回报比。
-
情绪指标补充: 结合交易量、成交量加权平均价格(VWAP)或市场广度指标,可以增强趋势确认的可靠性。特别是在重要支撑位和阻力位附近,市场情绪指标可以提供额外的确认。
-
机器学习优化: 利用机器学习技术对信号进行分类和筛选,识别出高胜率交易环境的特征,避免在不利市场条件下交易,可以显著提高策略的整体表现。
总结
多指数均线交叉动量预警交易策略是一个结构完善的量化交易系统,通过多层次EMA交叉信号、动量确认、冷却期机制和风险预警系统,创建了一个全面的交易决策框架。策略在趋势市场中表现出色,同时具备应对异常市场波动的防御机制。
该策略的主要优势在于其全面的趋势判断机制和完善的风险控制系统,使其能够在不同市场环境中保持稳定表现。然而,作为基于均线的交易系统,策略仍面临滞后性和假突破等固有风险。
未来优化可以集中在参数自适应、多时间框架分析、动态止损和风险管理等方面,进一步提高策略的稳健性和适应性。通过引入机器学习技术和市场情绪指标,可以实现策略性能的质的飞跃,使其在各种市场条件下保持竞争力。 ||
Overview
This is a trading strategy based on multiple Exponential Moving Averages (EMAs), combining trend following, momentum confirmation, and volatility alert systems. The strategy primarily utilizes 5, 10, 15, 20, 50, and 200-day EMA crossover signals to determine market direction, while incorporating an intelligent cooldown period and risk warning mechanism to help traders open and close positions at appropriate times. The strategy categorizes trading opportunities into Call and Put scenarios, applied in uptrends and downtrends respectively, optimizing trade entry and exit timing through multiple filtering conditions.
Strategy Principles
The core logic of this strategy is built on multiple EMA crossovers and trend confirmation:
-
Trend Determination Mechanism: Market trends are identified by the relative position of the 10-day EMA to the 20-day EMA, as well as the relationship between closing price and the 50-day EMA. When the 10-day EMA is above the 20-day EMA and the closing price is above the 50-day EMA, an uptrend is established; otherwise, it's considered a downtrend.
-
Momentum Confirmation: The strategy incorporates the 5-day EMA as a short-term momentum indicator. For bullish signals, it requires the 5-day EMA to be higher than the previous period and above the 10-day EMA; for bearish signals, it requires the 5-day EMA to be lower than the previous period and below the 10-day EMA, ensuring trade direction aligns with short-term momentum.
-
Intelligent Entry and Exit Rules:
- Call Signals: Open positions when uptrend is confirmed and short-term momentum is rising; close positions when price falls below the 15-day EMA.
- Put Signals: Open positions when downtrend is confirmed and short-term momentum is falling; close positions when price rises above the 15-day EMA.
-
Cooldown Period Mechanism: The strategy features a flexible cooldown period setting, defaulting to 2 periods, preventing frequent trading caused by immediate re-entry after closing positions. Users can adjust this parameter based on market characteristics.
-
Risk Warning System: By calculating the rate of change in percentage differences between the 5-day and 10-day EMAs, the system triggers a warning signal when the latest rate of change exceeds 2.5 times the average of the previous 5 periods and the current difference is smaller than the previous period. This alerts to potential abnormal market volatility and can optionally trigger automatic position closure to mitigate risk.
Strategy Advantages
-
Multi-level Trend Confirmation: Through multi-period EMA crossover verification, the strategy reduces false breakout signals, enhancing trading reliability. It combines short-term (5, 10-day), medium-term (15, 20-day), and long-term (50, 200-day) moving averages to comprehensively assess market trend conditions.
-
Dynamic Adaptability: The strategy automatically switches trading direction according to changing market trends, seeking bullish opportunities in rising markets and bearish opportunities in falling markets, demonstrating good market adaptability.
-
Comprehensive Risk Management: The warning system can detect abnormal market volatility, promptly issue alerts, and optionally close positions automatically, effectively controlling drawdown risk. The cooldown mechanism prevents overtrading, reducing transaction costs and the risk of emotional trading.
-
Parameter Customizability: The strategy offers rich parameter setting options, allowing users to adjust key parameters such as EMA periods, cooldown length, and warning sensitivity based on different market environments and personal risk preferences.
-
Visualized Trading Signals: The strategy clearly marks trading signals through shapes and colors, with green arrows for bullish signals, red arrows for bearish signals, and bottom triangles indicating current trend direction, making trading decisions intuitive and clear.
Strategy Risks
-
Moving Average Lag: Moving averages are inherently lagging indicators and may cause delayed entry and exit signals in oscillating markets or rapid reversal markets, resulting in potential losses. To mitigate this risk, consider introducing leading indicators as supplementary confirmation.
-
False Breakout Risk: Despite using multiple moving average crossovers and momentum confirmation to reduce false signals, frequent crossovers during market consolidation phases may still generate erroneous signals. Caution is advised when using this strategy in low-volatility market environments, or parameter adjustments may be necessary.
-
Severe Volatility Risk: During significant market fluctuations, the warning system may not respond promptly to sudden price movements. Consider adding volatility indicators such as ATR (Average True Range) and setting dynamic stop losses to provide additional protection.
-
Parameter Optimization Trap: Excessive parameter optimization may result in a strategy that performs excellently on historical data but fails in future markets. Step-wise optimization and out-of-sample testing are recommended to verify parameter robustness.
-
Long-term Trend Reversal Risk: The strategy may generate consecutive loss signals during the initial phase of long-term trend changes. Consider increasing the weight of long-term trend indicators such as the 200-day EMA, or reducing position size when trends are unclear.
Strategy Optimization Directions
-
Adaptive Parameter Adjustment: The current strategy uses fixed EMA periods. An adaptive mechanism could be introduced to dynamically adjust EMA period lengths based on market volatility. For example, using longer EMA periods in high-volatility markets to reduce noise, and shorter EMA periods in low-volatility markets to increase sensitivity.
-
Multi-timeframe Analysis: Adding trend confirmation from higher timeframes and trading only in the direction of the main trend can significantly improve win rates. For instance, only taking long positions when both daily and 4-hour charts show uptrends.
-
Stop Loss Optimization: The current strategy's exit condition is relatively simple (15-day EMA). Dynamic stop-loss mechanisms could be introduced, such as volatility-based stops using ATR or trailing stops, to limit maximum loss per trade while preserving profits.
-
Money Management Integration: Adding position sizing based on risk, dynamically determining the proportion of capital for each trade according to market volatility and signal strength, thereby optimizing overall risk-reward ratio.
-
Sentiment Indicator Supplement: Combining volume, Volume Weighted Average Price (VWAP), or market breadth indicators can enhance the reliability of trend confirmation. Especially near important support and resistance levels, market sentiment indicators can provide additional confirmation.
-
Machine Learning Optimization: Using machine learning techniques to classify and filter signals, identifying characteristics of high-probability trading environments and avoiding trading in unfavorable market conditions can significantly improve overall strategy performance.
Summary
The Multi-EMA Crossover Momentum Alert Trading Strategy is a well-structured quantitative trading system that creates a comprehensive trading decision framework through multi-level EMA crossover signals, momentum confirmation, cooldown mechanisms, and a risk warning system. The strategy performs excellently in trending markets while possessing defensive mechanisms to handle abnormal market volatility.
The main advantages of this strategy lie in its comprehensive trend determination mechanism and well-developed risk control system, enabling it to maintain stable performance across different market environments. However, as a moving average-based trading system, the strategy still faces inherent risks such as lag and false breakouts.
Future optimizations can focus on parameter adaptivity, multi-timeframe analysis, dynamic stop losses, and risk management to further enhance the strategy's robustness and adaptability. By introducing machine learning techniques and market sentiment indicators, a qualitative leap in strategy performance can be achieved, maintaining its competitiveness across various market conditions.[/trans]
Source (PineScript)
/*backtest
start: 2024-03-24 00:00:00
end: 2024-11-14 00:00:00
period: 3h
basePeriod: 3h
exchanges: [{"eid":"Futures_Binance","currency":"BTC_USDT"}]
*/

//@version=6
strategy(title='GRIM309 CallPut Strategy', shorttitle='CallsPuts Strategy', overlay=true, initial_capital=500, commission_value=0.1)

// Input parameters for EMAs
len5 = input.int(5, minval=1, title='5 EMA Length')
len10 = input.int(10, minval=1, title='10 EMA Length')
len15 = input.int(15, minval=1, title='15 EMA Length')
len20 = input.int(20, minval=1, title='20 EMA Length')
len50 = input.int(50, minval=1, title='50 EMA Length')
len200 = input.int(200, minval=1, title='200 EMA Length')

// EMA calculations
ema5 = ta.ema(close, len5)
ema10 = ta.ema(close, len10)
ema15 = ta.ema(close, len15)
ema20 = ta.ema(close, len20)
ema50 = ta.ema(close, len50)
ema200 = ta.ema(close, len200)

// Plot EMAs with specified colors
plot(ema5, title='EMA 5', color=color.lime)
plot(ema10, title='EMA 10', color=color.rgb(64, 131, 170))
plot(ema20, title='EMA 20', color=color.purple)
plot(ema50, title='EMA 50', color=color.red)
plot(ema200, title='EMA 200', color=color.white)

// Determine trend conditions
uptrend = ema10 > ema20 and close > ema50
downtrend = ema10 < ema20 and close < ema50

// Plot trend indicators at the bottom of the chart
plotshape(series=uptrend, location=location.bottom, color=color.orange, style=shape.triangleup, text='+', title='Uptrend Indicator')
plotshape(series=downtrend, location=location.bottom, color=color.orange, style=shape.triangledown, text='-', title='Downtrend Indicator')

// Position state variable
var int positionState = 0  // 0 = no position, 1 = long, -1 = short

// Cooldown period settings (dont open right after a close)
cooldownBars = input.int(2, minval=1, title='Cooldown Period (bars)')
var int barsSinceClose = na

// Additional check for EMA5 trend confirmation (optional check to see that it is already in momentum short term)
emaCheckCall = ema5 > ema5[1] and ema5 > ema10
emaCheckPut = ema5 < ema5[1] and ema5 < ema10

// Open and close conditions for calls
openCalls = uptrend and emaCheckCall and positionState == 0 and (na(barsSinceClose) or barsSinceClose >= cooldownBars)
closeCalls = positionState == 1 and (close <= ema15)

// Open and close conditions for puts
openPuts = downtrend and emaCheckPut and positionState == 0 and (na(barsSinceClose) or barsSinceClose >= cooldownBars)
closePuts = positionState == -1 and (close >= ema15)

// --- WARNING SYSTEM ---

// Calculate recent percentage differences between ema5 and ema10
diffNow = (ema5 - ema10) / ema10 * 100
diff1 = (ema5[1] - ema10[1]) / ema10[1] * 100
diff2 = (ema5[2] - ema10[2]) / ema10[2] * 100
diff3 = (ema5[3] - ema10[3]) / ema10[3] * 100
diff4 = (ema5[4] - ema10[4]) / ema10[4] * 100
diff5 = (ema5[5] - ema10[5]) / ema10[5] * 100

if diffNow < 0
    diffNow:=diffNow*-1
if diff1 < 0
    diff1:=diff1*-1
if diff2 < 0
    diff2:=diff2*-1
if diff3 < 0
    diff3:=diff3*-1
if diff4 < 0
    diff4:=diff4*-1
if diff5 < 0
    diff5:=diff5*-1

// Compute average of last 5 changes
avgChange = (math.abs(diff1 - diff2) + math.abs(diff2 - diff3) + math.abs(diff3 - diff4) + math.abs(diff4 - diff5)) / 4

// Check if latest change is more than double the average
isWarning = positionState != 0 and math.abs(diffNow - diff1) > 2.5 * avgChange and diffNow < diff1

// Draw warning symbol
plotshape(series=isWarning, location=location.belowbar, color=color.red, style=shape.cross, text='⚠', textcolor=color.white, title='Warning Signal')

if isWarning //optional, close position if a warning emits
    if positionState == 1  // Only close calls if the last position was a long
        closeCalls := true
    if positionState == -1 // Only close puts if the last position was a short
        closePuts := true

// Update position state and cooldown counter based on signals
if (openCalls)
    strategy.entry('Long', strategy.long)
    positionState := 1
    barsSinceClose := na  // Reset cooldown counter when opening a position

if (closeCalls)
    strategy.close('Long')
    positionState := 0
    barsSinceClose := 0  // Start cooldown counter when closing a position

if (openPuts)
    strategy.entry('Short', strategy.short)
    positionState := -1
    barsSinceClose := na  // Reset cooldown counter when opening a position

if (closePuts)
    strategy.close('Short')
    positionState := 0
    barsSinceClose := 0  // Start cooldown counter when closing a position

// Increment cooldown counter if it's active
if (not na(barsSinceClose))
    barsSinceClose += 1

// Plot open and close signals for Calls
plotshape(series=openCalls, location=location.belowbar, color=color.green, style=shape.arrowup, text='Open', textcolor=color.white, title='Open call position')
plotshape(series=closeCalls, location=location.abovebar, color=color.green, style=shape.arrowdown, text='Close', textcolor=color.white, title='Close call position')

// Plot open and close signals for Puts
plotshape(series=openPuts, location=location.abovebar, color=color.red, style=shape.arrowdown, text='Open', textcolor=color.white, title='Open put position')
plotshape(series=closePuts, location=location.belowbar, color=color.red, style=shape.arrowup, text='Close', textcolor=color.white, title='Close put position')
Detail
https://www.fmz.com/strategy/488010
Last Modified
2025-03-24 13:49:59